
General Industrial Oils Market Size and Share
Market Overview
| Study Period | 2021 - 2031 |
|---|---|
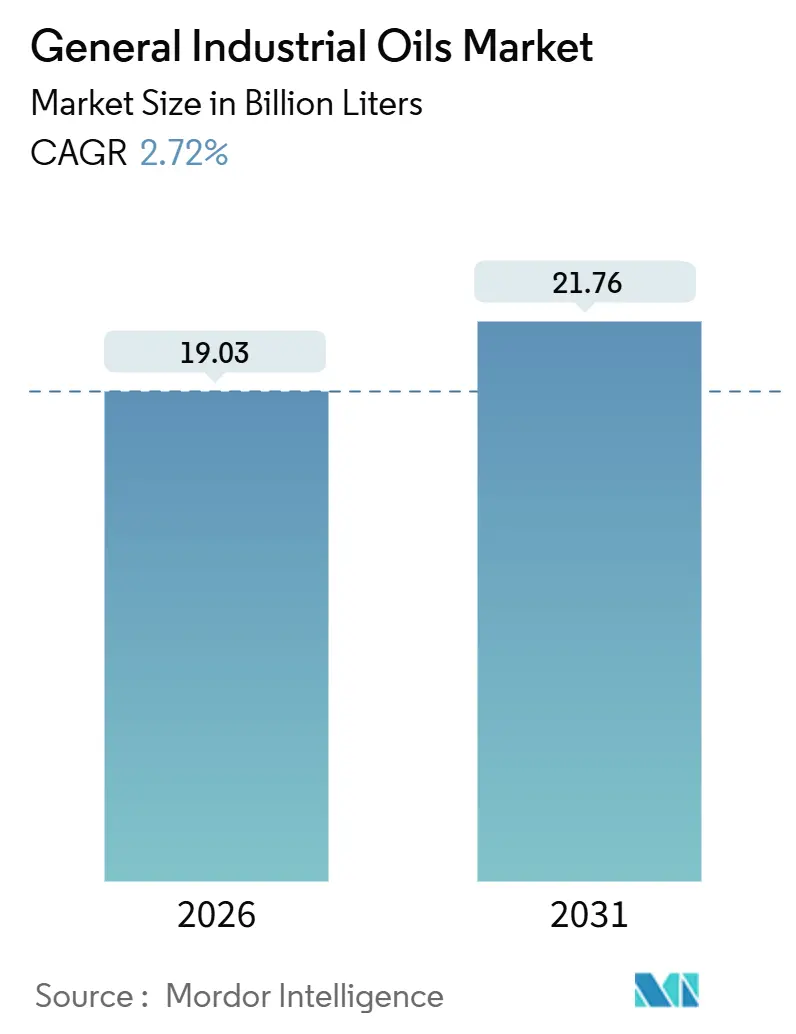
| Market Volume (2026) | 19.03 Billion liters |
| Market Volume (2031) | 21.76 Billion liters |
| Growth Rate (2026 - 2031) | 2.72% CAGR |
| Fastest Growing Market | Middle East and Africa |
| Largest Market | Asia Pacific |
| Market Concentration | Medium |
Major Players *Disclaimer: Major Players sorted in no particular order Image © Mordor Intelligence. Reuse requires attribution under CC BY 4.0. | |
General Industrial Oils Market Analysis by Mordor Intelligence
The General Industrial Oils Market size is estimated at 19.03 Billion liters in 2026, and is expected to reach 21.76 Billion liters by 2031, at a CAGR of 2.72% during the forecast period (2026-2031). Electrification is eroding volumes in legacy mechanical systems, yet the General industrial oils market continues to gain value from high-performance niches such as turbine-condition monitoring and data-center immersion cooling. OEM specification tightening is accelerating a shift toward Group III, polyalphaolefin, and bio-based formulations that command premiums of 40-60% over mineral counterparts. Asia-Pacific leads the General industrial oils market with 46.12% of 2025 volume, anchored by China’s refinery additions, while the Middle East and Africa show the fastest regional momentum at a 2.93% CAGR as gas-based megaprojects scale. Competitive intensity is rising as integrated majors defend share against specialty independents that pair narrowly engineered chemistries with digital service layers.
Key Report Takeaways
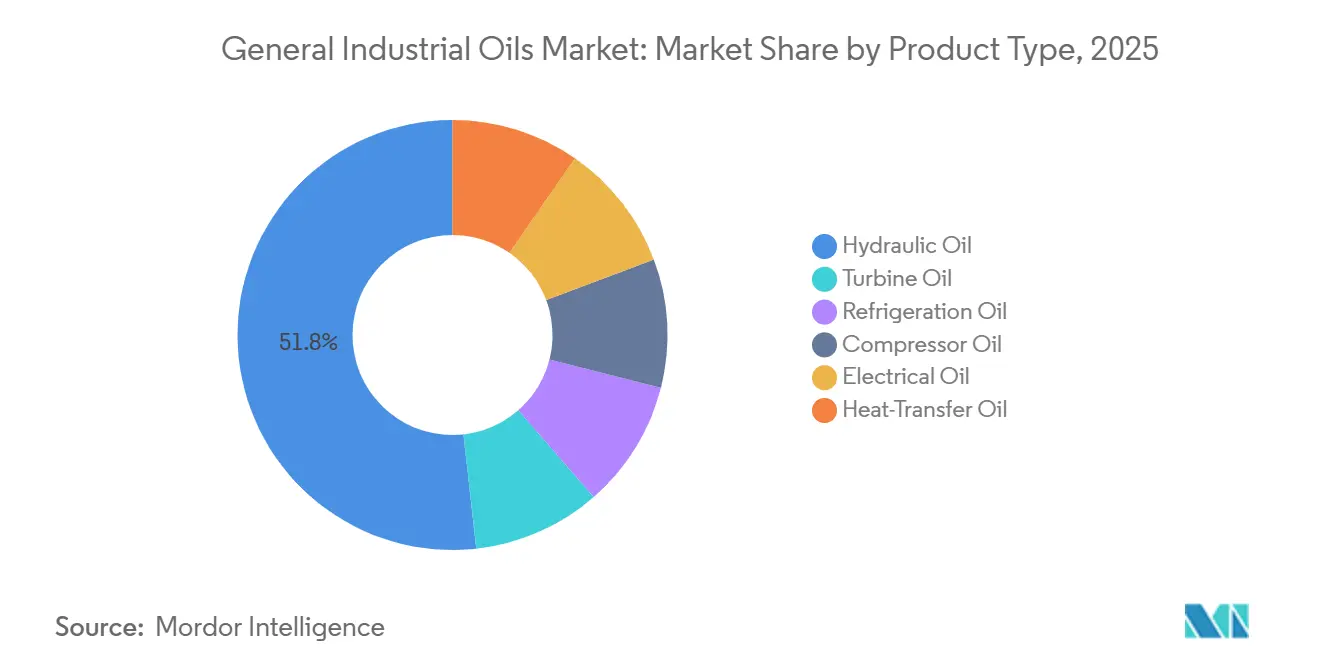
- Hydraulic oil captured 51.77% of the General industrial oils market share in 2025; turbine oil is advancing at a 2.91% CAGR to 2031.
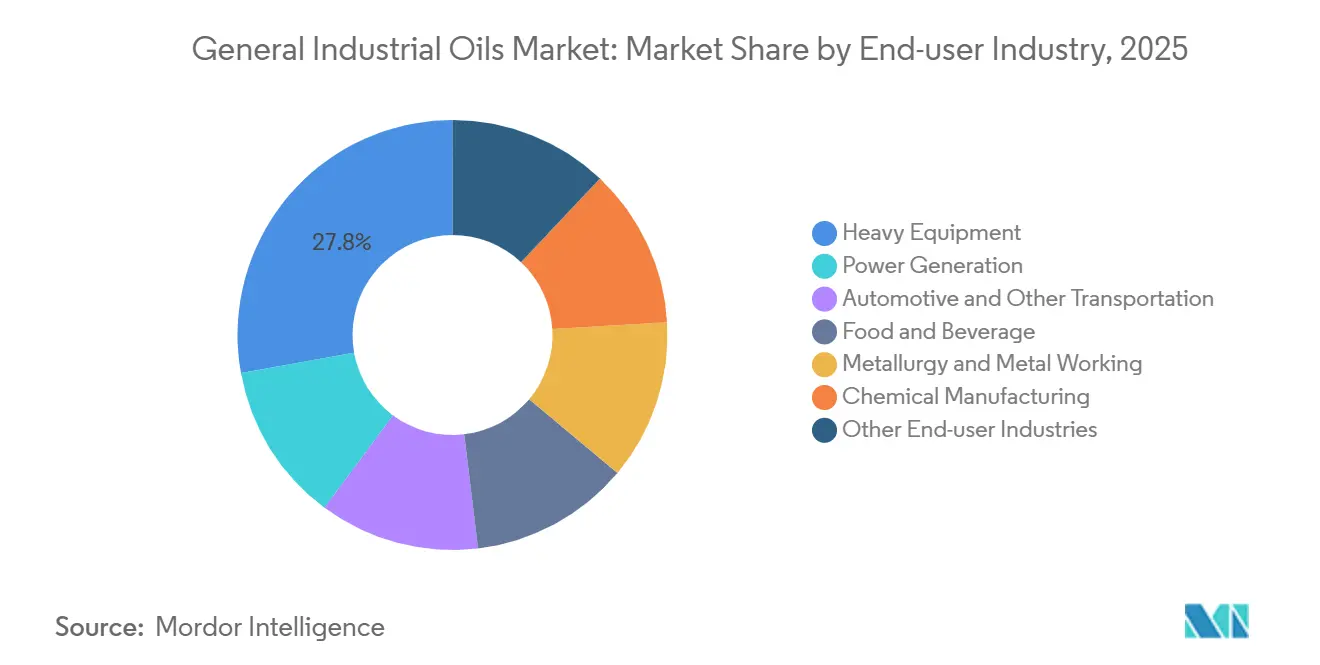
- Heavy equipment led end-user volume with 27.83% share in 2025; automotive manufacturing posts the quickest 2.84% CAGR as battery and motor production accelerate to 2031.
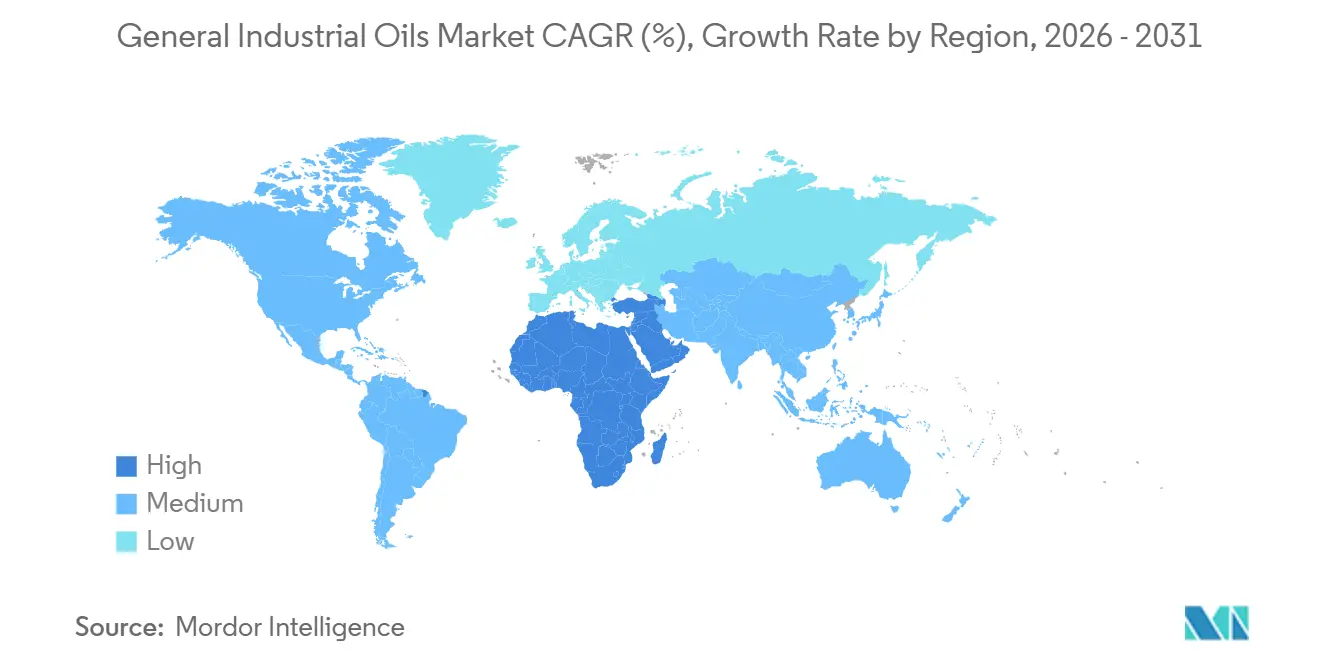
- Asia-Pacific commanded 46.12% of the General industrial oils market size in 2025, while the Middle East and Africa register the highest projected CAGR at 2.93% through 2031.
Note: Market size and forecast figures in this report are generated using Mordor Intelligence’s proprietary estimation framework, updated with the latest available data and insights as of January 2026.
Global General Industrial Oils Market Trends and Insights
Drivers Impact Analysis*
| Driver | (~) % Impact on CAGR Forecast | Geographic Relevance | Impact Timeline |
|---|---|---|---|
| Expansion of gas and steam turbine fleets | +0.6% | Middle East, South Asia, Southeast Asia | Medium term (2-4 years) |
| Surging refrigeration demand from cold-chain build-out | +0.5% | Global, concentrated in APAC and Latin America | Long term (≥ 4 years) |
| Growth of high-speed compressors in petrochem and LNG | +0.4% | Middle East, North America, APAC coastal hubs | Medium term (2-4 years) |
| OEM switch to condition-monitoring lubricants | +0.3% | Global, early in North America and Western Europe | Short term (≤ 2 years) |
| Data-center immersion-cooling oils | +0.2% | North America, Western Europe, select APAC metros | Short term (≤ 2 years) |
| Source: Mordor Intelligence | |||
Expansion of Gas and Steam Turbine Fleets in Emerging Markets
Saudi Aramco’s USD 1.2 billion order for 14 HA-class gas turbines at Jafurah in March 2025 underscores a wave of combined-cycle builds that each consume 4,500-5,000 liters of ISO VG 32 oil per unit[1]GE Vernova, “GE Gas Power Wins Jafurah Contract,” gevernova.com. India’s NTPC added 6.4 GW of capacity in fiscal 2025, lifting incremental turbine-oil demand by 22 million liters. Siemens Energy’s TLV 9013 04 varnish limit is forcing formulators toward Group III bases priced 50-70% above Group I oils. Southeast Asian gas-to-power projects totaling 18 GW for 2026-2028 commissioning signal a sustained pull on premium turbine oils. Hydrogen co-firing trials at Mitsubishi’s Takasago site reveal that only synthetic ester blends withstand nitration under 30% H₂ environments.
Surging Refrigeration Demand from Global Cold-Chain Build-Out
India earmarked USD 480 million in 2025 for cold-storage expansion, where polyolester oils now power 42% of new R-32 systems. China’s e-commerce fresh-food push lifted cold-chain logistics 14% in 2025, splitting lubricant demand between mineral R-22 oils inland and synthetic R-32 oils on the coast. Kigali timelines press markets to low-GWP refrigerants, yet R-32’s A2L flammability adds compliance costs that delay rollouts in price-sensitive regions. Natural-refrigerant migration is tangible, Coca-Cola HBC rolled out 8,500 CO₂ transcritical coolers (2025) that each require alkylbenzene or PAG fluids tuned for miscibility at subcritical pressures. Japan’s FamilyMart installed 1,200 CO₂ units in 2025, trimming oil charge per case by 40%.
Growth of High-Speed Compressors in Petrochem and LNG
QatarEnergy’s North Field East will run 24 centrifugal trains needing 6,000-7,500 liters of ISO VG 46 synthetic oil per compressor when first gas flows in 2026. ExxonMobil’s Golden Pass LNG startup in February 2025 added 18,000 liters of synthetic diester demand for six reciprocating units. Variable-speed drives cut power by 20-30% yet create electrical stress that only synthetic esters with dielectric strengths above 30 kV tolerate. Sinopec’s 45 MW turbo-compressor in Ningbo runs at 18,000 rpm, dictating a pour point below -50 °C met only by premium PAO blends. Dual-rated API 614/ISO 8068 fluids are emerging, letting blenders rationalize SKUs across turbines and compressors.
OEM-Driven Switch to Condition-Monitoring Lubricants
Caterpillar’s Cat Inspect sensor stretches hydraulic-oil change intervals from 2,000 to 3,500 hours, cutting downtime 18%. Siemens Energy’s Omnivise big-data suite predicts bearing failure 4-6 weeks ahead, trimming lubricant use 12-15%. Such analytics mandate additive constancy within ±5%, pushing formulators toward low-volatility synthetics. SKF’s Enlight AI manages 50,000 assets, slashing grease demand 30-40% while raising synthetic uptake. Despite lower volumes per asset, premium prices sustain revenue uplift in the General industrial oils market.
Restraints Impact Analysis*
| Restraint | (~) % Impact on CAGR Forecast | Geographic Relevance | Impact Timeline |
|---|---|---|---|
| Accelerating adoption of direct-drive electric motors | –0.4% | Global, fastest in Western Europe and North America | Medium term (2-4 years) |
| Volatility in Group I/II base-oil prices | –0.3% | Global, acute in Asia-Pacific and Europe | Short term (≤ 2 years) |
| Stricter PFAS limits shrinking additive choices | –0.2% | North America and EU, spillover to APAC | Long term (≥ 4 years) |
| Source: Mordor Intelligence | |||
Accelerating Adoption of Direct-Drive Electric Motors
ABB’s AMI series secured 29% of European compressor installs in 2025, slicing lubricant consumption 65-75% by eliminating gearboxes. Danfoss VLT systems paired with permanent-magnet motors reduced hydraulic-oil use 70% in 4,200 molding machines commissioned in 2025. Atlas Copco’s oil-free ZR VSD+ compressors reached 22% share in food applications, removing lubrication entirely. Bosch Rexroth calculates that electro-hydraulic actuators trimmed European hydraulic-fluid sales by 45 million liters in 2025. The General industrial oils market feels the volume pinch most acutely in gear and hydraulic categories.
Stricter PFAS Limits Shrinking Legacy Additive Choices
The EU capped PFAS at 25 ppb in January 2025, disqualifying 18 high-performance chemistries[2]European Chemicals Agency, “EU PFAS Restrictions,” echa.europa.eu. The US EPA’s 2024 CERCLA listing triggered nationwide reformulations to pre-empt liability, even below thresholds. OECD testing showed 32% of hydraulic and heat-transfer oils exceeded 100 ppb in 2024 samples. Castrol’s PFAS-free hydraulic fluid needed 15% extra ZDDP to match wear performance, adding USD 0.10 per liter in cost. California’s AB 2771, effective 2027, will ban PFAS outright, forcing national brands toward a single compliant formulation.
*Our forecasts treat driver/restraint impacts as directional, not additive. The impact forecasts reflect baseline growth, mix effects, and variable interactions.
Segment Analysis
By Product Type: Synthetic Blends Erode Mineral-Oil Volume Leadership
Hydraulic oil retained 51.77% of the General industrial oils market share in 2025, yet its modest 2.91% CAGR to 2031 hides a pivot to bio-based and synthetic variants that reduce fill volumes per asset while lifting revenue per liter. ISO VG 46 and VG 68 dominate mobile hydraulics, but Caterpillar’s biodegradable fluids cut per-excavator oil capacity to 380 liters while extending drains to 3,500 hours. Turbine and compressor oils converge around ASTM D7843 varnish targets below 5 ΔE, accelerating diffusion of Group III bases. Refrigeration oils mirror the refrigerant transition: polyolesters for R-32 and R-454B took 38% of 2025 HVAC installs in Europe and North America, whereas alkylbenzene oils serve CO₂ transcritical systems in Japan’s retail network.
Heat-transfer fluids remain niche, priced at USD 8-12 per liter versus USD 2-3 for mineral oils, yet uptake in concentrated solar and specialty reactors is steady. Electrical-insulating oils split between mineral fluids (72% share) and natural esters, the latter advancing 18% in 2025 on urban-substation safety codes. Compressor oils bifurcate into high-speed PAO blends for petrochem and diester variants for temperature extremes. Multi-functional SKUs such as Shell’s Omala S5 W, certified to ISO 6743-4 HM and DIN 51524-2, blur boundaries and widen addressable General industrial oils market demand.



By End-User Industry: Automotive Manufacturing Defies Electrification Narrative
Heavy equipment led volume at 27.83% in 2025, but extended service intervals and synthetic penetration cut viscosity-grade tonnage by 20-30% per unit. Conversely, automotive lines for battery packs and motors consume hydraulic and heat-transfer fluids 15-20% above legacy powertrain levels, powering a 2.84% CAGR to 2031. Tesla’s Berlin Gigafactory used 180,000 liters of hydraulic oil in 2025—25% higher than a same-size ICE plant—because structural battery stamping presses demand higher clamping force. Food and beverage processors migrated toward NSF H1 fluids, demonstrated by Cargill’s 85% conversion in US and EU plants. Power-generation, metallurgy, chemical, and mining segments each sustain base demand where extreme loads or contamination risk preclude thinner or water-based substitutes.
Geography Analysis
Asia-Pacific anchored 46.12% of the General industrial oils market in 2025, gaining from China’s Shenghong and Hengli base-oil builds that together added 330,000 t/a of Group II/III capacity. India’s refiners expanded blending capacity by 100,000 t/a between 2024 and 2025 to serve construction and mobility booms. Yet regional growth faces feedstock volatility and on-ramping PFAS laws, with Japan already favoring ISO 14001-aligned synthetic and bio fluids. Nearshoring benefits Vietnam and Thailand, where semiconductor fabs consume 8,000 t of ultra-pure lubricants annually.
North America is buoyed by LNG export expansion and reshoring incentives, but rapid uptake of direct-drive motors and federal PFAS scrutiny temper volumes. Golden Pass LNG alone adds 18,000 liters of synthetic compressor oil per year, yet US manufacturing facilities built under the Inflation Reduction Act often employ oil-free machinery. Europe endures the sharpest regulatory friction; REACH Annex XVII forced a wave of reformulations that added USD 0.10 per liter in raw-material cost. Germany’s hydraulics market saw 34% of units specify biodegradable fluids by 2025.
The Middle East and Africa post the quickest 2.93% CAGR for the General industrial oils market, catalyzed by Saudi Aramco’s Jafurah field and SABIC’s Jubail petrochemical build-out. South Africa’s mines adopt synthetics to lengthen drains amid load-shedding, while the UAE targets manufacturing diversification that lifts premium-oil uptake. South America remains volume-focused, led by Brazil’s farm-equipment fleet and Argentina’s shale play, whereas Russia continues to rely on domestic Group I/II supply amid limited import options.

Competitive Landscape
The General Industrial Oils market is moderately concentrated. Shell booked USD 14.2 billion in 2024 lubricants revenue by leveraging Tellus and Omala franchises. ExxonMobil dominates turbine oils with Mobil DTE 700, while TotalEnergies and BP accelerate bio-hydraulic portfolios. Strategic vectors coalesce around base-oil integration, regional expansion, and portfolio premiumization. Neste’s renewable base-oil offtake into Shell’s network illustrates resilience sourcing at a 10-15% cost premium.
General Industrial Oils Industry Leaders
Exxon Mobil Corporation
Castrol Limited
Chevron Corporation
BP p.l.c.
China Petrochemical Corporation
- *Disclaimer: Major Players sorted in no particular order


Recent Industry Developments
- July 2025: VEEDOL unveiled two new additions to its TERRASTAR series: the VEEDOL TERRASTAR 3268 and VEEDOL TERRASTAR 3268+. Both biodegradable hydraulic fluids received official confirmation from the EU Ecolabel, attesting to their adherence to top-tier technical and ecological standards.
- October 2024: RSC Bio Solutions unveiled FUTERRA Compressor Oils, designed to cater to the industrial and marine sectors' performance demands, all while prioritizing sustainability. The product is specifically crafted for rotary screw, reciprocating, and other high-performance air compressors.


Global General Industrial Oils Market Report Scope
General industrial oils, whether mineral or synthetic, serve as versatile lubricants for machinery. These oils, often enhanced with specific additives for anti-wear and thermal stability, cater to a range of applications including hydraulic systems, gears, spindles, and compressors. By reducing friction, wear, and rust, these lubricants not only ensure smooth operations but also extend the life of equipment.
The market is segmented based on product type, end-user industry, and geography. The market is segmented by product type into turbine oil, refrigeration oil, hydraulic oil, compressor oil, electrical oil, and heat-transfer oil. By end-user industry, the market is segmented into power generation, automotive and other transportation, heavy equipment, food and beverage, metallurgy and metal working, chemical manufacturing, and other end-user industries. The report also covers the size and forecasts for the general industrial oils market in 17 countries across the geography (Asia-Pacific, North America, Europe, South America, the Middle East and Africa). The market sizing and forecasts for each segment are based on volume (liters).
| Turbine Oil |
| Refrigeration Oil |
| Compressor Oil |
| Electrical Oil |
| Heat-Transfer Oil |
| Hydraulic Oil |
| Power Generation |
| Automotive and Other Transportation |
| Heavy Equipment |
| Food and Beverage |
| Metallurgy and Metal Working |
| Chemical Manufacturing |
| Other End-user Industries |
| Asia-Pacific | China |
| India | |
| Japan | |
| South Korea | |
| ASEAN Countries | |
| Rest of Asia-Pacific | |
| North America | United States |
| Canada | |
| Mexico | |
| Europe | Germany |
| United Kingdom | |
| France | |
| Italy | |
| Spain | |
| Russia | |
| NORDIC Countries | |
| Rest of Europe | |
| South America | Brazil |
| Argentina | |
| Rest of South America | |
| Middle-East and Africa | Saudi Arabia |
| South Africa | |
| Rest of Middle-East and Africa |
| By Product Type | Turbine Oil | |
| Refrigeration Oil | ||
| Compressor Oil | ||
| Electrical Oil | ||
| Heat-Transfer Oil | ||
| Hydraulic Oil | ||
| By End-user Industry | Power Generation | |
| Automotive and Other Transportation | ||
| Heavy Equipment | ||
| Food and Beverage | ||
| Metallurgy and Metal Working | ||
| Chemical Manufacturing | ||
| Other End-user Industries | ||
| By Geography | Asia-Pacific | China |
| India | ||
| Japan | ||
| South Korea | ||
| ASEAN Countries | ||
| Rest of Asia-Pacific | ||
| North America | United States | |
| Canada | ||
| Mexico | ||
| Europe | Germany | |
| United Kingdom | ||
| France | ||
| Italy | ||
| Spain | ||
| Russia | ||
| NORDIC Countries | ||
| Rest of Europe | ||
| South America | Brazil | |
| Argentina | ||
| Rest of South America | ||
| Middle-East and Africa | Saudi Arabia | |
| South Africa | ||
| Rest of Middle-East and Africa | ||


Key Questions Answered in the Report
What is the projected 2031 value of the General industrial oils market?
The General industrial oils market size is forecast to reach 21.76 billion liters by 2031.
Which product segment currently dominates global demand?
Hydraulic oil leads with 51.77% of the General industrial oils market share as of 2025.
Why is automotive manufacturing still a growth driver despite EV adoption?
Battery-pack and electric-motor assembly lines consume 15-20% more hydraulic and heat-transfer fluids per unit than conventional powertrain plants.
Which region is expected to post the fastest growth through 2031?
The Middle East and Africa region is projected to register the highest CAGR at 2.93%.
How are PFAS regulations affecting lubricant formulations?
EU and U.S. PFAS limits are eliminating 18 legacy additive chemistries, adding roughly USD 0.10 per liter in raw-material costs and accelerating reformulation cycles.
Page last updated on:






