Market Overview
| Study Period | 2021 - 2031 |
|---|---|
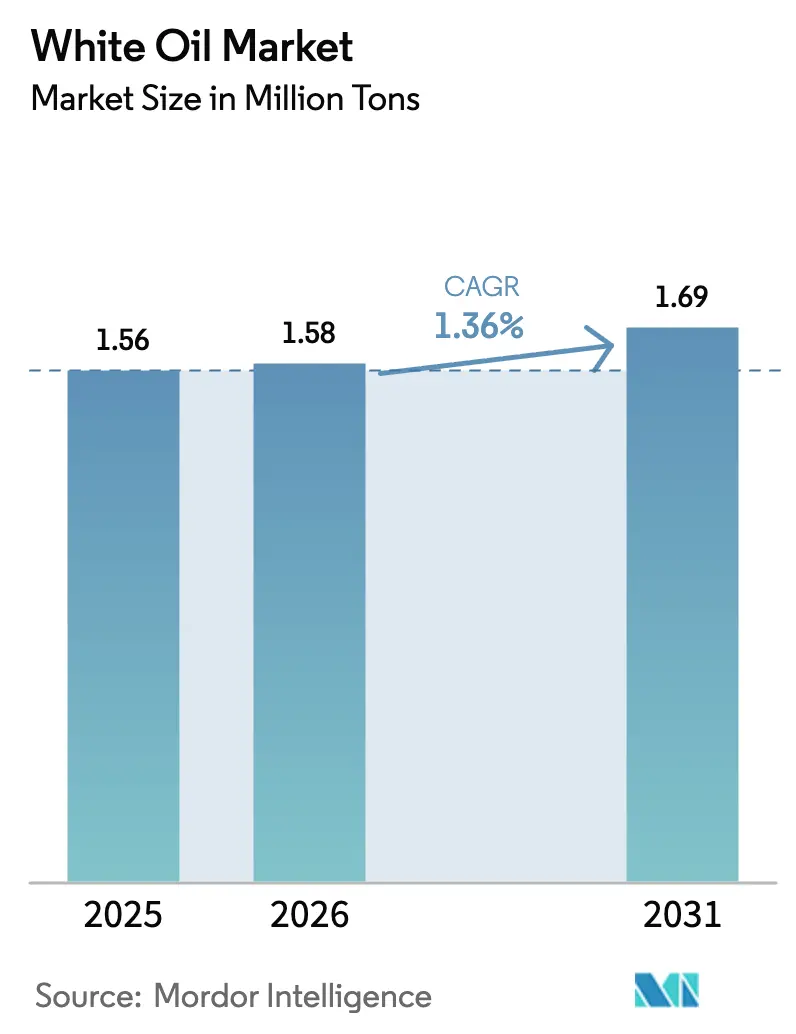
| Market Volume (2026) | 1.58 Million tons |
| Market Volume (2031) | 1.69 Million tons |
| Growth Rate (2026 - 2031) | 1.36% CAGR |
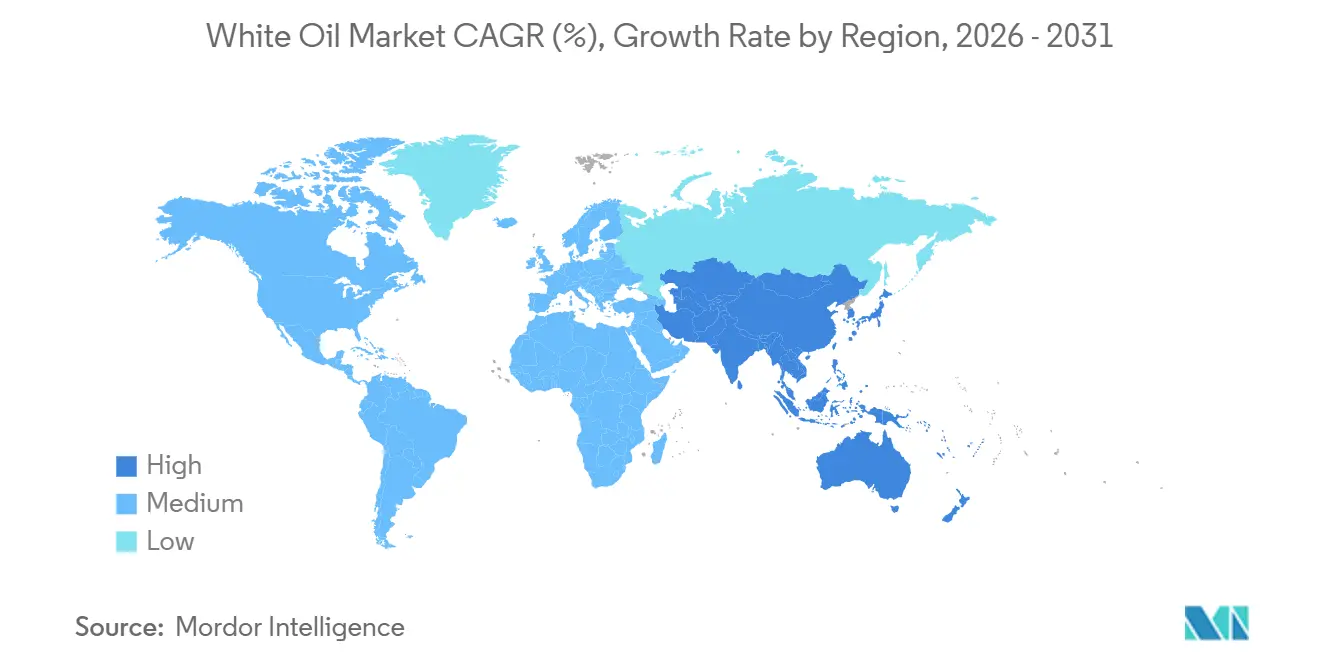
| Fastest Growing Market | Asia-Pacific |
| Largest Market | Asia-Pacific |
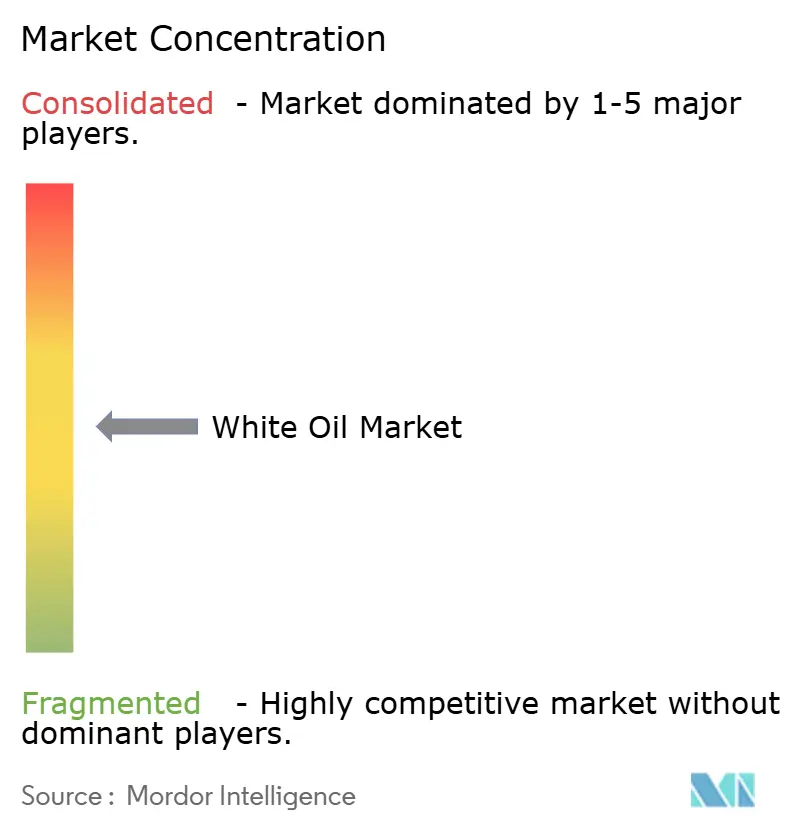
| Market Concentration | Medium |
Major Players *Disclaimer: Major Players sorted in no particular order Image © Mordor Intelligence. Reuse requires attribution under CC BY 4.0. | |
White Oil Market Analysis by Mordor Intelligence
The White Oil Market size is expected to grow from 1.56 Million tons in 2025 to 1.58 Million tons in 2026 and is forecast to reach 1.69 Million tons by 2031 at 1.36% CAGR over 2026-2031. Demand is tilting toward high-purity grades because hydrocracked Group II and III oils comply with U.S. and European pharmacopoeial limits on sulfur, nitrogen, and polycyclic aromatic hydrocarbons. Pharmaceutical manufacturers in Asia-Pacific are locking in multi-year supply agreements to secure USP-grade inputs, while flexible-packaging converters in Europe substitute recycled inks with food-grade white oils to meet MOAH and MOSH limits. Personal-care brands in India and the Middle-East continue to rely on light-paraffinic carriers that satisfy Ayurvedic and halal standards, reinforcing regional divergence in formulation strategy. Competitive dynamics favor integrated refiners that can swing paraffinic streams between fuels and specialties, yet niche blenders retain pricing power when they bundle viscosity customizations with batch certificates of analysis.
Key Report Takeaways
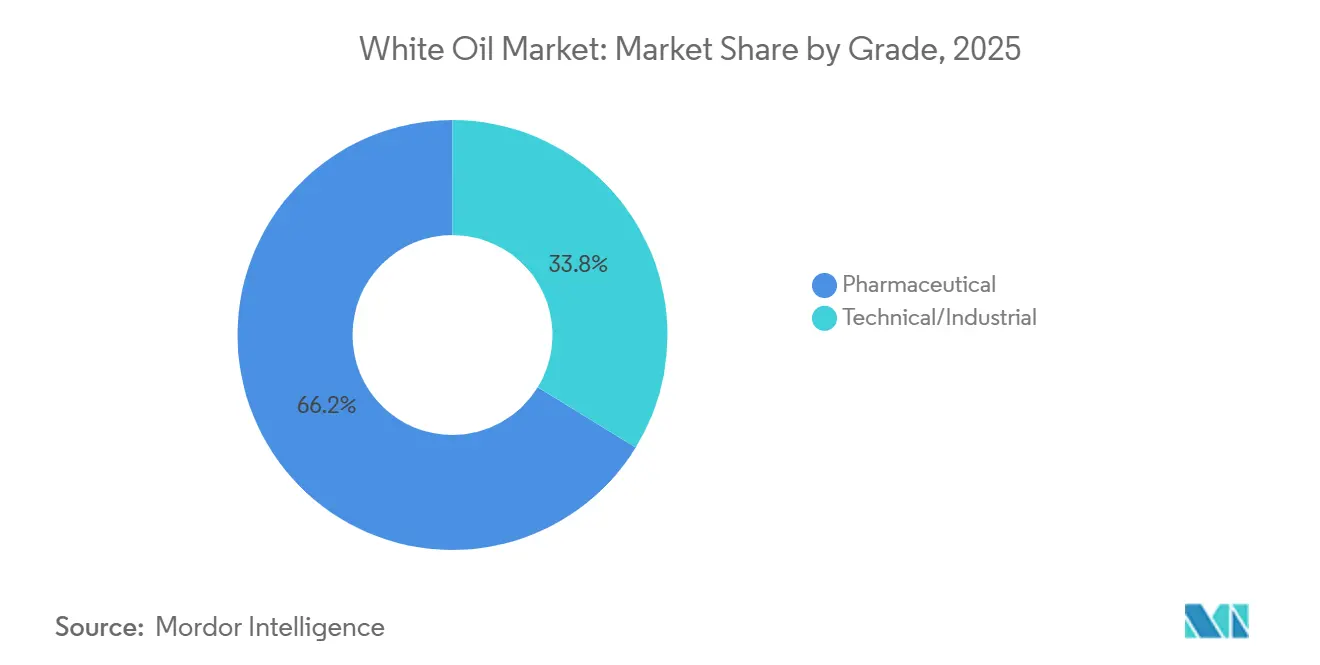
- By grade, pharmaceutical grade retained 66.23% of the white oil market share in 2025 and is advancing at a 1.32% CAGR to 2031.
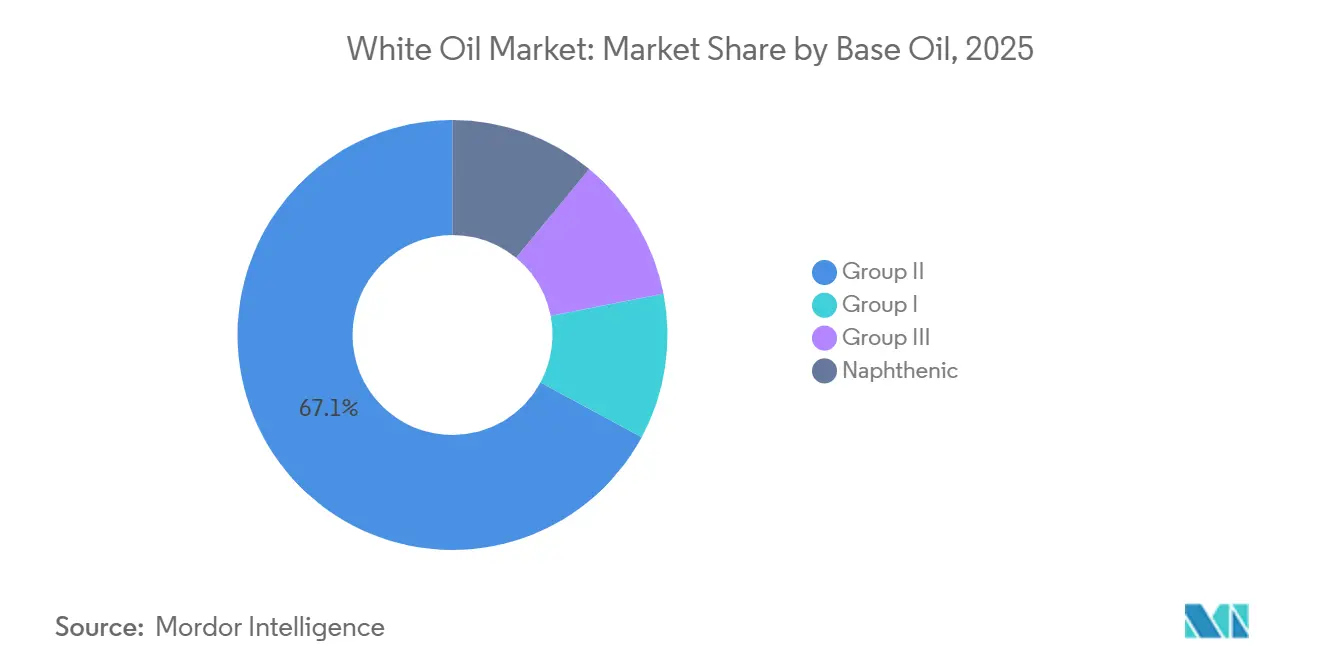
- By base oil, Group II accounted for 67.12% of the white oil market share in 2025 and is advancing at a 1.73% CAGR to 2031.
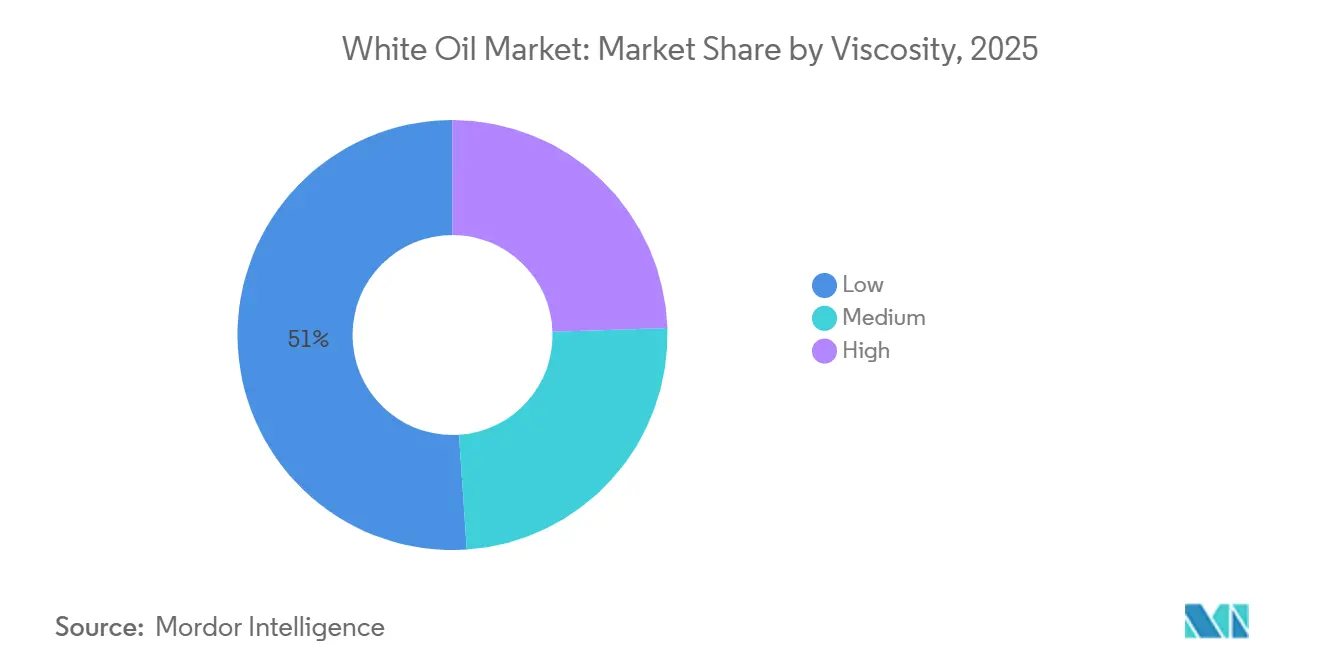
- By viscosity, low-viscosity held 51.08% of volume in 2025 and is advancing at a 1.41% CAGR to 2031.
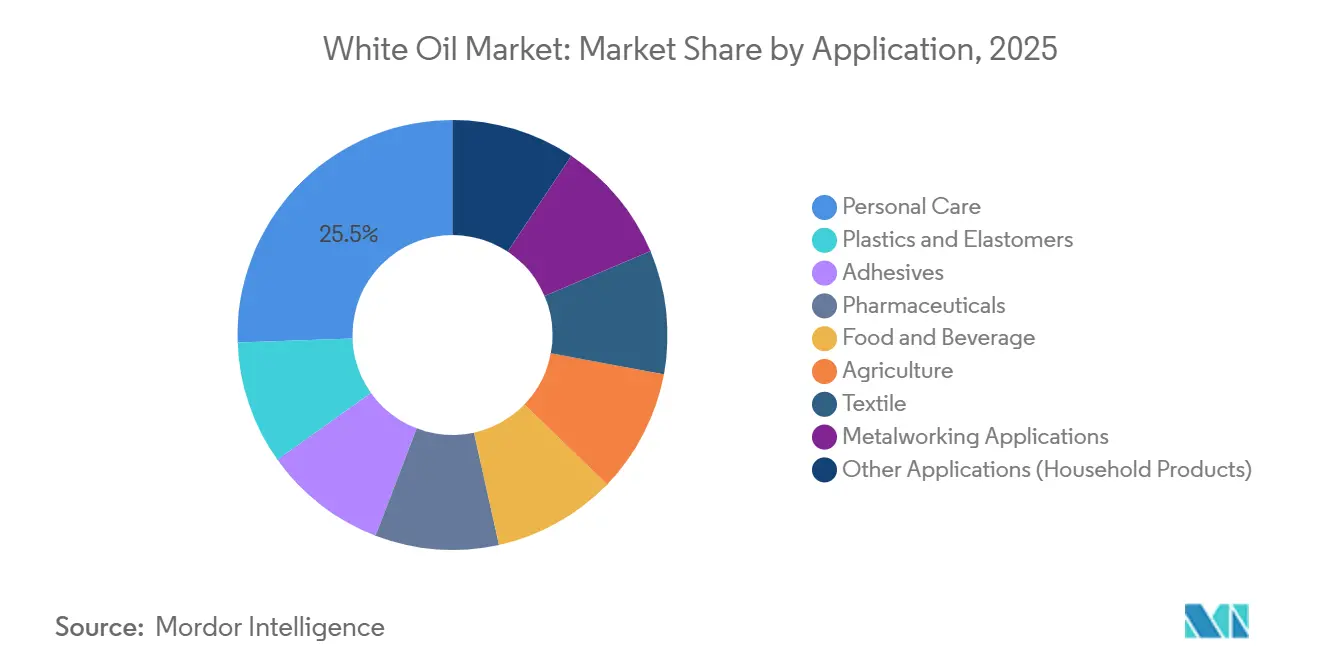
- By application, personal care accounted for 25.56% of the white oil market share in 2025 and is advancing at a 2.11% CAGR to 2031.
- By geography, Asia-Pacific captured 63.44% of global volume in 2025 and the region is advancing at a 1.35% CAGR to 2031.
Note: Market size and forecast figures in this report are generated using Mordor Intelligence’s proprietary estimation framework, updated with the latest available data and insights as of January 2026.
Global White Oil Market Trends and Insights
Drivers Impact Analysis*
| Driver | (~) % Impact on CAGR Forecast | Geographic Relevance | Impact Timeline |
|---|---|---|---|
| Surge in Asia-Pacific Biologics Fill-Finish Lines Demanding USP-Grade White Oils | +0.3% | Asia-Pacific core, spillover to North America | Medium term (2-4 years) |
| Europe MOAH/MOSH Limits Accelerating Shift to Food-Grade White Oils in Packaging | +0.2% | Europe, with adoption in North America | Short term (≤ 2 years) |
| Indian Ayurvedic-Cosmetics Boom Fuelling Light-Paraffinic White-Oil Usage | +0.2% | India, with export gains in Middle-East and Southeast Asia | Medium term (2-4 years) |
| Expansion in Polymer and Plastic Processing in Emerging Economies | +0.2% | Asia-Pacific, Middle-East, Latin America | Long term (≥ 4 years) |
| GCC Pharma Capacity Build-Out Boosting Imports of High-Purity Grades | +0.1% | Saudi Arabia, UAE, with regional distribution to North Africa | Medium term (2-4 years) |
| Source: Mordor Intelligence | |||
Surge in Asia-Pacific Biologics Fill-Finish Lines Demanding USP-Grade White Oils
Biologics capacity additions in China and India exceeded 50 new fill-finish sites between 2024 and 2025. Each line specifies white oils with endotoxin below 0.25 EU/mL and PAH below 3%, criteria that exclude legacy Group I streams while favoring hydrocracked outputs. Contract manufacturers serving Western biosimilar demand impose FDA-aligned documentation, so suppliers providing real-time batch analytics win long-term contracts. The trend lifts volumes of premium low-viscosity grades and compresses margins for commodity blenders that lack pharmaceutical validation.
Europe MOAH/MOSH Limits Accelerating Shift to Food-Grade White Oils in Packaging
Converters of flexible packaging are adopting hydrogenated white oils certified under FDA 21 CFR 178.3620(a) after EFSA confirmed MOAH migration above 2 mg/kg in dry foods. Brand owners pay EUR 200-300 per ton premiums for certified lots, yet smaller suppliers struggle to absorb third-party testing costs. Rapid compliance cycles mean specialty refiners with in-house GC-FID capability secure volume gains.
Indian Ayurvedic-Cosmetics Boom Fuelling Light-Paraffinic White-Oil Usage
India’s Ayurvedic personal-care value surged 12% year-over-year in 2025. White oils compliant with Bureau of Indian Standards IS 1083 act as stable, odorless carriers for herbal actives and satisfy halal traceability for exports to Gulf retailers[1]Bureau of Indian Standards, “IS 1083: Light Liquid Paraffin,” bis.gov.in. Domestic producers expanded capacity at double-digit rates, creating a regional hub that offsets European volume softness.
Expansion in Polymer and Plastic Processing in Emerging Economies
PVC and PP compounders in Southeast Asia and the Middle-East employ technical-grade white oils as internal lubricants that cut melt viscosity and reduce die buildup. Vietnam’s plastics output advanced 9% in 2025, absorbing additional medium-viscosity supply. Saudi Arabia’s TA’ZIZ hub imported white oils for its USD 5 billion PVC complex because local refineries prioritize fuels. Sustained infrastructure investment suggests long-run support despite potential circular-economy pivots.
Restraints Impact Analysis*
| Restraint | (~) % Impact on CAGR Forecast | Geographic Relevance | Impact Timeline |
|---|---|---|---|
| EU Micro-Plastic Directive Curbing Mineral-Oil-Based Cosmetic Formulations | -0.2% | Europe, with spillover to North America and Australia | Short term (≤ 2 years) |
| North American Infant-Food Players Pivoting to Bio-Based Esters | -0.1% | United States, Canada | Medium term (2-4 years) |
| IMO-2020 Sulfur Caps Tightening High-Quality Feedstock Supply | -0.1% | Global, most acute in Asia-Pacific refining hubs | Short term (≤ 2 years) |
| Source: Mordor Intelligence | |||
EU Micro-Plastic Directive Curbing Mineral-Oil-Based Cosmetic Formulations
Regulation 2023/2055 restricts synthetic polymer microparticles in rinse-off cosmetics, prompting European brands to substitute mineral-oil carriers with plant-derived esters to avoid petrochemical labeling[2]European Commission, “Regulation 2023/2055,” eur-lex.europa.eu . Although mineral oils are not microplastics, consumer perception drove a 3-4% decline in regional personal-care demand during 2025. Reformulation cycles average 18-24 months, so most substitution will conclude by 2027.
North American Infant-Food Players Pivoting to Bio-Based Esters
Nestlé and Abbott eliminated mineral oils from spray-drying and emulsifier systems in 2024 after focus-group data showed 68% parental distrust of “mineral oil” descriptors. Falling bio-ester prices narrowed cost gaps to USD 100-150 per ton, making switchovers economically neutral. The restraint is localized yet signals sensitivity to non-scientific consumer sentiment in high-visibility applications.
*Our forecasts treat driver/restraint impacts as directional, not additive. The impact forecasts reflect baseline growth, mix effects, and variable interactions.
Segment Analysis
By Grade: Pharmaceutical Dominance Anchored by Regulatory Barriers
Pharmaceutical grade held 66.23% of 2025 volume, underlining entrenched regulatory moats that discourage new entrants. The segment grows at a 1.32% CAGR, reflecting mature demand rooted in chronic-care and dermatology formulations. Batch-to-batch viscosity must remain within ±0.5 cSt, and heavy metals stay below 1 ppm, requirements that raise compliance costs. Technical-grade volumes rise faster in plastics and adhesives where cost trumps purity, but lack of pharmacopoeial coverage limits their conversion into higher-margin channels.
Second-order effects concentrate on the procurement side. Leading pharmaceutical firms now demand blockchain-enabled traceability that tracks drum numbers to refinery runs, reducing supply flexibility for smaller blenders. Meanwhile, industrial users tolerate wider viscosity bands, enabling discount suppliers to survive on price plays. The segmentation thus preserves a two-tier structure that insulates incumbents yet caps growth potential. The white oil industry maintains this divide by reinvesting in analytical labs rather than new distillation hardware.


By Base-Oil: Group II Hydrocracking Gains Share on Purity Mandates
Group II captured 67.12% of volume in 2025 and is progressing at a 1.73% CAGR, fuelled by sulfur-free outputs that align with European food-contact directives. In 2025, Group III remained a niche premium option with higher oxidative stability premiums. Group I volumes erode in pharmaceutical and food uses but continue in adhesives where cost pressures dominate.
Integrated refiners use swing units to toggle between fuels and specialty outputs. When marine-fuel margins spiked after IMO 2020, paraffinic feedstocks diverted away from white oils, lifting spot prices by 6-8%. Despite this volatility, Group II capacity additions on the U.S. Gulf Coast and in China reaffirm long-term supply security. Group III opportunities lie in injectable-drug devices and high-temperature metalworking fluids, yet price elasticity tempers adoption. The white oil market continues to migrate toward hydrocracked purity, an irreversible shift for regulated sectors.

By Viscosity: Low-Viscosity Grades Propelled by Pharmaceutical and Cosmetic Uptake
Low-viscosity contributed 51.08% of 2025 throughput and enjoys a 1.41% growth trajectory. This cut underpins ophthalmic preparations, baby oils, and biologics fill-finish lubricants where droplet size and spreadability matter. Medium grades hold share in extrusion and molding, balancing fluidity with film strength, while high-viscosity products fill niche lubrication roles. Producing narrow 8-10 cSt cuts needs deeper hydrocracking and tight distillation, adding USD 80-120 per ton to production costs, yet premiums in pharmaceutical tenders offset the expense.
Pressure on medium grades stems from synthetic polyalphaolefins in metalworking that offer longer drain intervals. High-viscosity oils confront bio-grease substitution in environmentally sensitive jobs. Suppliers that master vacuum distillation and real-time viscosity control sustain competitive advantage as variability tolerances tighten. In absolute terms, low-viscosity lines will anchor volume growth for the white oil market through 2031.
By Application: Personal Care Leads Growth Despite Clean-Beauty Headwinds
Personal care consumed 25.56% of 2025 volume and is forecast to advance at a 2.11% CAGR, the quickest among applications. Ayurvedic hair oils, halal moisturizers, and mass-market baby products adopt light-paraffinic carriers thanks to odorless profiles and resistance to rancidity. Plastics and elastomers follow, yet circular-economy policies in Europe temper momentum. Adhesives, food, and beverage absorb steady volumes due to MOAH/MOSH compliance upgrades.
Pharmaceutical demand, although slower growing, remains larger in absolute tonnage. Agricultural, textile, and household uses shrink or stagnate depending on regional adoption of water-based substitutes. Personal-care resilience could waver if EU microplastic sentiment spreads to Asia-Pacific or if bio-ester costs fall further. For now, the white oil market finds its highest incremental gains in beauty and hygiene segments that blend cultural preferences with regulatory permissibility.
Geography Analysis
Asia-Pacific anchored 63.44% of volume in 2025, yet its 1.35% forecast CAGR lags personal-care growth, showing that bulk polymer processing is plateauing. China contributes major consumption through pharmaceutical clusters in Jiangsu and plastics bases in Guangdong, but stricter refinery emission targets limit incremental capacity. India emerges as the fastest-growing node, benefiting from Ayurvedic cosmetics, domestic drug production, and polymer expansions in Gujarat. Southeast Asian economies, notably Vietnam and Thailand, upscale white-oil imports for flexible packaging and food handling, though freight volatility introduces procurement risk.
In North America, U.S. pharmaceutical excipient standards shield demand for USP-grade lots, yet bio-based substitutions in infant food and microplastic-driven cosmetic reformulations curtail upside. Canada’s reliance on imports sustains steady buying but lacks internal refining upgrades. Mexico’s growth hinges on technical-grade needs from rising auto parts and packaging output. Regulatory complexity lengthens product-qualification cycles, favoring incumbents.
Europe’s demand is shaped by food-contact reforms and antiplastics sentiment. Germany leads adoption of premium food-grade oils in packaging, offsetting weaker personal-care call-offs. United Kingdom and France mirror this pattern, while Nordic countries progress faster toward bio-alternatives. Southern Europe sustains mineral-oil legacy formulas in cosmetics and processed foods but faces harmonization by 2028. The Middle-East and Africa combined account for a smaller share, driven by GCC pharmaceutical ambitions and South African industrial lubricants, yet political risk and infrastructure gaps temper immediate growth. Collectively, regional dynamics underscore that the white oil market growth story rests on regulated purity upgrades rather than sheer volume expansion.

Competitive Landscape
Integrated refiners control about 45-50% of global capacity, supplying hydrocracked Group II streams at cost positions smaller blenders cannot match. ExxonMobil, Shell, Chevron, TotalEnergies, Sinopec, and PetroChina toggle output between low-sulfur fuels and specialty base oils, tightening or loosening supply as margins dictate. When marine-fuel margins widened after IMO 2020, specialty allocations shrank, driving an 8% price spike that advantaged players with captive feedstock.
Niche suppliers such as H&R Group, Nynas, Sonneborn, and Sasol compete on pharmaceutical certifications, custom viscosity cuts, and technical support. H&R’s 2025 hydrogenation upgrade in Hamburg added 25,000 tons of pharmaceutical capacity, enabling rapid responses to biologics contract bids. Indian producers—Savita, Gandhar, Apar—leverage cost advantages and ISO certification to penetrate price-sensitive Asia-Pacific and Gulf uses, though they struggle in FDA-regulated channels.
Technology is emerging as the next battleground. Suppliers investing in inline viscosity analytics, blockchain traceability, and real-time MOAH screening can charge premiums in food and pharma tenders. Conversely, regional blenders lacking hydrocracking assets and analytical labs confront margin compression as Group I demand wanes. Three Southeast Asian producers exited in 2025 as feedstock economics turned unfavorable. The white oil market therefore balances scale economics of integrated majors with specialization advantages of certified niche operators.
White Oil Industry Leaders
Exxon Mobil Corporation
Shell plc
China Petroleum & Chemical Corporation
Chevron Corporation
Sasol
- *Disclaimer: Major Players sorted in no particular order

Recent Industry Developments
- May 2025: Gazpromneft - Lubricants Ltd. commenced white oil production at its Omsk refinery in Russia. This development aligned with Russia's objective of import substitution by converting raw materials into advanced lubricants and base oils through hydroprocessing and purification technologies.
- January 2024: Chevron Lummus Global (CLG) commissioned the world's largest white oil hydroprocessing unit for Hongrun Petrochemical in Weifang, China. The facility included a 200,000 tonnes/year food-grade white oil production line, along with a larger Group III base oil unit.


Research Methodology Framework and Report Scope
Market Definitions and Key Coverage
Our study defines the white oil market as freshly produced, highly refined paraffinic or naphthenic mineral oils that are colorless, tasteless, odorless, and hydrophobic, delivered in either pharmaceutical or technical purity for use across personal care, pharmaceutical, polymer, adhesive, food-processing, textile, agricultural, and metalworking applications. We quantify only primary sales in volume terms.
Scope exclusion: In line with our scope, we exclude silicone-based or synthetic ester white lubricants and finished consumer blends containing white oil.
Segmentation Overview
- By Grade
- Pharmaceutical
- Technical/Industrial
- By Base-Oil
- Group II
- Group I
- Group III
- Naphthenic
- By Viscosity
- Low
- Medium
- High
- By Application
- Personal Care
- Plastics and Elastomers
- Adhesives
- Pharmaceuticals
- Food and Beverage
- Agriculture
- Textile
- Metalworking Applications
- Other Applications (Household Products)
- By Geography
- Asia-Pacific
- China
- India
- Japan
- South Korea
- ASEAN Countries
- Rest of Asia-Pacific
- North America
- United States
- Canada
- Mexico
- Europe
- Germany
- United Kingdom
- Italy
- France
- NORDIC Countries
- Rest of Europe
- South America
- Brazil
- Argentina
- Rest of South America
- Middle-East and Africa
- Saudi Arabia
- South Africa
- Rest of Middle-East and Africa
- Asia-Pacific
Detailed Research Methodology and Data Validation
Primary Research
We spoke with refinery process engineers, specialty-oil distributors, cosmetics formulators, and pharmaceutical excipient buyers in Asia-Pacific, North America, and Europe. Conversations on contract grades, viscosity shifts, and demand outlooks filled information gaps and confirmed secondary findings before modeling.
Desk Research
We began with public datasets from the US Energy Information Administration, Eurostat PRODCOM, UN Comtrade HS codes 27101985/87, and purity standards from the USP and European Pharmacopoeia, which frame what qualifies as marketable white oil. Our team next reviewed customs notifications, refinery throughput tables, and sector reports from bodies such as the American Fuel & Petrochemical Manufacturers and the Indian Chemical Council.
We validated trade flows by pairing those statistics with price and capacity intelligence drawn from D&B Hoovers, Dow Jones Factiva, and Asia Metal. These references illustrate the range of open sources consulted, and many additional databases and technical journals further supported cross-checks.
Market-Sizing & Forecasting
A top-down reconstruction of regional base-oil production and net trade balances was built, then tested through selective bottom-up checks of supplier shipment samples and typical ex-refinery average selling prices. Key variables include Group II base-oil output, plasticizer demand in polymer extrusion, registered pharmaceutical excipient volumes, cosmetics production indices, and industrial white-oil penetration rates. Forecasts to 2030 employ ARIMA time-series fitted to these drivers and refined by scenario inputs from interviewed experts.
Data Validation & Update Cycle
Mordor analysts compare modeled volumes with refinery utilization, import invoices, and quarterly earnings disclosures. Variances trigger reruns and senior review. Reports refresh each year, with mid-cycle updates for material events, and every delivery undergoes a fresh consistency check.
Why Mordor's White Oil Baseline Commands Informed Decision-Maker Confidence
Published estimates often diverge because firms adopt different purity thresholds, measurement units, and update cadences. Our disciplined scope selection, dual-step validation, and yearly refresh narrow these gaps and anchor decisions on transparent evidence.
Key gap drivers include other publishers valuing revenues instead of tonnage, rolling synthetic lubricants into scope, or assuming aggressive annual price inflation that our conservative ARIMA path tempers.
Benchmark comparison
| Market Size | Anonymized source | Primary gap driver |
|---|---|---|
| 1.51 million tons (2025) | Mordor Intelligence | |
| USD 2.25 billion (2025) | Global Consultancy A | Values revenue, omits technical grade so price base is higher |
| USD 3.48 billion (2025) | Industry Journal B | Merges synthetic white lubricants and builds forecasts on 6% annual ASP escalation |
These contrasts show that Mordor's transparent variables and cross-checks produce a balanced, reproducible baseline that clients can trace to public statistics and real-world insight.


Key Questions Answered in the Report
How large is the white oil market?
The white oil market size is 1.58 million tons in 2026 and is forecast to reach 1.69 million tons by 2031 with a projected 1.36% CAGR to 2031.
Which application is expanding fastest?
Personal care leads growth at a 2.11% forecast CAGR as Ayurvedic and halal brands step up purchases of light-paraffinic grades.
Why are Group II base oils gaining share?
Hydrocracking removes sulfur and aromatics to meet stricter European and North American purity limits, pushing Group II to 67.12% share in 2025.
Which region dominate demand?
Asia-Pacific accounts for 63.44% of global volume in 2025, driven by pharmaceutical and plastics manufacturing clusters.
Page last updated on:


