Quick-Service Restaurant Market Size and Share
Market Overview
| Study Period | 2021 - 2031 |
|---|---|
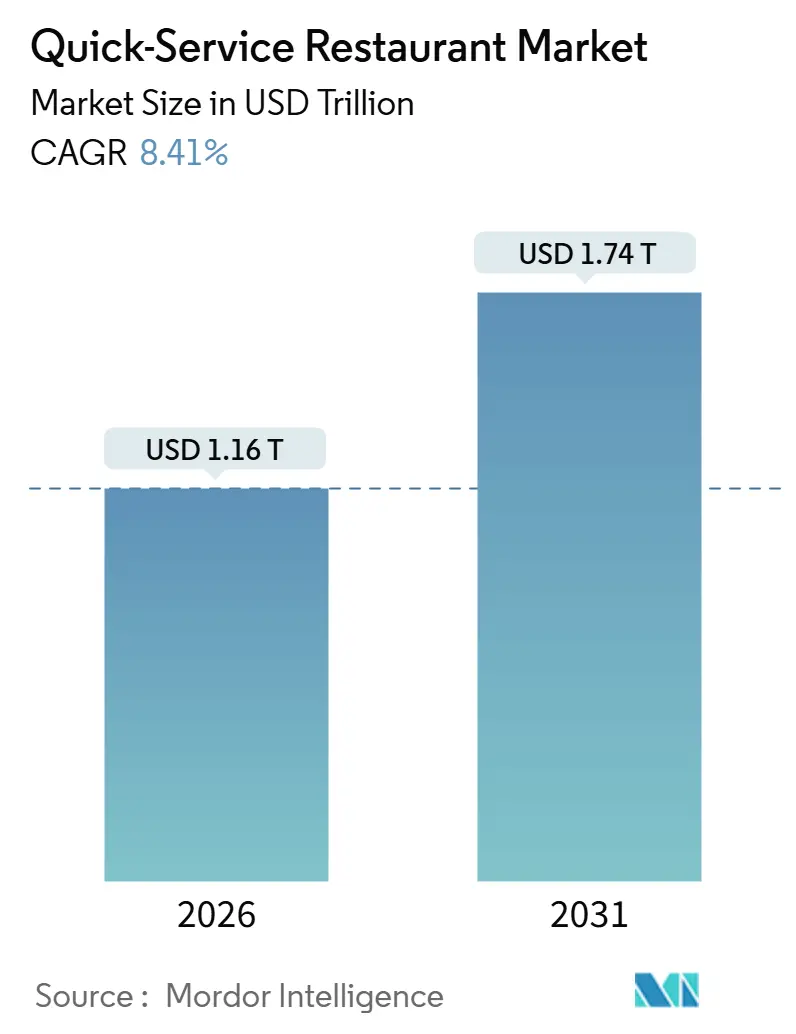
| Market Size (2026) | USD 1.16 Trillion |
| Market Size (2031) | USD 1.74 Trillion |
| Growth Rate (2026 - 2031) | 8.41% CAGR |
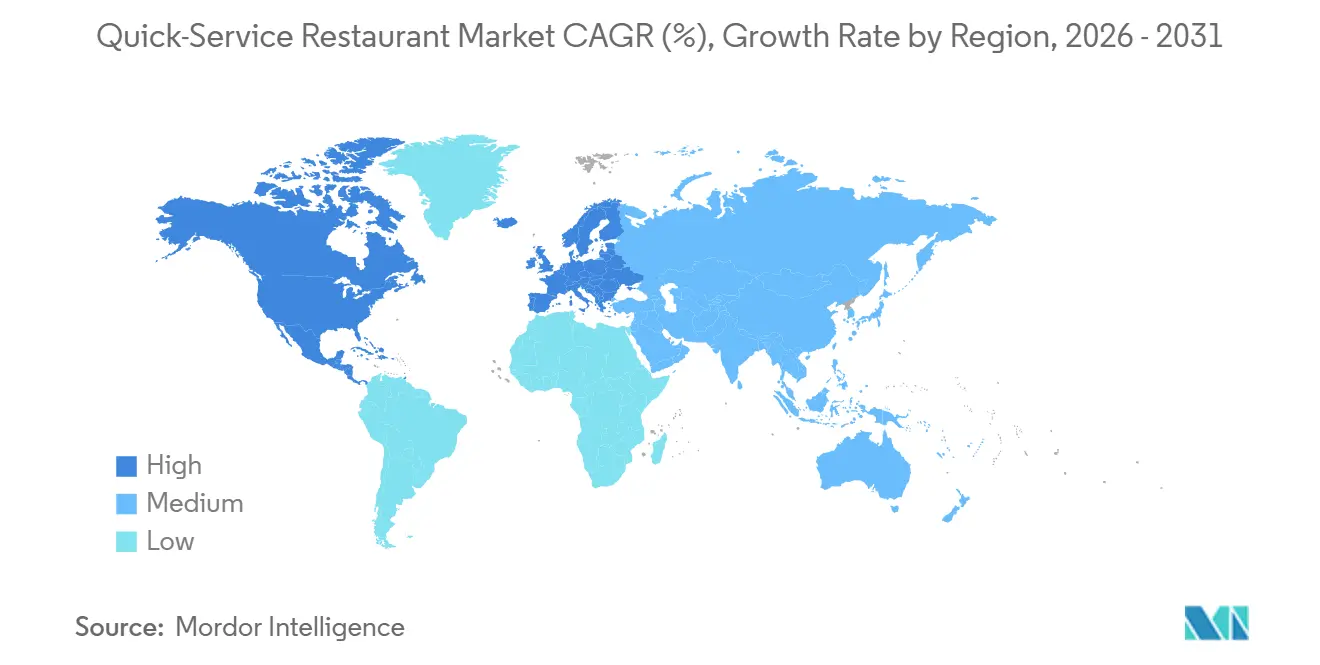
| Fastest Growing Market | Asia Pacific |
| Largest Market | North America |
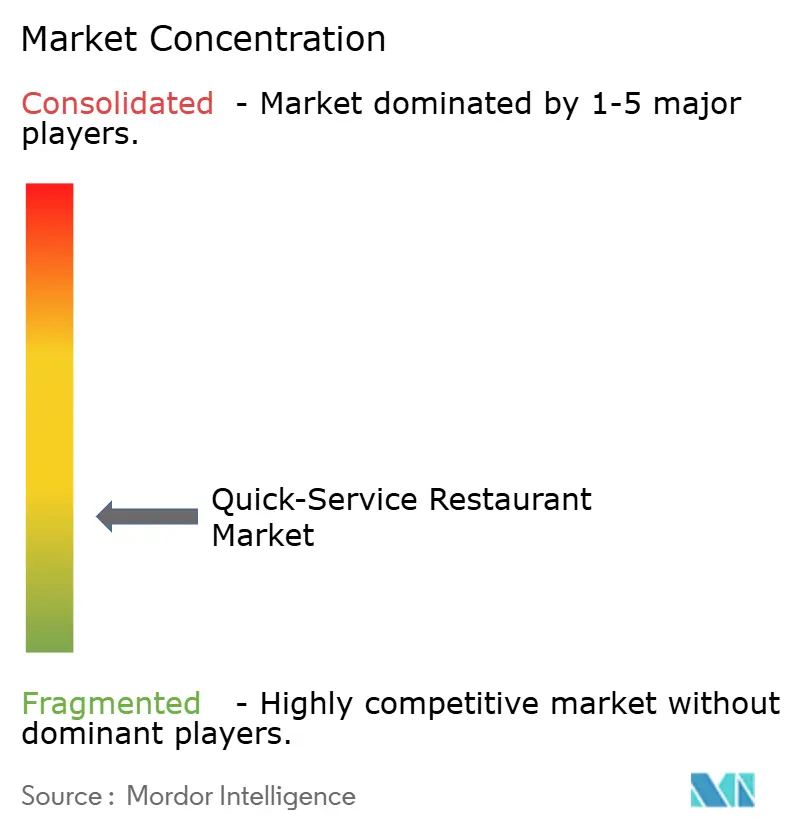
| Market Concentration | Low |
Major Players
*Disclaimer: Major Players sorted in no particular order Image © Mordor Intelligence. Reuse requires attribution under CC BY 4.0. |
|
Quick-Service Restaurant Market Analysis by Mordor Intelligence
The quick-service restaurants market size reached USD 1.16 trillion in 2026 and is projected to increase to USD 1.74 trillion by 2031, reflecting an 8.41% CAGR over the forecast period. Digital ordering now drives more than 40% of chain transactions, and off-premise formats (drive-thru, delivery, and takeaway) already account for over 70% of revenue at leading brands. Operators are converting large dining rooms into compact fulfillment hubs, layering voice AI, dual-lane drive-thrus, and curbside bays onto existing real estate to increase revenue per square foot. Demand is also shifting toward subscription-style loyalty programs that lower marketing expenses while increasing visit frequency; Starbucks alone recorded 34 million active members in 2025, accounting for 57% of its sales. Meanwhile, wage pressure in high-income regions is accelerating investment in kiosks, robotic fryers, and autonomous kitchen lines that deliver sub-18-month payback periods.
Key Report takeaways
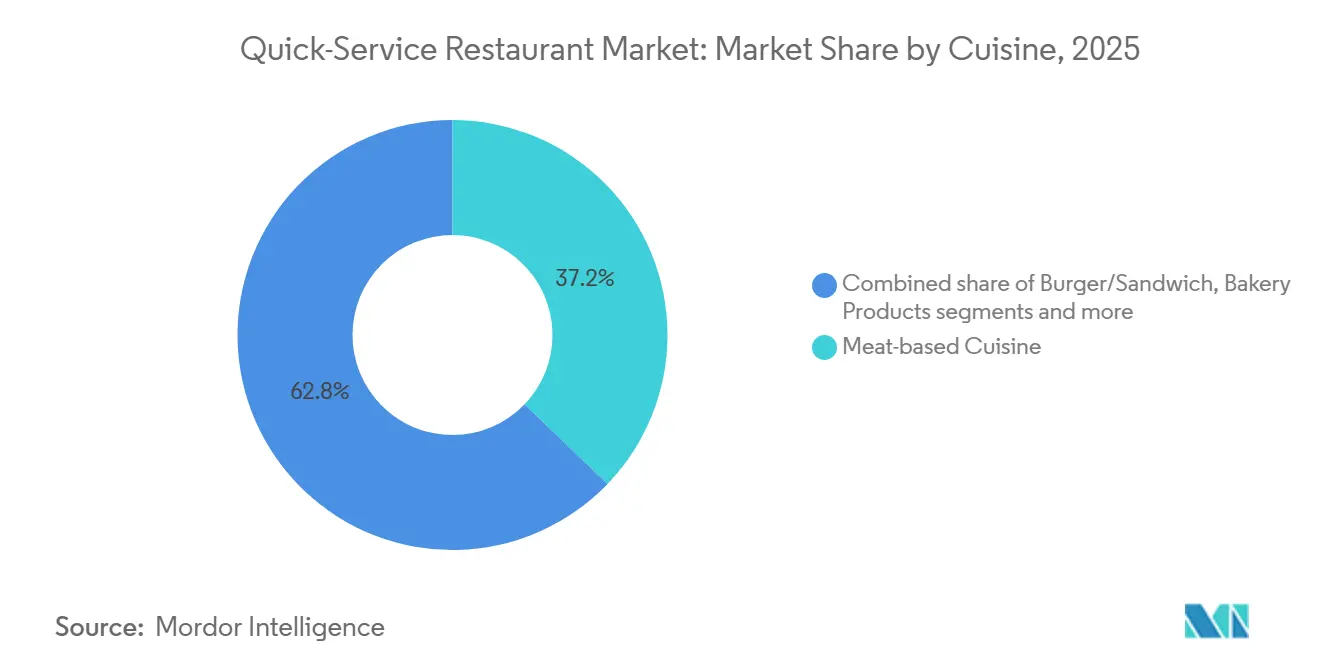
- By cuisine, meat-based concepts held 37.18% of the quick-service restaurants market share in 2025, while pizza-and-pasta formats are projected to expand at a 10.26% CAGR through 2031.
- By structure, chained/franchised outlets captured 52.34% of 2025 revenue, whereas independent operators are poised for the fastest 9.27% CAGR to 2031.
- By service model, dine-in service generated 29.42% of 2025 sales, yet home delivery is forecast to sprint ahead at a 10.57% CAGR through 2031.
- By geography, North America led with 32.69% of the 2025 revenue, while the Asia-Pacific region is set to advance at a 10.49% CAGR through 2031.
Note: Market size and forecast figures in this report are generated using Mordor Intelligence’s proprietary estimation framework, updated with the latest available data and insights as of January 2026.
Global Quick-Service Restaurant Market Trends and Insights
Drivers Impact Analysis
| Driver | (~) % Impact on CAGR Forecast | Geographic Relevance | Impact Timeline |
|---|---|---|---|
| Expansion of drive-thru and off-premise channels | +1.8% | Global, with strongest impact in North America and Europe | Medium term (2-4 years) |
| Rapid urbanisation and busy lifestyle accelerating quick-service restaurants | +2.1% | Asia-Pacific core, spill-over to South America and Middle East and Africa | Long term (≥ 4 years) |
| Digital loyalty and subscription programs boosting repeat visits | +1.2% | North America and Europe, expanding to Asia-Pacific | Short term (≤ 2 years) |
| Expansion of delivery and digital ordering | +1.9% | Global, with early gains in urban centers | Medium term (2-4 years) |
| Tech integration and automation | +1.1% | North America and Europe, gradual Asia-Pacific adoption | Medium term (2-4 years) |
| Rising tourism and out-of-home dining | +0.7% | Global, concentrated in tourism hubs | Short term (≤ 2 years) |
| Source: Mordor Intelligence | |||
Expansion of drive-thru and off-premise channels
Drive-thru lanes and off-premise formats are transforming store economics by enabling operators to increase revenue per square foot without expanding dining areas. In 2025, McDonald's reported that 70% of its U.S. sales came from drive-thru and delivery channels. New locations dedicated just 25% of their floor space to seating while investing in dual-lane drive-thrus equipped with AI-powered voice ordering, which cut transaction times to under 90 seconds. Chains in Australia and the Middle East are retrofitting existing sites with walk-up windows and dedicated curbside pickup bays, achieving an 18% increase in throughput in pilot markets during 2025. This shift also eases labor pressures, as off-premise orders require fewer front-of-house staff and allow kitchens to batch production during peak periods. Regulatory requirements in the U.S. and Canada add USD 50,000-100,000 per site to ensure Americans with Disabilities Act (ADA)-compliant drive-thru accessibility, balancing upfront costs with legal compliance and operational efficiency, according to the U.S. Department of Justice.
Rapid urbanization and busy lifestyle accelerating quick-service restaurants
Rapid urbanization and increasingly busy lifestyles are driving the growth of quick-service restaurants (QSRs) globally. As urban populations grow and consumer routines become more fast-paced, demand for quick, convenient dining options has surged, creating significant opportunities for QSR chains to expand their footprints. As of 2024, McDonald's operates a total of 43,477 outlets worldwide [1]Source: McDonald's Corporation, "Annual Report 2024," mcdonalds.com, showcasing its extensive global reach and dominance in the fast-food market. The brand continues to expand its presence, catering to diverse consumer preferences across various regions. Similarly, KFC, with 31,981 stores globally as of 2024, has established itself as a significant player in the fast-food industry [2]Source: Yum! Brands, Inc., "Annual Report 2024,"yum.com. Known for its fried chicken offerings, KFC's widespread presence highlights its ability to adapt to different markets and sustain its growth trajectory. The increasing penetration and expansion of QSR chains like McDonald's and KFC underline the sector's ability to meet the evolving demands of urban consumers seeking convenience and quick meal options. This trend is further supported by QSR brands' strategic efforts to innovate their menus, enhance delivery services, and leverage digital platforms to reach a broader audience, thereby ensuring sustained growth in the competitive fast-food market.
Digital loyalty and subscription programs boosting repeat visits
Subscription models and app-based loyalty programs are turning occasional diners into high-frequency customers by offering predictable value and personalized rewards. By the end of 2025, Starbucks’ loyalty program had 34 million active U.S. members, accounting for 57% of company-operated store sales and generating a lifetime value 3.2 times higher than non-members. Panera Bread’s unlimited-beverage subscription, priced at USD 11.99 per month, boosted visit frequency by 25% and increased average check size by USD 4.50 per visit. These programs also provide operators with zero-party data, including preferences, dietary restrictions, and purchase history, enabling highly targeted promotions and reducing marketing spend by 30% compared to mass-media campaigns. While the model is expanding into Europe and the Asia-Pacific region, adoption is slower in regions with lower smartphone penetration and fragmented payment ecosystems.
Rising tourism and out-of-home dining
International tourist arrivals reached 1.5 billion in 2025, surpassing pre-pandemic levels at 105%, with travelers allocating roughly 30% of their trip budgets to food and beverage, sustaining demand for quick-service restaurants in airports, train stations, and popular tourist districts, according to the United Nations World Tourism Organization. In the Middle East, Dubai and Riyadh are experiencing double-digit QSR growth as visa liberalization and mega-events attract 50 million annual visitors, prompting operators to launch 24-hour outlets and halal-certified menus that comply with local dietary laws, per the Saudi Tourism Authority. In Europe, tourism recovery is boosting sales in Spain, Italy, and France, where QSR penetration has historically lagged behind café and bistro culture, but younger travelers increasingly favor speed and value over sit-down dining, according to the European Travel Commission. Meanwhile, domestic tourism in China and India is accelerating, with weekend trips and short holidays driving demand for roadside QSR outlets offering familiar brands and consistent quality, encouraging operators to expand into tier-3 cities and highway corridors.
Restraints Impact Analysis
| Restraint | (~) % Impact on CAGR Forecast | Geographic Relevance | Impact Timeline |
|---|---|---|---|
| Rising Competition from Fast-Casual and Food Delivery Services | -1.4% | Global, with strongest impact in North America and Europe | Medium term (2-4 years) |
| Labour-Cost Inflation in High-Wage Markets Compressing Margins | -1.1% | North America and Europe, selective Asia-Pacific markets | Short term (≤ 2 years) |
| Rising Obesity and Chronic Diseases | -0.8% | Global, with regulatory focus in developed markets | Long term (≥ 4 years) |
| Intense Market Competition | -0.9% | Global, with saturation in mature markets | Medium term (2-4 years) |
| Source: Mordor Intelligence | |||
Rising competition from fast-casual and food delivery services
Fast-casual chains such as Chipotle, Panera, and Shake Shack are capturing share from traditional QSR operators by positioning at a 20% to 30% price premium while emphasizing fresh ingredients, customizable menus, and transparent sourcing. Chipotle's U.S. same-store sales grew 11% in 2025, outpacing the QSR sector's average of 6%, as the brand attracted health-conscious consumers willing to pay between USD 12 and USD 15 per entrée for perceived quality. Ghost kitchens and virtual brands, delivery-only concepts operating from shared commissaries, are proliferating in urban cores, offering 40% lower overhead than traditional storefronts and enabling rapid menu experimentation. These entrants compress incumbents' pricing power and force legacy brands to invest in menu innovation and digital capabilities, diverting capital from unit expansion and pressuring return on invested capital in mature markets.
Rising obesity and chronic diseases
Obesity prevalence among U.S. adults reached 42% in 2025, and diet-related chronic diseases, type 2 diabetes, and cardiovascular conditions cost the healthcare system USD 1.7 trillion annually, prompting policymakers to scrutinize ultra-processed foods and high-calorie menus as per the Centers for Disease Control and Prevention[3]Source: “Adult Obesity Facts, 2025,” Centers for Disease Control and Prevention, cdc.gov . The U.S. Food and Drug Administration finalized a rule in 2024 requiring chain restaurants to display calorie counts on drive-thru menu boards, a mandate that studies suggest reduces average order sizes by 5% to 8% as consumers opt for lower-calorie items. The World Health Organization issued guidelines in 2025 recommending that governments impose taxes on sugar-sweetened beverages and restrict marketing of unhealthy foods to children, policies already enacted in Mexico, Chile, and the United Kingdom. These regulatory headwinds are forcing QSR brands to reformulate recipes, introduce plant-based proteins, and expand salad and grain-bowl offerings, investments that dilute short-term profitability but position operators to capture health-conscious demand over the long term.
Segment Analysis
By Cuisine: Meat-based Cuisines Dominate, Pizza/Pasta Accelerates
Pizza and pasta concepts are experiencing the fastest growth among QSR cuisine segments, expanding at a 10.26% CAGR through 2031. Operators are leveraging conveyor ovens and AI-driven baking algorithms to reduce production times from 12 minutes to 7 minutes, enabling scalable ghost-kitchen models in dense urban areas, as highlighted by Domino’s Pizza Inc. Meat-based offerings, including burgers, fried chicken, and sandwiches, accounted for 37.18% of the market in 2025, led by McDonald’s, KFC, and Burger King, but growth is moderating to 7.8% CAGR. This slowdown reflects shifting consumer preferences toward plant-based proteins and heightened regulatory scrutiny over processed meats in Europe and North America, according to the World Health Organization. Seafood and dessert/ice cream concepts remain niche, contributing less than 10% of revenue, yet premium positioning and seasonal demand sustain modest mid-single-digit growth.
Other cuisines, including Mexican, Asian, and Mediterranean, are steadily gaining share as operators experiment with fusion formats and limited-time offerings to test consumer interest without committing to permanent menu changes. Taco Bell’s U.S. same-store sales grew 9% in 2025, supported by value-oriented Cravings Boxes and celebrity-chef collaborations that drove social-media engagement, per Yum! Brands Inc. Asian-inspired bowls and noodle concepts are spreading across North America and Europe, appealing to younger, customization-focused demographics, though supply-chain complexity and higher ingredient costs limit scalability relative to burgers and pizza. Cuisine strategies are increasingly converging toward hybrid formats, offering burgers, chicken, salads, and sides under one roof, to maximize kitchen efficiency and serve mixed-party groups, a model that Wendy’s and Shake Shack are piloting in select markets.
Note: Segment shares of all individual segments available upon report purchase
By Structure: Independent Resilience Challenges Franchises
Independent QSR outlets are expanding at a 9.27% CAGR through 2031, outpacing chained and franchised locations despite the latter holding a 52.34% share in 2025. Solo operators are capitalizing on hyper-local delivery zones, subscription models, and social-media-driven marketing to bypass franchise royalty fees and advertising levies. In India, independent QSRs grew 35% between 2020 and 2025, concentrated in tier-2 and tier-3 cities where real estate costs remain below USD 10 per square foot and regional flavor offerings resonate more strongly than multinational menus, according to McKinsey and Company. Chained and franchised outlets maintain structural advantages, including centralized procurement, national advertising, and standardized training, which deliver unit economics 15-20% higher than those of independent outlets in mature markets. However, rising royalty rates and mandatory technology investments, often exceeding USD 50,000 per location, pressure franchisee margins, according to the International Franchise Association.
The franchise model is shifting toward multi-unit operators managing 20–50 locations, allowing them to negotiate volume discounts and co-op advertising terms unavailable to smaller franchisees. McDonald’s reported that 70% of its U.S. franchisees operated five or more restaurants in 2025, up from 55% in 2020, with capital allocation increasingly focused on these high-performing partners. Independent operators are responding by forming buying cooperatives and adopting cloud-based point-of-sale systems for real-time inventory and customer analytics, capabilities previously exclusive to large chains. Regulatory changes in California and New York, including joint-employer liability rules, are raising compliance costs for franchisors, prompting some brands to shift toward company-operated models in high-wage markets, according to the U.S. Department of Labor.
By Service Model: Delivery Disrupts Traditional Formats
Home delivery, including both first-party and third-party channels, is expanding at a 10.57% CAGR through 2031, the fastest-growing service segment. Partnerships with aggregators reduce customer acquisition costs to under USD 5 per order in dense urban areas, while proprietary apps allow brands to capture zero-party data and bypass commission fees, according to Uber Technologies Inc. Drive-thru remains the largest off-premise channel, accounting for roughly 35% of North American transactions, with operators retrofitting lanes with dual ordering points and AI-driven voice systems to reduce wait times below 90 seconds and improve order accuracy to 95%, per McDonald’s. Dine-in service contributed 29.42% of revenue in 2025, supported by experiential formats, entertainment zones, alcohol service, and premium seating, which drive higher check averages and appeal to social occasions.
Takeaway and walk-up counters maintain mid-single-digit growth, catering to lunch-hour commuters and transit hubs where speed outweighs ambiance. Pandemic-era innovations such as curbside pickup are now being integrated into new-build locations with minimal investment, capturing customers who prioritize timing control. Starbucks reported that curbside and in-app pickup represented 18% of U.S. transactions in 2025, and the company is piloting drive-thru lanes dedicated to mobile orders in suburban markets. The service-model landscape is converging toward hybrid fulfillment centers, locations combining dine-in, drive-thru, delivery, and pickup from a single kitchen, allowing operators to maximize revenue per square foot and flex capacity across dayparts, a strategy being scaled by Chipotle and Panera in dense urban markets.

Note: Segment shares of all individual segments available upon report purchase
Geography Analysis
North America remains the largest QSR market globally, accounting for 32.69% of revenue in 2025. The region benefits from a mature drive-thru infrastructure, high per-capita spending on convenience meals (approximately USD 1,200 annually), and smartphone penetration exceeding 85%, which supports digital ordering and loyalty programs[4]Source: “Quick-Service Restaurant Industry, 2025,” U.S. Census Bureau, census.gov. The U.S. dominates with over 200,000 QSR outlets and same-store sales growth of 6% in 2025, driven by menu innovation, value offerings, and automation investments that offset labor-cost inflation. Canada’s market is expanding at a 7.2% CAGR, fueled by population growth and Tim Hortons’ dominance in coffee and breakfast segments, while Mexico is growing at 8.5% annually due to rising middle-class incomes and urbanization in secondary cities. Regulatory factors, such as California’s Fast Food Council and mandated minimum wages of USD 20, are accelerating the adoption of automation and prompting experimentation with labor-light formats, including digital kiosks and ghost kitchens.
The Asia-Pacific region is the fastest-growing, expanding at a 10.49% CAGR through 2031, driven by rising disposable incomes, widespread smartphone penetration (over 80%), and low-cost delivery in tier-2 cities. China grew 12% in 2025, led by KFC’s extensive network and local brands like Luckin Coffee, which blend Western formats with regional flavors and aggressive digital marketing. India’s QSR sector is accelerating at 14% annually, powered by Jubilant FoodWorks’ Domino’s franchise and Jollibee’s expansion into tier-2 cities, where lower real estate costs attract first-time customers. Japan and South Korea remain mature markets, growing 5–6%, with operators investing in automation and delivery partnerships to overcome labor shortages and capture off-peak demand. Australia and Indonesia are expanding 8–9%, driven by tourism recovery and franchise growth in suburban and regional areas.
Europe, South America, and the Middle East and Africa exhibit varied growth dynamics. Europe is growing at 7.3% CAGR, constrained by labor regulations and a preference for sit-down dining, though urbanization and tourism recovery are boosting demand. Germany, the U.K., France, Italy, and Spain generate 60% of European QSR revenue, with menu localization strategies such as beer at McDonald’s Germany and halloumi burgers at Burger King UK. Poland, the Netherlands, Belgium, and Sweden are emerging markets with growth exceeding 9% CAGR, aided by smartphone adoption and digital ordering. South America is expanding at 8.2% CAGR, with Brazil and Colombia leading through franchising and delivery-platform penetration, while Argentina’s volatility limits growth. MEA is growing at 9.8% CAGR, driven by visa liberalization, mega-events, halal-certified menus, and rising middle-class adoption of digital ordering; UAE and Saudi Arabia lead, while Nigeria, Egypt, Morocco, and Turkey represent high-potential markets with CAGR exceeding 11%, shaping franchise models and partnerships with local operators.
Competitive Landscape
The quick-service restaurant (QSR) sector remains highly fragmented, with the top five players (McDonald’s, Yum! Brands, Restaurant Brands International, Domino’s, and Starbucks) controlling a significant share of total global sales. This structure leaves significant opportunities for regional disruptors and independent operators to capture market share through hyper-local menus, aggressive franchising, and digital-first strategies. Leading incumbents are investing heavily in technology to protect their market positions: McDonald’s allocated USD 300 million to AI-driven drive-thru systems and dynamic menu boards that adjust pricing and promotions based on time of day, weather conditions, and local demand, while Domino’s filed 15 patents in 2025 for autonomous delivery vehicles and predictive ordering algorithms, reflecting a strategic focus on logistics and data science as competitive moats.
White-space opportunities are particularly strong in tier-2 and tier-3 cities across Asia-Pacific and Latin America, where QSR penetration remains below 15% and first-time customers are entering the market. These consumers are drawn to consistent product quality, transparent pricing, and digital payment solutions that reduce friction in ordering. Meanwhile, fast-casual operators such as Chipotle, Panera, and Shake Shack are pressuring traditional QSR brands by offering 20–30% higher pricing combined with fresh, customizable menus, a strategy that increased their share of the U.S. limited-service market from 8% in 2020 to 12% in 2025.
Urban cores are seeing the rise of ghost kitchens and virtual brands, which provide 40% lower overhead than traditional storefronts and enable rapid menu experimentation. However, their limited brand recognition and dependence on third-party aggregators constrain scalability and profitability. Regional players such as Jollibee in Southeast Asia and Jubilant FoodWorks in India leverage local insights and menu localization to achieve unit economics comparable to global players. The sector’s low barriers to entry maintain intense rivalry, compelling operators to differentiate through loyalty programs, limited-time offers, and experiential formats that convert single transactions into recurring revenue streams.
Quick-Service Restaurant Industry Leaders
-
McDonald's Corporation
-
Yum! Brands, Inc.
-
Restaurant Brands International Inc.
-
Domino’s Pizza, Inc.
-
Starbucks Corporation
- *Disclaimer: Major Players sorted in no particular order
Recent Industry Developments
- June 2025: Pizza Hut introduced its limited-edition menu, "Hut Lover’s Pizzas," which featured four extravagant pizzas. Each pizza was generously topped with premium ingredients and priced at USD 12.99 for a large pizza.
- May 2025: KFC, a global fast-food giant, introduced a EUR 1.5 billion investment plan for its UK and Ireland operations. The company aims to capitalize on the growing demand for fried chicken by opening 500 new restaurants over the next decade.
- April 2025: Panera introduced its unique Croissant Toast sandwiches in the United States as part of a spring menu revamp. This refresh highlights a variety of offerings, including the launch of the Strawberry Chicken Caprese Salad. Furthermore, the menu sees the return of customer favorites such as the Strawberry Poppyseed Chicken Salad and Mexican Street Corn Chowder, now available at Panera® cafes nationwide.
- April 2025: Pizza Hut introduced its innovative offering, Pizza Caviar. This new creation brings a bold, smoky pepperoni flavor in an exciting format. Featured prominently in the newly launched Pizza Caviar Bump Box. It comprises a cheese Personal Pan Pizza®, a selection of either three plain boneless wings or fries, all enhanced with the zesty bursts of pepperoni-flavored "Pizza Caviar".
Global Quick-Service Restaurant Market Report Scope
A quick-service restaurant (QSR) is an establishment that specializes in food items requiring minimal preparation time and delivers them through expedited service. The report provides a comprehensive analysis of the global quick-service and casual-dining market, segmented by cuisine, outlet structure, service model, and geography. By cuisine, the market is examined across burger and sandwich offerings, pizza and pasta, meat-based dishes, seafood, ice cream/desserts, bakery products, and other regional cuisines, including Mexican, Asian, and Mediterranean. In terms of outlet structure, the report covers both independent restaurants and chained/franchised outlets. The market is also analyzed by service model, including dine-in, drive-thru, take-away or walk-up counters, home delivery through first- and third-party services, and curbside pickup. Geographically, the study encompasses North America, Europe, Asia-Pacific, South America, and the Middle East and Africa, highlighting regional market dynamics, growth opportunities, and consumer trends across key countries and regions. Market sizing and forecasts for all segments are calculated based on value (USD).
| Burger/Sandwich |
| Pizza/Pasta |
| Meat-based Cuisine |
| Seafood |
| Ice-Cream/Dessert |
| Bakery Products |
| Other Cuisines (Mexican, Asian, etc.) |
| Independent Outlets |
| Chained/Franchised Outlets |
| Dine-In |
| Drive-Thru |
| Take-Away/Walk-Up Counter |
| Home Delivery (First- and Third-Party) |
| Curbside Pickup |
| North America | United States |
| Canada | |
| Mexico | |
| Rest of North America | |
| Europe | Germany |
| United Kingdom | |
| Italy | |
| France | |
| Spain | |
| Netherlands | |
| Poland | |
| Belgium | |
| Sweden | |
| Rest of Europe | |
| Asia-Pacific | China |
| India | |
| Japan | |
| Australia | |
| Indonesia | |
| South Korea | |
| Thailand | |
| Singapore | |
| Rest of Asia-Pacific | |
| South America | Brazil |
| Argentina | |
| Colombia | |
| Chile | |
| Peru | |
| Rest of South America | |
| Middle East and Africa | South Africa |
| Saudi Arabia | |
| United Arab Emirates | |
| Nigeria | |
| Egypt | |
| Morocco | |
| Turkey | |
| Rest of Middle East and Africa |
| By Cuisine | Burger/Sandwich | |
| Pizza/Pasta | ||
| Meat-based Cuisine | ||
| Seafood | ||
| Ice-Cream/Dessert | ||
| Bakery Products | ||
| Other Cuisines (Mexican, Asian, etc.) | ||
| By Structure | Independent Outlets | |
| Chained/Franchised Outlets | ||
| By Service Model | Dine-In | |
| Drive-Thru | ||
| Take-Away/Walk-Up Counter | ||
| Home Delivery (First- and Third-Party) | ||
| Curbside Pickup | ||
| By Geography | North America | United States |
| Canada | ||
| Mexico | ||
| Rest of North America | ||
| Europe | Germany | |
| United Kingdom | ||
| Italy | ||
| France | ||
| Spain | ||
| Netherlands | ||
| Poland | ||
| Belgium | ||
| Sweden | ||
| Rest of Europe | ||
| Asia-Pacific | China | |
| India | ||
| Japan | ||
| Australia | ||
| Indonesia | ||
| South Korea | ||
| Thailand | ||
| Singapore | ||
| Rest of Asia-Pacific | ||
| South America | Brazil | |
| Argentina | ||
| Colombia | ||
| Chile | ||
| Peru | ||
| Rest of South America | ||
| Middle East and Africa | South Africa | |
| Saudi Arabia | ||
| United Arab Emirates | ||
| Nigeria | ||
| Egypt | ||
| Morocco | ||
| Turkey | ||
| Rest of Middle East and Africa | ||
Key Questions Answered in the Report
What is the projected value of the quick service restaurants market by 2031?
The quick service restaurants market size is expected to reach USD 1.74 trillion by 2031, up from USD 1.16 trillion in 2026.
Which cuisine category is growing the fastest within limited-service dining?
Pizza-and-pasta concepts lead growth, posting a 10.26% CAGR because AI-driven ovens cut bake times and support ghost-kitchen expansion.
Why are independent quick service outlets gaining ground on chains?
Independents leverage hyper-local delivery zones and social-media marketing, growing at 9.27% annually compared with chains’ slower pace.
How is labor-cost inflation influencing store design?
Rising wages in North America and Western Europe are prompting chains to install kiosks, robotic fryers, and drive-thru voice-AI, lowering front-counter staffing needs.
Which region will contribute the most incremental revenue through 2031?
Asia-Pacific, projected to grow at 10.49% CAGR, will add the largest share of new revenue owing to smartphone ubiquity and expanding middle-class incomes.


