Market Overview
| Study Period | 2021 - 2031 |
|---|---|
| Forecast Data Period | 2026 - 2031 |
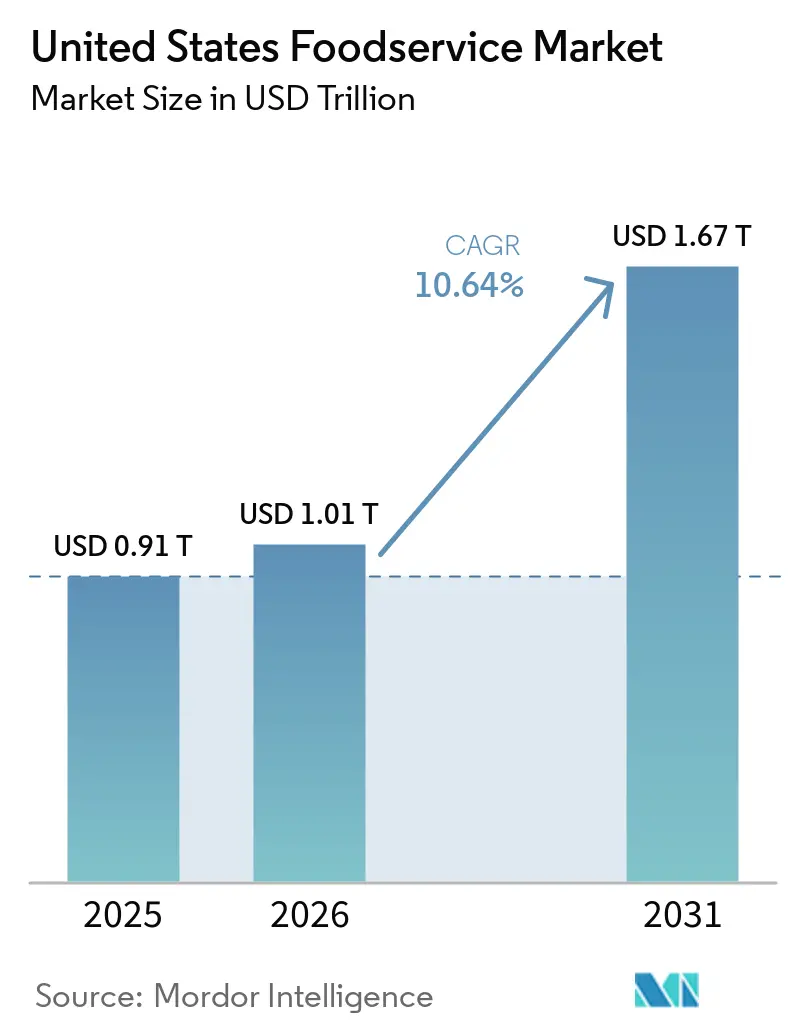
| Base Year Market Size (2025) | USD 0.91 Trillion |
| Market Size (2026) | USD 1.01 Trillion |
| Market Size (2031) | USD 1.67 Trillion |
| Growth Rate (2026 - 2031) | 10.64% CAGR |
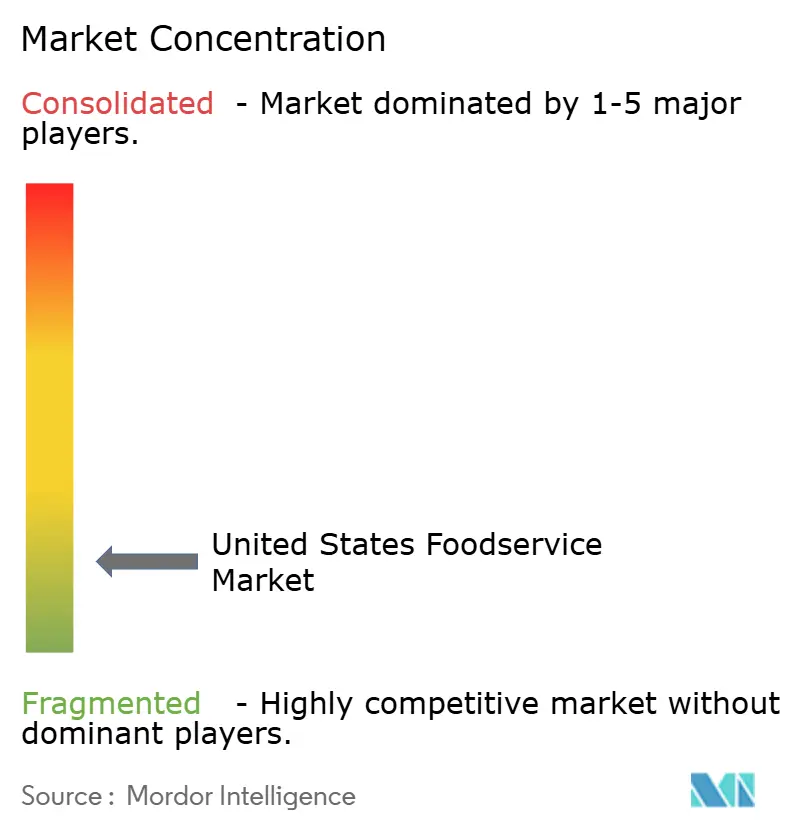
| Market Concentration | Low |
Major Players*Disclaimer: Major Players sorted in no particular order Image © Mordor Intelligence. Reuse requires attribution under CC BY 4.0. | |
United States Foodservice Market Analysis by Mordor Intelligence
The United States Foodservice Market size is projected to expand from USD 0.91 trillion in 2025 and USD 1.01 trillion in 2026 to USD 1.67 trillion by 2031, registering a CAGR of 10.64% between 2026 to 2031.
Driven by rapid digital ordering adoption, health-focused menu innovations, and a surge in capital for asset-light delivery formats, the U.S. foodservice restaurant market is witnessing notable expansion. While operators grapple with rising wage bills and fluctuating commodity prices, consumer spending on dining out is outpacing general inflation, highlighting the sector's resilience. Major chains are increasingly turning to automation and data analytics, whereas independent establishments are focusing on local sourcing and unique experiences to draw in customers. The U.S. foodservice restaurant market outlook is further bolstered by strategic franchising, the rise of suburban delivery hubs, and the widespread acceptance of contactless payments.
Key Report Takeaways
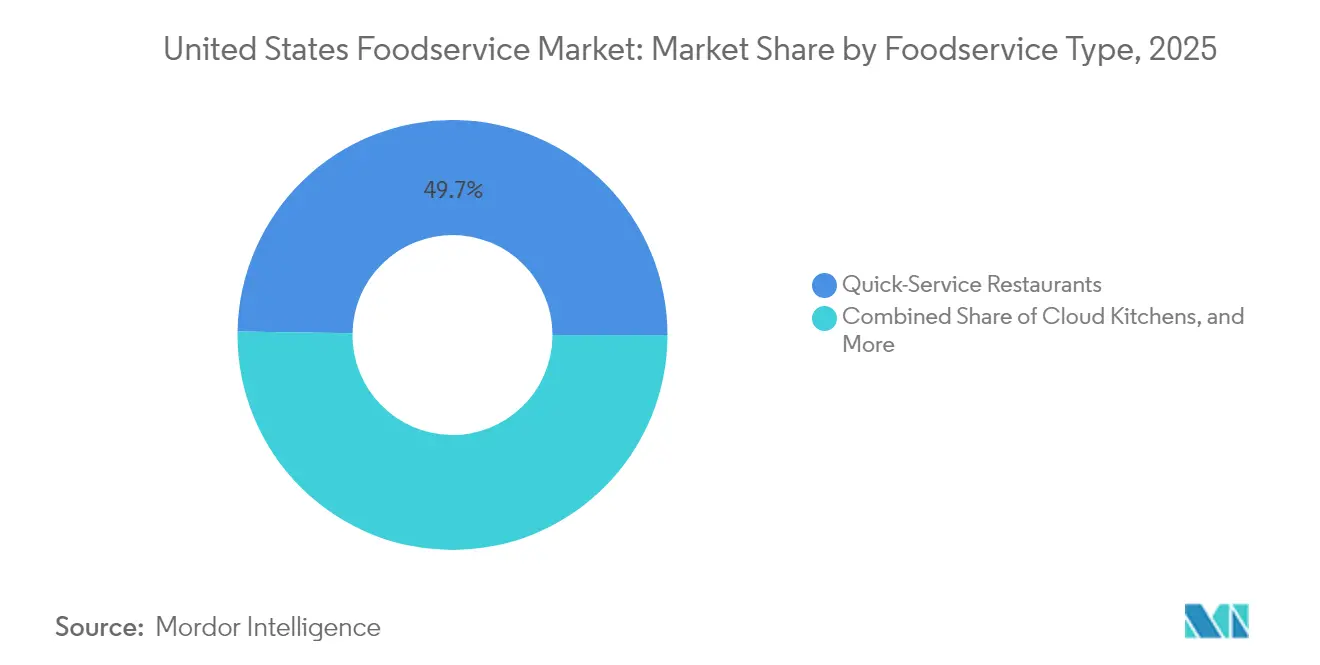
- By foodservice type, quick-service restaurants led with 49.74% of the United States foodservice restaurants market share in 2025, whereas cloud kitchens are set to post the fastest 12.35% CAGR through 2031.
- By outlet, independent venues held a 63.58% revenue share in 2025, while chained formats are expected to record the highest 11.21% CAGR from 2025 to 2031.
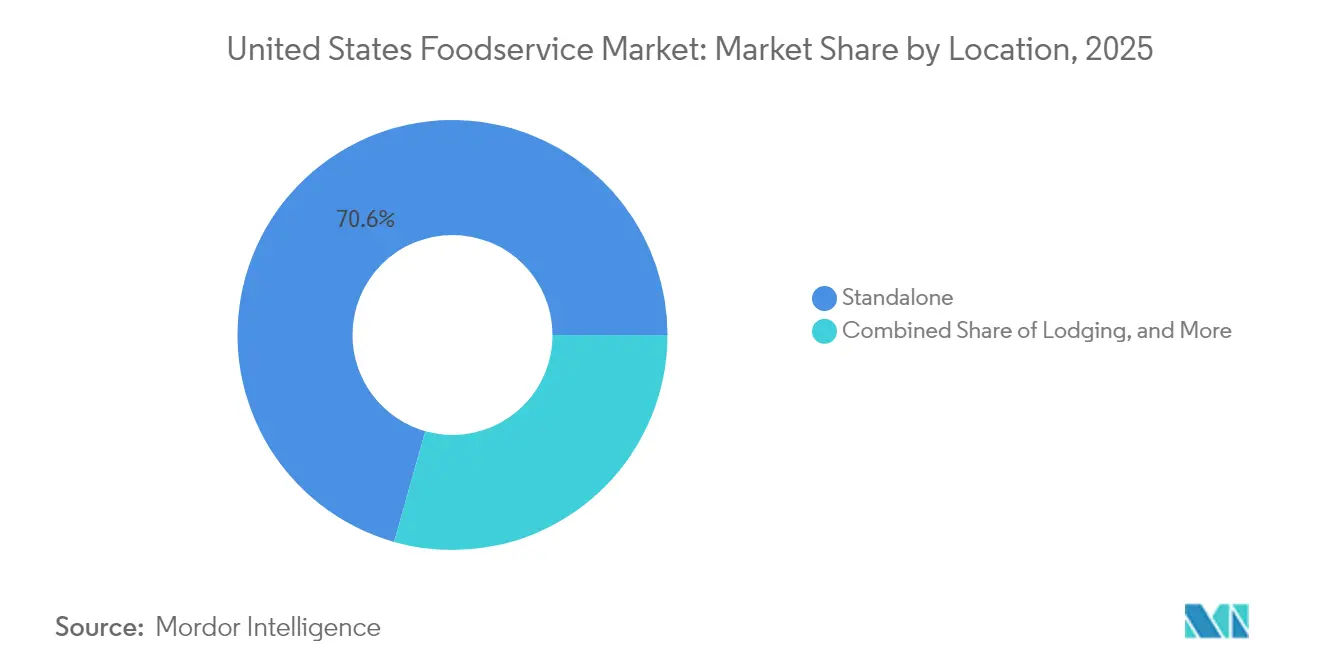
- By location, standalone units controlled 70.62% of 2025 sales, but lodging-based venues are forecast to expand at a 13.02% CAGR through 2031.
- By service, dine-in captured 55.71% of spending in 2025; delivery channels are projected to advance at an 11.05% CAGR during the same horizon.
Note: Market size and forecast figures in this report are generated using Mordor Intelligence’s proprietary estimation framework, updated with the latest available data and insights as of 2026.
United States Foodservice Market Trends and Insights
Drivers Impact Analysis*
| Driver | (~) % Impact on CAGR Forecast | Geographic Relevance | Impact Timeline |
|---|---|---|---|
| Experience-Centric Dining Demand | +1.8% | National, concentrated in urban metros | Medium term (2-4 years) |
| Expansion of Online Food Delivery and Contactless Services | +2.1% | National, with higher penetration in suburban markets | Short term (≤ 2 years) |
| Drive-Thru and Self-Service Kiosks Enhancements | +1.4% | National, particularly in QSR segments | Medium term (2-4 years) |
| Expansion of Innovative Service Models like Cloud Kitchens | +2.3% | Metropolitan areas, expanding to secondary cities | Long term (≥ 4 years) |
| Menu Innovation and Customization | +1.2% | National, with regional flavor preferences | Short term (≤ 2 years) |
| Strategic Franchise and Footprint Expansion | +1.6% | National, with focus on underserved markets | Long term (≥ 4 years) |
| Source: Mordor Intelligence | |||


Experience-Centric Dining Demand
Driven by consumer demand for immersive dining, restaurant operators are pouring investments into ambiance, tech integration, and tailored service models. This evolution underscores a post-pandemic shift: dining out has morphed from a basic need to a platform for social reconnection and rich experiences. In 2024, Starbucks Corporation committed a hefty USD 750 million to revamp its stores, enhancing experiences with features like expanded seating and community spaces, as highlighted by Starbucks Investor Relations[1]Source: Starbucks Corporation, “Q4 FY 2024 Results,” starbucks.com. Data analytics are becoming a staple for restaurant operators, with 67% of full-service venues harnessing personalization tech to tailor menu suggestions and service. Casual dining and specialty restaurants, in particular, are reaping the rewards, using distinct atmospheres and curated experiences to set themselves apart. Meanwhile, FDA-mandated sanitation and food safety protocols, once seen as pandemic-era necessities, have now become standard expectations. This shift allows operators to channel their resources towards crafting unique experiences, rather than merely ensuring basic safety.
Expansion of Online Food Delivery and Contactless Services``
Digital ordering platforms and contactless payment systems transformed from pandemic necessities into permanent operational infrastructure, fundamentally altering restaurant economics and customer acquisition strategies. Third-party delivery services now account for 13.4% of total restaurant sales, with commission rates averaging 15-30% creating both revenue opportunities and margin pressures National Restaurant Association[2]Source: National Restaurant Association, “State of the Restaurant Industry 2024,” restaurant.org. McDonald's Corporation reported that digital channels, including mobile app orders and delivery, comprised 40% of systemwide sales in 2024, generating higher average order values and improved customer data collection capabilities. Cloud kitchen operators particularly benefit from this trend, with dedicated delivery-only facilities achieving 20-25% higher profit margins compared to traditional dine-in establishments. Contactless payment adoption reached 78% of restaurant transactions in 2024, driven by consumer preference for speed and hygiene considerations. The integration of artificial intelligence in order prediction and inventory management enables restaurants to optimize kitchen operations and reduce food waste by 15-20%.
Drive-Thru and Self-Service Kiosks Enhancements
In 2024, quick-service restaurants poured USD 3.2 billion into automation technologies, with a notable 45% of that investment directed towards enhancing drive-thru operations. McDonald's Corporation, for instance, rolled out its automated order-taking systems to 1,200 outlets, boasting an impressive 85% order accuracy, up from the 75% achieved by human operators, and slashing average service time by half a minute. Meanwhile, self-service kiosks, with their savvy upselling prompts and eye-catching visual menus, are driving average order values up by 15-20%. As restaurant wages climbed 4.2% year-over-year, the pressure on labor costs has hastened the push towards automation. Furthermore, in a nod to inclusivity, kiosk designs are now aligning with Americans with Disabilities Act standards, ensuring features that cater to a broader customer base. This technological shift is especially pronounced in high-volume venues, where the interplay of labor efficiency, profitability, and customer satisfaction is most keenly felt.
Expansion of Innovative Service Models like Cloud Kitchens
Cloud kitchens and ghost kitchens are rapidly emerging as the leading segment in the foodservice industry, capitalizing on delivery-centric operations to enhance unit economics and deepen market penetration. These delivery-exclusive setups slash real estate expenses by 40-60% compared to their traditional counterparts, all while allowing operators to experiment with new concepts at a fraction of the usual capital outlay. In 2024, CloudKitchens. Wonder secured a hefty USD 950 million in Series C funding, aiming to broaden its network of multi-brand cloud kitchens, especially in suburban areas where traditional restaurants are sparse. This innovative model permits established brands to venture into new regions without the hefty investment of a full restaurant setup. For instance, Chipotle Mexican Grill has successfully rolled out 50 delivery-only spots, achieving sales figures on par with its traditional outlets. Cloud kitchens find particular success in urban centers, where soaring real estate prices and high delivery demand create an ideal operational landscape. Meanwhile, local health departments and FDA guidelines oversee the regulatory landscape for commercial kitchens, ensuring standardized operations but also erecting hurdles for less-capitalized entrants eyeing the market.
Restraints Impact Analysis*
| Restraint | (~) % Impact on CAGR Forecast | Geographic Relevance | Impact Timeline |
|---|---|---|---|
| Changing Consumer Preferences and Dietary Trends | -0.9% | National, with regional variations | Medium term (2-4 years) |
| Economic Uncertainty and Inflationary Pressures | -1.4% | National, with higher impact in price-sensitive segments | Short term (≤ 2 years) |
| Supply-Chain Volatility for Key Commodities | -1.1% | National, with regional supply variations | Short term (≤ 2 years) |
| Rising Food and Labor Costs | -1.6% | National, with higher impact in high-wage markets | Medium term (2-4 years) |
| Source: Mordor Intelligence | |||
Changing Consumer Preferences and Dietary Trends
In 2024, a notable shift in dining preferences emerged, with 23% of diners actively seeking vegetarian or vegan options, as highlighted by the National Restaurant Association. This surge in demand for plant-based proteins poses challenges for traditional meat-centric establishments, such as burger joints and steakhouses, pushing them to diversify their menus and rethink their supply chains. Furthermore, younger consumers, who account for 40% of restaurant spending, are placing a premium on sustainability and ethical sourcing. This heightened awareness is driving restaurants to be more transparent about their ingredient sourcing and environmental practices. However, this commitment to sustainability comes at a cost. Operators are grappling with rising expenses for organic, locally-sourced, and specialty dietary ingredients. These premium prices can restrict market access for some consumers. Additionally, the growing complexity of catering to varied dietary preferences and restrictions is not only challenging restaurant operations but also necessitating more extensive staff training.
Economic Uncertainty and Inflationary Pressures
In 2024, food-away-from-home inflation hit 3.9% year-over-year, outpacing general inflation and tightening consumer budgets, as reported by the USDA Economic Research Service. Persistent inflation and economic uncertainty have curtailed consumer discretionary spending on dining out, with casual dining and full-service restaurants feeling the brunt. Lower-income households, which make up 35% of restaurant patrons, cut back their dining frequency by 12% from 2023, opting instead for value-driven quick-service alternatives. Restaurant operators grapple with margin compression; while they raise menu prices, there's a looming risk of alienating customers. A notable 68% of establishments struggle to fully transfer cost increases to diners. Economic uncertainties have dampened discretionary dining events, such as celebrations and business meals, leading to reduced average check sizes and fewer visits. Furthermore, credit card delinquency rates in the restaurant sector climbed to 3.2% in 2024, underscoring the financial strain on consumers and its repercussions on restaurant cash flow management.
*Our forecasts treat driver/restraint impacts as directional, not additive. The impact forecasts reflect baseline growth, mix effects, and variable interactions.
Segment Analysis
By Foodservice Type: Cloud Kitchens Accelerate Digital Transformation
Cloud kitchens are set to grow at a brisk pace of 12.35% CAGR through 2031, even as quick-service restaurants (QSRs) dominate with a hefty 49.74% market share in 2025. This upward trend underscores a shift in how consumers order food and how restaurants operate. Full-service restaurants, which offer traditional dine-in experiences, grapple with shrinking margins due to rising labor costs and a consumer shift towards convenience. However, Asian cuisine concepts in these full-service venues are holding their ground, riding a wave of growing interest in diverse and authentic flavors.
Cloud kitchens are rapidly expanding, capitalizing on their unique model of serving multiple brands from a single location, all while keeping real estate and labor costs in check. A testament to this trend is Wonder's impressive USD 950 million funding round in 2024, signaling strong investor faith in delivery-centric models that boast profit margins 20-25% higher than their traditional counterparts, as noted by PitchBook. Meanwhile, cafes and bars, especially niche coffee shops, are thriving with hybrid models that seamlessly blend traditional service and delivery. Bakeries, operating under the QSR umbrella, are harnessing automation to ensure consistent quality, catering to both in-store patrons and delivery orders. This evolution of the segment mirrors a broader industry trend towards digitization, emphasizing the critical role of technology in maintaining a competitive edge across all foodservice domains.


By Outlet: Franchise Models Drive Chained Growth
In 2025, independent outlets hold a 63.58% market share, but chained operations are growing at a robust 11.21% CAGR. This growth underscores the advantages of standardized systems and brand recognition. The disparity in growth rates emphasizes the scalability of franchise models, especially in markets where brand consistency and operational efficiency are paramount to consumers. Chained outlets benefit from economies of scale in areas like purchasing, marketing, and technology, giving them a competitive edge that independent operators find hard to replicate.
Franchise expansion is a boon for established brands aiming for geographic reach without heavy capital outlay. In 2024, McDonald's Corporation opened 1,100 net new locations worldwide, with a striking 95% run by franchisees, tapping into local market insights and management expertise, as highlighted by McDonald's Investor Relations. While independent outlets excel in menu flexibility, local customization, and community ties, they grapple with challenges in tech adoption and supply chain efficiency. Navigating the regulatory landscape, from FDA Food Code compliance to local health mandates, adds complexity. This is where chained operators, with their dedicated compliance teams, find an edge. Moreover, labor market trends favor chained outlets, thanks to their standardized training and career growth opportunities, leading to better employee retention.
By Location: Lodging Integration Creates Growth Opportunities
In 2025, standalone locations command a dominant 70.62% market share. Meanwhile, lodging-based establishments are witnessing a robust surge, boasting a 13.02% CAGR. This uptick is largely attributed to a rebound in the hotel industry and a push towards integrated hospitality experiences. Such growth underscores the strategic importance of nurturing captive customer bases and extending dining occasions within these environments. Dining venues tied to travel are reaping the rewards of a resurgence in both business and leisure travel. Notably, locations at airports and along highways are bouncing back with vigor from previous pandemic-induced downturns.
By weaving restaurant concepts into lodging facilities, both sectors are unlocking operational efficiencies and diversifying their revenue streams. In a move underscoring this trend, Marriott International bolstered its food and beverage collaborations in 2024. The hotel giant is now seamlessly integrating third-party restaurant brands into its properties, aiming to elevate guest experiences while streamlining operations. However, retail spots nestled within shopping centers and entertainment hubs are grappling with shifts in consumer shopping behaviors and a dip in foot traffic. To counteract these challenges, there's a pressing need for innovative concepts and immersive dining experiences to draw in patrons. Restaurants situated in leisure hotspots, be it entertainment districts or recreational venues, are riding the wave of experiential dining trends. Yet, they must navigate the choppy waters of seasonal fluctuations and revenues tied to specific events. Additionally, food service establishments in hospitality settings are contending with FDA compliance mandates. These regulations become even more critical for venues catering to vulnerable groups or those situated in multi-use facilities.
By Service Type: Delivery Channels Reshape Operations
In 2025, dine-in services command a 55.71% market share, but delivery operations are on the rise, expanding at an 11.05% CAGR. This surge is reshaping restaurant designs, menu strategies, and how restaurants engage with customers. Such changes underscore a lasting shift in consumer behavior, with a growing emphasis on convenience and flexibility. Meanwhile, takeaway services strike a balance, delivering speed and convenience without the commission fees tied to third-party delivery platforms. As delivery services flourish, they present both opportunities and hurdles for restaurant operators. Notably, delivery transactions boast average order values 15-20% higher than their dine-in counterparts. This premium often helps establishments counterbalance commission fees and packaging expenses, as highlighted by the National Restaurant Association.
Consequently, restaurant designs are evolving, with many now featuring dedicated pickup zones and kitchens tailored for both dine-in and delivery. Emphasizing this shift, a significant 78% of restaurants have adopted digital ordering systems to streamline their multi-channel operations. However, the delivery service landscape isn't without its challenges. Local jurisdictions are actively shaping the scene, introducing fee caps and operational mandates that influence both platform economics and restaurant involvement. Furthermore, as restaurants adapt, there's a noticeable shift in labor focus. More emphasis is being placed on kitchen operations and coordinating deliveries, pushing establishments to cultivate new skills and refine operational procedures to stay competitive.
Geography Analysis
Across the United States, foodservice restaurants exhibit notable regional differences, shaped by demographic trends, economic conditions, and state-specific regulations. Urban centers, especially on the Northeast and West Coast, are leaning more towards delivery services and upscale dining, with average spending 25-30% above the national norm. Cities like New York, Los Angeles, and Chicago are at the forefront of cloud kitchen adoption, where delivery-only setups thrive in densely populated areas. Meanwhile, franchise expansions are making headway into rural and suburban markets, as chain operators target these less saturated locales, benefiting from lower real estate prices and diminished competition.
Economic disparities across states lead to varied market dynamics. For instance, states like California (USD 20.00 for fast-food workers) and New York (USD 15.00 statewide) with their elevated minimum wage mandates, are witnessing a swift shift towards automation and adjustments in menu pricing, as noted by the Bureau of Labor Statistics. In contrast, Southern and Midwestern markets are seeing a surge in value-driven dining, a trend that mirrors local income levels and consumer sensitivity to prices. States like Florida, Nevada, and Hawaii, heavily reliant on tourism, experience market volatility but also enjoy boosts from seasonal demand and international tourist spending. Furthermore, California's stringent labor and environmental regulations are reshaping operational costs and competitive landscapes in the state.
As demographics shift, restaurant operators are presented with unique opportunities. Younger populations flocking to cities like Austin, Nashville, and Denver are spurring a demand for varied dining experiences. In states like Texas, Arizona, and Florida, the growing Hispanic demographic is paving the way for authentic ethnic cuisines and culturally attuned menus. Meanwhile, an aging demographic in certain areas is reshaping menu choices and accessibility needs. College towns, with their influx of students, consistently seek affordable and convenient dining. Geographically, supply chain challenges differ: coastal areas grapple with elevated transportation costs, while agricultural hubs enjoy fresh produce and competitive commodity pricing. Lastly, while most state and local health regulations align with the FDA Food Code, multi-state operators must adeptly navigate these variations, often resorting to standardized compliance programs and localized strategies.
Competitive Landscape
The foodservice restaurant market in the United States is characterized by moderate concentration, revealing a landscape of fragmented competition across diverse segments and service models. This fragmentation not only presents challenges but also opens avenues for both established entities and new entrants to carve out their market share, primarily through differentiation and operational excellence. While giants like McDonald's Corporation, Starbucks Corporation, and Yum! Brands Inc. leverages brand recognition, expansive operational scales, and a growing franchise network to assert its dominance; they are increasingly contending with competition from niche concepts and tech-savvy operators.
Operators that adeptly weave in digital ordering, delivery services, and data analytics into their operations are finding favor in this competitive arena, especially in terms of customer acquisition and retention. The adoption of technology stands out as a pivotal differentiator in the market. Leading players are channeling significant investments into automation, artificial intelligence, and platforms enhancing customer experiences. A testament to this trend, Restaurant365 secured USD 175 million in Series C funding in 2024, underscoring the critical role of operational technology in shaping competitive standings.
Cloud kitchen innovators, such as Wonder and Kitchen United, are reshaping the competitive landscape. By housing multiple brand concepts under one roof, they are not only redefining traditional restaurant economics but also lowering market entry barriers. However, the journey isn't devoid of challenges. The regulatory landscape, steered by FDA Food Code mandates and local health department stipulations, imposes compliance costs. These costs tend to favor larger operators, equipped with dedicated resources, while posing hurdles for smaller competitors eyeing market entry or expansion. Furthermore, as sustainability takes center stage, operators are feeling the heat. With rising consumer expectations for environmental stewardship, many are pivoting towards energy-efficient tools, sustainable packaging, and robust waste reduction initiatives, not just to align with market demands but also to navigate regulatory landscapes.
United States Foodservice Industry Leaders
Darden Restaurants, Inc.
Doctor's Associates, Inc.
Inspire Brands, Inc.
Starbucks Corporation
Yum! Brands, Inc.
- *Disclaimer: Major Players sorted in no particular order

Recent Industry Developments
- November 2024: Wonder completed a USD 950 million Series C funding round led by Bain Capital Ventures to expand its multi-brand cloud kitchen network across suburban markets, targeting 1,000 locations by 2026.
- October 2024: McDonald's Corporation announced plans to add 10,000 new restaurants globally by 2027, with 50% of these locations to be situated in international markets and a significant expansion in underserved U.S. communities. The expansion includes enhanced drive-thru automation and delivery-optimized kitchen designs to improve operational efficiency.
- September 2024: Starbucks Corporation has launched its largest menu innovation in company history, introducing 20 new beverages and food items designed to cater to customization and dietary preferences. The rollout includes plant-based protein options and regionally-inspired flavors to address evolving consumer preferences.
- July 2024: Yum! Brands Inc. completed the acquisition of Heartstyles, a Middle Eastern restaurant concept, for USD 200 million to diversify its portfolio beyond traditional American fast food and capture growing demand for authentic ethnic cuisine.


United States Foodservice Market Report Scope
Cafes & Bars, Cloud Kitchen, Full Service Restaurants, Quick Service Restaurants are covered as segments by Foodservice Type. Chained Outlets, Independent Outlets are covered as segments by Outlet. Leisure, Lodging, Retail, Standalone, Travel are covered as segments by Location.By Foodservice Type
| Cafes & Bars | Bars & Pubs |
| Cafes | |
| Juice/Smoothie/Dessert Bars | |
| Specialist Coffee & Tea Shops | |
| Cloud Kitchens | |
| Full-Service Restaurants | Asian |
| European | |
| Latin American | |
| Middle Eastern | |
| North American | |
| Other FSR Cuisines | |
| Quick-Service Restaurants | Bakeries |
| Burger | |
| Ice-cream & Frozen Treats | |
| Meat-based Concepts | |
| Pizza | |
| Other QSR Cuisines |
By Outlet
| Chained Outlets |
| Independent Outlets |
By Location
| Leisure |
| Lodging |
| Retail |
| Standalone |
| Travel |
Service Type
| Dine-in |
| Takeaway |
| Delivery |
| By Foodservice Type | Cafes & Bars | Bars & Pubs |
| Cafes | ||
| Juice/Smoothie/Dessert Bars | ||
| Specialist Coffee & Tea Shops | ||
| Cloud Kitchens | ||
| Full-Service Restaurants | Asian | |
| European | ||
| Latin American | ||
| Middle Eastern | ||
| North American | ||
| Other FSR Cuisines | ||
| Quick-Service Restaurants | Bakeries | |
| Burger | ||
| Ice-cream & Frozen Treats | ||
| Meat-based Concepts | ||
| Pizza | ||
| Other QSR Cuisines | ||
| By Outlet | Chained Outlets | |
| Independent Outlets | ||
| By Location | Leisure | |
| Lodging | ||
| Retail | ||
| Standalone | ||
| Travel | ||
| Service Type | Dine-in | |
| Takeaway | ||
| Delivery | ||


Market Definition
- FULL-SERVICE RESTAURANTS - A foodservice establishment where customers are seated at a table, give their order to a server and are served food at a table.
- QUICK SERVICE RESTAURANTS - A foodservice establishment that provides customers convenience, speed, and food offerings at lower prices. Customers usually help themselves and carry their own food to their tables.
- CAFES & BARS - A type of foodservice business that include bars and pubs that are licensed to serve alcoholic drinks for consumption, cafes that serve refreshments and light food items, as well as specialty tea and coffee shops, dessert bars, smoothie bars, and juice bars.
- CLOUD KITCHEN - A foodservice business that utilizes a commercial kitchen for the purpose of preparing food for delivery or takeout only, with no dine-in customers.
| Keyword | Definition |
|---|---|
| Albacore Tuna | It is one of the smallest species of tuna found in the six distinct stocks known globally in the Atlantic, Pacific, and Indian oceans, as well as the Mediterranean Sea. |
| Angus beef | It is beef derived from a specific breed of cattle indigenous to Scotland. It requires certification from the American Angus Association to receive the "Certified Angus Beef" quality mark. |
| Asian cuisine | It includes full-service offerings in restaurants that serve cuisines from cultures such as Chinese, Indian, Korean, Japanese, Bengali, Southeast Asian, etc. |
| Average Order Value | It is the average value of all orders made by the customers at a foodservice establishment. |
| Bacon | It is salted or smoked meat that comes from the back or sides of a pig. |
| Bars & Pubs | It is a drinking establishment that is licensed to serve alcoholic drinks for consumption on the premises. |
| Black Angus | It is beef derived from a black-hided breed of cows that don't have horns. |
| BRC | British Retail Consortium |
| Burger | It is a sandwich consisting of one or more cooked beef patties, placed inside a sliced bread roll or bun roll. |
| Café | It is a foodservice establishment serving various refreshments (mainly coffee) and light meals. |
| Cafes & Bars | It is a type of foodservice business that include bars and pubs that are licensed to serve alcoholic drinks for consumption, cafes that serve refreshments and light food items, as well as specialty tea and coffee shops, dessert bars, smoothie bars, and juice bars. |
| Cappuccino | It is an Italian coffee drink that is traditionally prepared with equal parts double espresso, steamed milk, and steamed milk foam. |
| CFIA | Canadian Food Inspection Agency |
| Chained Outlet | It refers to a foodservice establishment that shares brands, operates in several locations, has central management, and standardized business practices. |
| Chicken Tender | It refers to chicken meat prepared from the pectoralis minor muscles of a chicken bird. |
| Cloud Kitchen | It is a foodservice business that utilizes a commercial kitchen for the purpose of preparing food for delivery or takeout only, with no dine-in customers. |
| Cocktail | It is an alcoholic mixed drink made with either a single spirit or a combination of spirits, mixed with other ingredients such as juices, flavored syrups, tonic water, shrubs, and bitters. |
| Edamame | It is a Japanese dish prepared with soybeans (harvested before they ripen or harden) and cooked in its pod. |
| EFSA | European Food Safety Authority |
| ERS | Economic Research Service of the USDA |
| Espresso | It is a concentrated form of coffee, served in shots. |
| European cuisine | It includes full-service offerings in restaurants that serve cuisines from cultures such as Italian, French, German, English, Dutch, Danish, etc. |
| FDA | Food and Drug Administration |
| Fillet Mignon | It is a cut of meat taken from the smaller end of the tenderloin. |
| Flank Steak | It is a cut of beef steak taken from the flank, which lies forward of the rear quarter of a cow. |
| Foodservice | It refers to the part of the food industry which includes businesses, institutions, and companies which prepare meals outside the home. It includes restaurants, school and hospital cafeterias, catering operations, and many other formats. |
| Franks | Also known as frankfurter or Würstchen, it is a type of highly seasoned smoked sausage popular in Austria and Germany. |
| FSANZ | Food Standards Australia New Zealand |
| FSIS | Food Safety and Inspection Service |
| FSSAI | Food Safety and Standards Authority of India |
| Full service restaurant | It refers to a foodservice establishment where customers are seated at a table, give their order to a server, and are served food at a table. |
| Ghost Kitchen | It refers to a cloud kitchen. |
| GLA | Gross Leasable Area |
| Gluten | It is a family of proteins found in grains, including wheat, rye, spelt, and barley. |
| Grain-fed beef | It is beef derived from cattle that have been fed a diet supplemented with soy and corn and other additives. Grain-fed cows can also be given antibiotics and growth hormones to fatten them up more quickly. |
| Grass-fed beef | It is beef derived from cattle that have only been fed grass as feed. |
| Ham | It refers to the pork meat taken from the leg of a pig. |
| HoReCa | Hotels, Restaurants and Cafes |
| Independent Outlet | It refers to a foodservice establishment that operates with a single outlet or is structured as a small chain with no more than three locations. |
| Juice | It is a drink made from the extraction or pressing of the natural liquid contained in fruit and vegetables. |
| Latin American | It includes full-service offerings in restaurants that serve cuisines from cultures such as Mexican, Brazilian, Argentinian, Colombian, etc. |
| Latte | It is a milk-based coffee that is made up of one or two shots of espresso, steamed milk, and a thin layer of frothed milk. |
| Leisure | It refers to foodservice offered as a part of a recreation business, such as sports arenas, zoos, movie theaters, and museums. |
| Lodging | It refers to foodservice offerings at hotels, motels, guesthouses, holiday homes, etc. |
| Macchiato | It is an espresso coffee drink with a small amount of milk, usually foamed. |
| Meat-based cuisines | This inlcudes food items like fried chicken, steak, ribs, etc. where meat is the primary ingredient for the dish. |
| Middle Eastern cuisine | It includes full-service offerings in restaurants that serve cuisines from cultures such as Arabic, Lebanese, Iranian, Israeli, etc. |
| Mocktail | It is an non-alcoholic mixed drink. |
| Mortadella | It is a large Italian sausage or luncheon meat made of finely hashed or ground heat-cured pork, which incorporates at least 15% small cubes of pork fat. |
| North American | It includes full-service offerings in restaurants that serve cuisines from cultures such as American, Canadian, Caribbean, etc. |
| Pastrami | It refers to a highly seasoned smoked beef, typically served in thin slices. |
| PDO | Protected Designation of Origin: It is the name of a geographical region or specific area that is recognized by official rules to produce certain foods with special characteristics related to location. |
| Pepperoni | It is an American variety of spicy salami made from cured meat. |
| Pizza | It is a dish made typically of flattened bread dough spread with a savory mixture usually including tomatoes and cheese and often other toppings and baked. |
| Primal cuts | It refers to the major sections of the carcass. |
| Quick service restaurant | It refers to a foodservice establishment that provides customers convenience, speed, and food offerings at lower prices. Customers usually help themselves and carry their own food to their tables. |
| Retail | It refers to a foodservice outlet inside a mall. shopping complex or a commercial real estate building, where there are other businesses operating as well. |
| Salami | It is a cured sausage consisting of fermented and air-dried meat. |
| Saturated fat | It is a type of fat in which the fatty acid chains have all single bonds. It is generally considered unhealthy. |
| Sausage | It is a meat product made of finely chopped and seasoned meat, which may be fresh, smoked, or pickled and which is then usually stuffed into a casing. |
| Scallop | It is an edible shellfish that is a mollusk with a ribbed shell in two parts. |
| Seitan | It is a plant-based meat substitute made out of wheat gluten. |
| Self-service kiosk | It refers to a self-order point-of-sale (POS) system through which customers place and pay for their own orders at kiosks, enabling totally contactless and frictionless service. |
| Smoothie | It is a beverage made by placing all the ingredients in a container and processing them together, without removing the pulp. |
| Specialty coffee & tea shops | It refers to a foodservice establishment that serves only various types of tea or coffee. |
| Standalone | It refers to a restaurants that have an independent infrastructure setup and not connected to any other business. |
| Sushi | It is a Japanese dish of prepared vinegared rice, usually with some sugar and salt, accompanied by a variety of ingredients, such as seafood—often raw—and vegetables. |
| Travel | It refers to foodservice offerings such as airplane food, dining on long-distance trains, and foodservice on cruise ships. |
| Virtual Kitchen | It refers to a cloud kitchen. |
| Wagyu Beef | It is beef derived from any of four strains of a breed of black or red Japanese cattle that are valued for their highly marbled meat. |


Research Methodology
Mordor Intelligence follows a four-step methodology in all our reports.
- Step-1: Identify Key Variables: In order to build a robust forecasting methodology, the variables and factors identified in Step 1 are tested against available historical market numbers. Through an iterative process, the variables required for the market forecast are set, and the model is built on the basis of these variables.
- Step-2: Build a Market Model: Market size estimations for the forecast years are in nominal terms. Inflation is considered for average order value, and it is forecasted as per predicted inflation rates in the countries.
- Step-3: Validate and Finalize: In this important step, all market numbers, variables, and analyst calls are validated through an extensive network of primary research experts from the market studied. The respondents are selected across levels and functions to generate a holistic picture of the market studied.
- Step-4: Research Outputs: Syndicated Reports, Custom Consulting Assignments, Databases & Subscription Platforms


