
Quick-Service Restaurant (QSR) Market Size and Share
Quick-Service Restaurant (QSR) Market Analysis by Mordor Intelligence
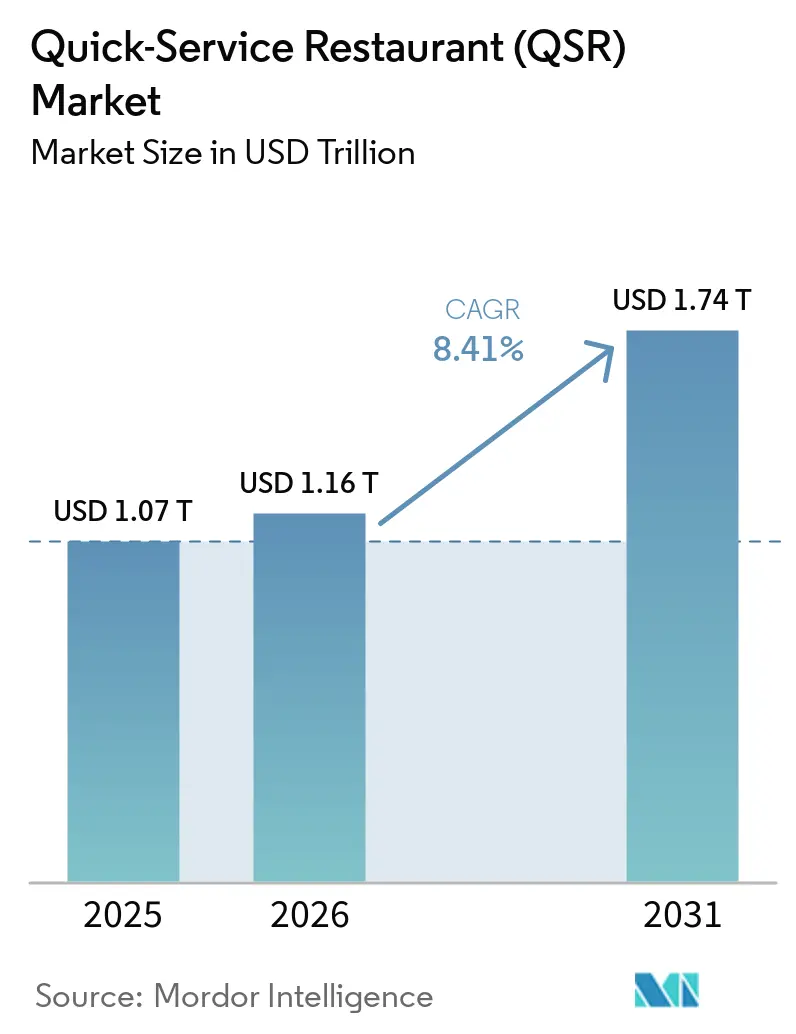
The quick-service restaurant (QSR) market size is projected to expand from USD 1.16 trillion in 2026 and USD 1.26 trillion in 2027 to USD 1.87 trillion by 2032, registering a CAGR of 8.18% between 2027 and 2032.
Drive-thru formats and digital ordering widen access to prepared meals for United States diners. Urban concentration creates potential customer pools, while demand for speed and affordability favors convenient meal service. Operators can pursue repeat orders through loyalty programs while extending their restaurant networks. Service-speed improvements carry staffing commitments, and delivery aggregators can pressure growth for pizza delivery and carryout operators. Pairing drive-thru access with digital ordering can broaden sales opportunities, but California wage increases raise the cost of converting that reach into profitable restaurant growth.
Key Report Takeaways
- By cuisine, meat-based cuisine led with a 36.95% quick-service restaurant (QSR) market share in 2026, while pizza/pasta is forecast to be the fastest-growing segment at a CAGR of 10.05% between 2027 and 2032.
- Within restaurant structure, chained/franchised outlets held a 51.96% share of the quick-service restaurant (QSR) market size in 2026, and independent outlets are forecast to grow fastest at a CAGR of 9.05% between 2027 and 2032.
- Service-model spending was led by dine-in with a 28.93% share in 2026, whereas home delivery (first- and third-party) is forecast to be the fastest-growing segment at a CAGR of 10.3% between 2027 and 2032.
- Across geographies, North America held the largest share at 32.24% in 2026, while Asia-Pacific is forecast to grow fastest at a CAGR of 10.2% between 2027 and 2032.
Note: Market numbers in this report are based on Mordor Intelligence's proprietary estimation framework, which combines nine months of actuals with Q4 projections for base year 2026.
Market Trends and Insights
Drivers Impact Analysis of Quick-Service Restaurant (QSR) Market*
| Driver | (~) % Impact on CAGR Forecast | Geographic Relevance | Impact Timeline |
|---|---|---|---|
| Expansion of drive-thru and off-premise channels | +3% | United States, Brazil, Mexico and the Caribbean | Medium term (2-4 years) |
| Rapid urbanization and busy lifestyle accelerating quick-service restaurants | +2.5% | United States and Canada | Long term (≥ 4 years) |
| Digital loyalty and subscription programs boosting repeat visits | +2% | France, Australia and Singapore | Short term (≤ 2 years) |
| Expansion of delivery and digital ordering | +2.3% | Across the United States | Short term (≤ 2 years) |
| Tech integration and automation | +1.1% | United States, Canada, France, Germany and Australia | Medium term (2-4 years) |
| Rising tourism and out-of-home dining | +0.8% | United States domestic destinations | Short term (≤ 2 years) |
| Source: Mordor Intelligence | |||
Expansion of drive-thru and off-premise channels
Off-premise expansion allows restaurant demand to extend beyond the capacity and availability of dining-room seating. Arcos Dorados reported systemwide drive-thru sales growth of 19.5% between 2021 and 2025 across its 21 Latin American and Caribbean countries and territories. That system comprises McDonald's-branded restaurants operated by Arcos Dorados or its sub-franchisees. In the broader U.S. limited-service segment, including quick-service, fast-casual, and coffee-and-snack concepts, Technomic's estimated off-premises share of customer traffic rose from 74.1% in 2019 to 89.9% in 2025. Arcos Dorados tied its drive-thru performance partly to its free-standing restaurant portfolio, indicating that site format can shape which operators benefit from off-premises demand.
Rapid urbanization and busy lifestyle accelerating quick-service restaurants
Urban concentration enlarges the potential catchment for nearby quick-service meals, while time-sensitive diners give operators a reason to simplify service. Using its Degree of Urbanization city definition, UN DESA estimated that cities housed 45% of the world's 8.2 billion people in 2025, compared with 20% in 1950. In Leger's May 2025 online panel survey of 1,626 Canadian adults for Square, 35% of QSR visitors cited fast service as the top visit driver, compared with 33% for affordability and 28% for taste. Speed therefore addresses a meal-selection need, but affordability's similar level of stated importance makes price part of the same convenience proposition. Ipsos' August 2026 study found 74% of 1,700 U.S. respondents aged 18 to 75 who visited a QSR in the prior 30 days had used a restaurant app to order ahead. Advance ordering therefore offers a way to pursue valued time savings before arrival.
Digital loyalty and subscription programs boosting repeat visits
Loyalty programs offer a way to compete for the customer's next meal rather than treating each visit as an isolated transaction. McDonald's reported nearly 210 million 90-day active loyalty users across 70 markets in 2025. Systemwide sales to loyalty members nearly doubled from 2023 to 2025, while the program's coverage expanded from 50 to 70 markets. McDonald's also reported that average U.S. customers visited 26 times in the 12 months after joining its loyalty program, compared with 10.5 times in the 12 months before joining. This before-and-after pattern makes repeat meal occasions a more direct indicator of loyalty-related demand than the program's geographic reach.
Expansion of delivery and digital ordering
Digital ordering makes access to the restaurant part of the meal proposition, extending demand beyond a customer's immediate proximity to the counter. Domino's generated more than 85% of its U.S. retail sales through digital channels in 2025.[1] Ipsos' August 2026 study surveyed 1,700 U.S. consumers aged 18 to 75 who had visited a QSR in the prior 30 days. Those consumers ranked order accuracy, food quality comparable to in-store purchases, and correct food temperature as their top mobile-ordering priorities. For Domino's, digital ordering therefore creates a commercial opening that depends on delivering the meal correctly, because remote access alone does not meet those leading buyer expectations.
Restraints Impact Analysis of Quick-Service Restaurant (QSR) Market*
| Restraint | (~) % Impact on CAGR Forecast | Geographic Relevance | Impact Timeline |
|---|---|---|---|
| Rising competition from fast-casual and food delivery services | -1.5% | Across the United States | Short term (≤ 2 years) |
| Labor-cost inflation in high-wage markets compressing margins | -1.2% | Fast-food restaurant locations in California | Short term (≤ 2 years) |
| Rising obesity and chronic diseases | -0.5% | Across the United States | Long term (≥ 4 years) |
| Intense market competition | -0.4% | Restaurant locations across Australia | Medium term (2-4 years) |
| Source: Mordor Intelligence | |||
Rising competition from fast-casual and food delivery services
Competition over meal delivery can constrain a restaurant brand even when customers continue ordering prepared food. Domino's FY2025 annual report said competition from delivery aggregators and other food-delivery services had substantially increased and could pressure growth and market share. The franchisor's disclosure covered competition for customers and drivers within its delivery and carryout business. This creates a commercial constraint because a restaurant must compete both to win an order and to secure the capacity needed to complete it. Domino's described pressure to grow simply to maintain market share, so expanding delivery can become a defense of existing demand before it offers pizza operators an avenue to additional profit.
Labor-cost inflation in high-wage markets compressing margins
Higher wage rates raise the labor-cost floor even when operators improve efficiency. Chipotle reported labor costs of 25.1% of total revenue in 2025, compared with 24.7% in 2024. It attributed the increase primarily to lower sales volumes and wage inflation, partly offset by menu price increases. Its company-wide, non-GAAP restaurant-level operating margin also fell to 25.4% in 2025 from 26.7% in 2024.[2] El Pollo Loco reported fiscal 2025 wage-cost increases of USD 3.4 million tied to California minimum-wage increases, partly offset by USD 5 million in labor-efficiency savings, while labor expense rose USD 0.1 million. Wage-rule exposure can require efficiency gains simply to contain staffing expense, leaving operators less room to absorb weaker restaurant sales.
*Our forecasts treat driver/restraint impacts as directional, not additive. The impact forecasts reflect baseline growth, mix effects, and variable interactions.
Quick-Service Restaurant (QSR) Market Segment Analysis
By Cuisine:
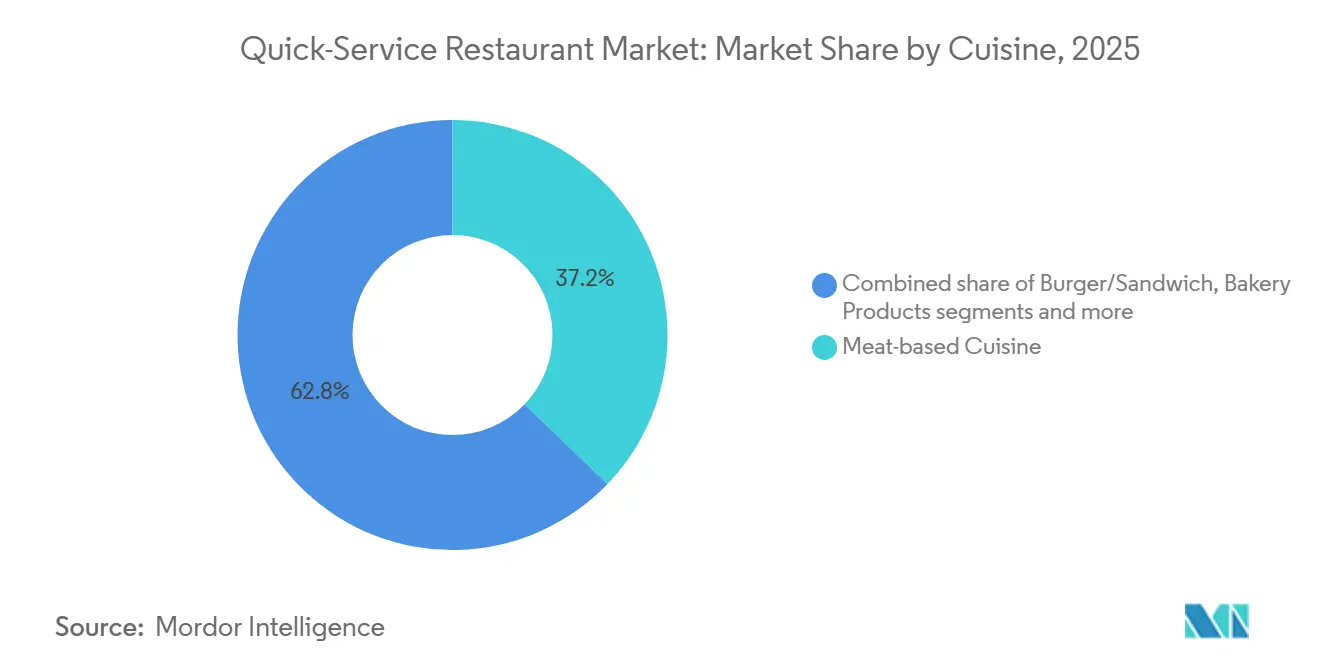
Chicken Sales Density and Pizza ExpansionMeat-based cuisine accounted for a 36.95% share of the quick-service restaurant (QSR) market size in 2026. Chicken-focused Chick-fil-A recorded a USD 7.2 million average unit volume across its U.S. restaurants in 2025, according to Circana. Substantial sales at a focused restaurant concept illustrate the largest segment's commercial weight, making outlet productivity a useful lens alongside network size. Scaling a meat-focused network depends on reproducing unit productivity, since a new restaurant must establish its own meal demand to approach an existing concept's sales density.
Pizza/pasta is the fastest-growing segment, with a forecast CAGR of 10.05% between 2027 and 2032. Jubilant FoodWorks reported 88 Domino's India store additions in the quarter ended September 30, 2026, taking the network to 2,601, in a provisional update subject to limited review by its statutory auditors. For pizza operators in India, the added locations can bring ordering and fulfillment closer to customers beyond existing restaurants' reach. Mexican cuisine's U.S. limited-service purchase frequency rose 4% year over year in 2025, while units per trip fell 1% and spending per unit rose 5%, across quick-service and fast-casual formats. Among Mexican concepts within other cuisines, more frequent purchases coincided with higher spending per item and fewer items per trip.



By Structure:
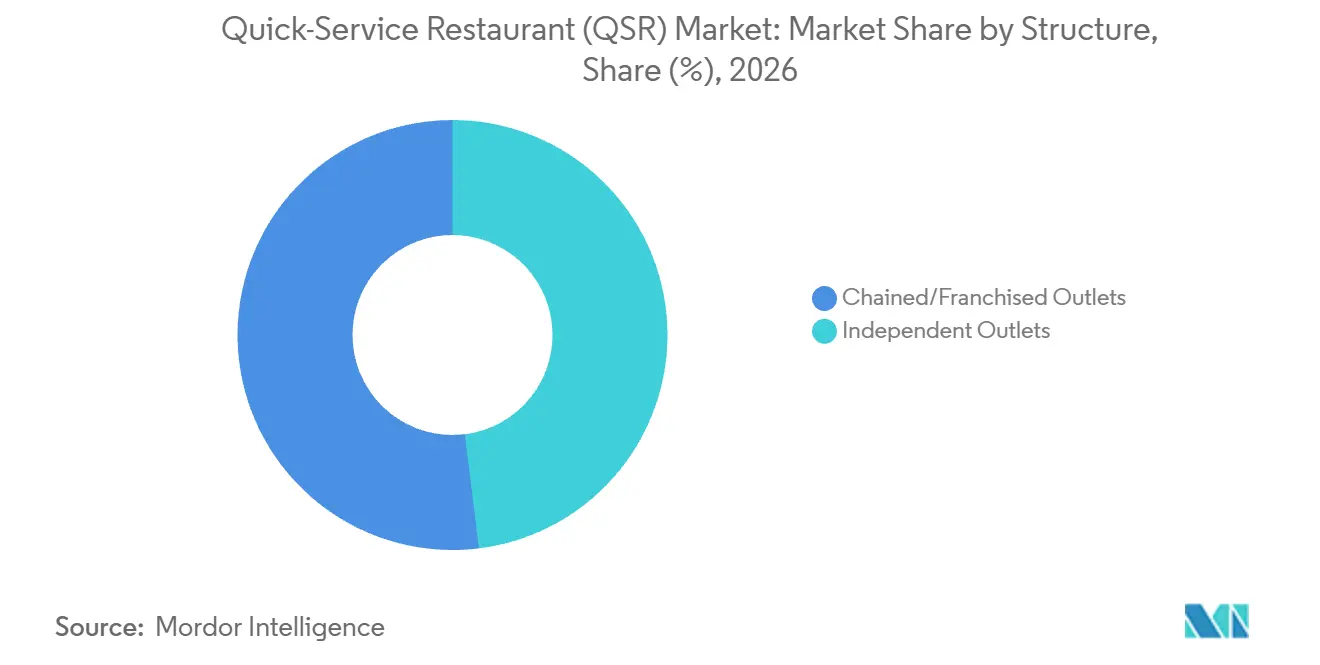
Franchise Reach and Owner-Led ExpansionChained/franchised outlets represented a 51.96% quick-service restaurant (QSR) market share in 2026. McDonald's Corporation reported 45,356 systemwide restaurants at year-end 2025, approximately 95% of which were franchised. The largest segment's operating model allows a common restaurant brand to reach customers through many separately operated businesses, extending its presence beyond the parent company's directly operated estate. Further franchised expansion depends on operators' capacity to fund and develop restaurants, so the parent's own development resources alone do not determine the network's reach.
Independent outlets are forecast to be the fastest-growing segment, with a CAGR of 9.05% between 2027 and 2032. Family-run fast-casual operator Hapa Food Co., owned by Michael and Leslie Zander, opened its second location in North Phoenix on July 8, 2025, after larger-than-anticipated crowds at its Mesa restaurant. More seating was an important part of Hapa's expansion, linking this second site to a capacity need observed by the owners at their original restaurant.

By Service Model:
Dining Capacity and Delivery PrioritiesDine-in was the largest segment, accounting for 28.93% of global quick-service restaurant spending in 2026. McDonald's franchisee Jan Frissen opened a restaurant in Massenhoven, Belgium, on October 16, 2025, with 214 indoor seats and 56 terrace seats. The same site pairs that seating with a double drive-thru. This combination shows how a restaurant can retain substantial dine-in capacity while also serving vehicle-based orders in a single development.
Home delivery (first- and third-party) is the fastest-growing segment, with a forecast CAGR of 10.3% between 2027 and 2032. Yum China reported that KFC's delivery sales in China grew 26% year over year in Q2 2026 and contributed approximately 54% of KFC company sales, up from 45% in Q2 2025. Take-away was the top off-premises channel for 25% of surveyed U.S. limited-service operators reporting stronger off-premises business in 2025, across quick-service, fast-casual, and coffee-and-snack concepts. KFC China's approximately 9-percentage-point shift put delivery above half of its company sales within a year, so off-site fulfillment was central to this brand's sales mix.
Geography Analysis
North America Quick-Service Restaurant (QSR) Market
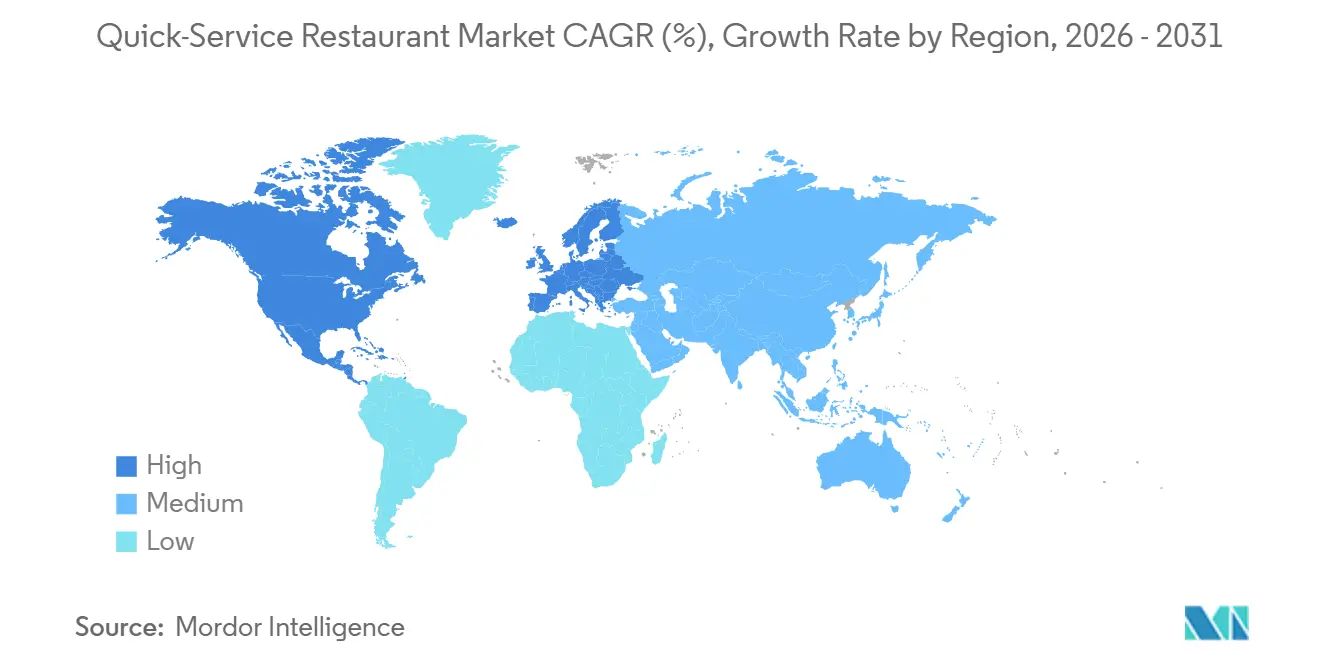
North America held a 32.24% quick-service restaurant (QSR) market share in 2026, making it the largest geography. U.S. limited-service establishments recorded inflation-adjusted food sales of USD 516.1 billion in 2025, compared with USD 273.8 billion in 1997, an 88.5% increase across that period. USDA defines limited-service outlets as establishments where customers generally order and pay before eating, with meals consumed on premises, taken out, or delivered. This established spending base gives restaurant operators substantial meal demand to address, while the ordering model makes convenient access part of their ability to convert that demand into sales.
Asia-Pacific Quick-Service Restaurant (QSR) Market
Asia-Pacific is the fastest-growing geography, with a forecast CAGR of 10.2% between 2027 and 2032. Yum China Holdings' same-store transactions in China grew 5% year over year in Q2 2026, its 14th consecutive quarter of growth. It opened 560 net new stores in China that quarter, 67% more than in Q2 2025, with 41% of net new stores opened by franchisees. Franchisees operated 18% of its 19,297-store network at June 30, 2026. Franchisees' larger contribution to new openings than to the installed estate gives their development capability a disproportionate role in that quarter's expansion.
In Europe, KFC opened a digital-first flagship near Rome's Trevi Fountain in October 2025. The Rome flagship's restaurant environment and specialty drinks illustrate a format-led approach to serving that European urban location. In South America, Pluxee and Abrasel reported Wednesday's 21.54% share of measured food-away-from-home consumption volume in Brazil in 2025. In the Middle East and Africa, Americana Restaurants opened 4 Pizza Hut restaurants across Dubai, Sharjah, Ajman, and Fujairah in the United Arab Emirates in 2025. For restaurants serving these Brazilian meal occasions, allocating the same staffing and replenishment capacity to every weekday would overlook the measured concentration of demand on Wednesday.
Regulatory Framework and Outlook
The comparison covers selected jurisdictions from the perspective of a multilocation quick-service restaurant operator implementing repeatable menus and outlet processes. Licensing, hygiene procedures, and menu information create different implementation tasks, making regulatory fit depend on which capabilities the operator can reproduce across locations. The U.S. federal menu rule covers chains with 20 or more same-name locations offering substantially similar menu items, plus voluntary registrants. Germany's framework requires hygiene compliance and permanent procedures based on hazard analysis and critical control points (HACCP).
Regulatory Table of Quick-Service Restaurant (QSR) Market
| Decision factor | United States | Germany | China | Brazil | Saudi Arabia |
|---|---|---|---|---|---|
| Primary authority | Food and Drug Administration (FDA) | Länder-designated state and local authorities | State Administration for Market Regulation (SAMR) and local market-regulation departments | State/municipal health-surveillance bodies for licensing and inspection | Saudi Food and Drug Authority (SFDA) |
| Key instruments or direction | 21 CFR 101.11 menu labeling | Regulation (EC) No 852/2004 hygiene and establishment registration; EU take-away refill/reuse duties | Food Safety Law licensing; Order 123 effective June 1, 2026, replacing the 2017 online-catering measure | RDC 216/2004 review listed in the 2026-2027 regulatory agenda | SFDA menu disclosures effective July 1, 2025 |
| Commercial effect | Calories on standard-item menus and menu boards; specified written nutrition information on request | Own-container system by February 12, 2027; reusable-packaging option by February 12, 2028 except qualifying micro-enterprises; point-of-sale notices | Online restaurant operators need licensed physical outlets, matching actual/licensed addresses, and operations within approved business scope | Local sanitary licensing and inspections shape outlet compliance | High-salt meal labels, beverage caffeine content, and estimated meal calorie-burn time on physical/online menus and ordering platforms |
| Current policy attractiveness | Medium | Medium | Medium | Medium | Medium |
| Future direction of policy attractiveness | No change | Hardening | No change | No change | No change |
| Source: Mordor Intelligence | |||||
U.S. calorie-disclosure routines provide a defined compliance baseline, while FDA's Human Foods Program said in January 2026 that its planned added-sugar strategy for 2026 would investigate menu-labeling requirements. Under the EU Packaging and Packaging Waste Regulation, HORECA takeaway distributors in Germany must let customers bring their own containers for hot or cold drinks and ready-prepared food from February 12, 2027, at no higher cost or less favorable terms than single-use packaging, and must offer reusable packaging within a reuse system by February 12, 2028, except qualifying micro-enterprises. China's licensed-premises rule and Brazil's local sanitary controls support continuity in operating requirements, alongside food-safety review work listed in their policy programs covering 2026. Saudi Arabia's established nutrition disclosures favor continuity in menu workflows, while coverage of physical and online channels makes centrally managed menu information commercially useful.
Value Chain Stages
The value chain compares brand-system formation, restaurant supply, and the preparation and sale of meals. McDonald's generally relies on independent suppliers for food, paper, and related restaurant items, with suppliers required to meet its standards and specifications. That separation makes supplier qualification and restaurant execution distinct capabilities, even when customers encounter a single brand at the point of sale.
Value Chain Analysis Table of Quick-Service Restaurant (QSR) Market
| Primary activity | Key participants | Value capture | Bottleneck | Resilience response |
|---|---|---|---|---|
| Brand-system formation and licensing | Franchisors and brand owners such as McDonald's Corporation and Restaurant Brands International | Franchise and license fees | Consistent execution across independently operated locations | Define operating requirements before network expansion |
| Food and related-product distribution | Foodservice distributors such as Sysco | Sales of food and related products | Maintaining restaurant specifications across supply alternatives | Qualify alternative suppliers against the same specifications |
| Meal preparation and restaurant sales | Restaurant operators such as McDonald's Corporation through its company-operated outlets | Prepared food and beverage sales | Preparation capacity within each restaurant | Align accepted orders with kitchen capacity |
| Source: Mordor Intelligence | ||||
Sysco estimated that restaurants represented 59% of its sales by customer type in fiscal 2026. Its customer mix shows how restaurants can anchor a global foodservice distributor that also serves healthcare, education, lodging, and entertainment customers. Distribution can capture value across multiple foodservice customer groups, whereas franchising scales its fee income through a branded restaurant system.
Competitive Landscape
Market Concentration
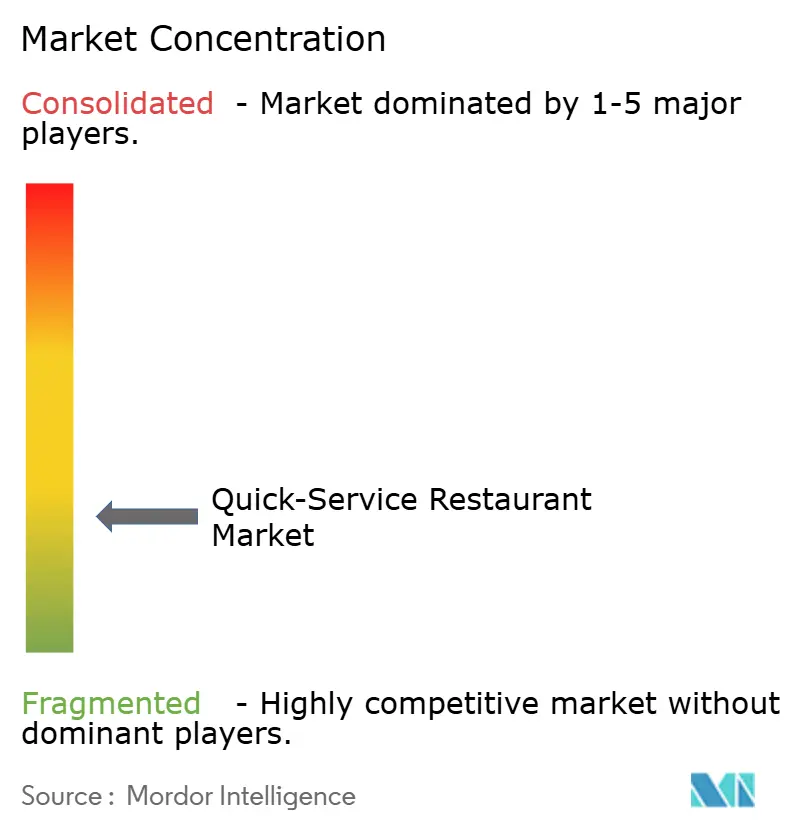
Competition combines large branded systems with substantial independent participation, creating a market with distributed restaurant ownership. Major competitors include McDonald's Corporation, Yum! Brands Inc. (KFC, Taco Bell, Pizza Hut), Restaurant Brands International (Burger King, Popeyes, Tim Hortons), Domino's Pizza Inc., and Starbucks Corporation. Yum! Brands said in its 2025 annual report that approximately 1,500 franchisees operated the majority of its more than 63,000 restaurants across 155 countries and territories. This structure puts the execution of a brand's proposition partly in franchise operators' hands, so coordination across independently managed restaurants is a competitive capability rather than a purely administrative function.
Domino's reported 3.2% global retail sales growth in Q3 2026, excluding foreign currency impact, across company-owned and franchised stores. It also recorded 175 net store additions, comprising 26 in the United States and 149 internationally. Same-store sales grew 0.3% in the United States and 0.2% internationally in Q3 2026, with the international figure excluding foreign currency impact. The added outlets widen Domino's physical reach, while the modest same-store gains leave growth at established restaurants as a separate competitive challenge.
U.S. menu-labeling duties under 21 CFR 101.11 provide a common compliance baseline for chains with 20 or more same-name locations offering substantially the same menu items, while service reliability can distinguish rivals. Starbucks launched Green Apron Service across North American company-operated stores in August 2025. It reported average peak service times below 4 minutes across café and drive-thru in the first quarter of fiscal 2026. Starbucks also tied the rollout to a USD 500 million staffing investment, including added support at peak. Starbucks' investment puts a staffing cost behind its service benchmark, so a challenger seeking comparable peak service must weigh additional labor alongside changes to order handling.
Quick-Service Restaurant (QSR) Industry Leaders
-
McDonald's Corporation
-
Yum! Brands Inc. (KFC, Taco Bell, Pizza Hut)
-
Restaurant Brands International (Burger King, Popeyes, Tim Hortons)
-
Domino's Pizza Inc.
-
Starbucks Corporation
- *Disclaimer: Major Players sorted in no particular order
Quick-Service Restaurant (QSR) Market Companies Covered in this Report
- McDonald's Corporation
- Yum! Brands Inc. (KFC, Taco Bell, Pizza Hut)
- Restaurant Brands International (Burger King, Popeyes, Tim Hortons)
- Domino's Pizza Inc.
- Starbucks Corporation
- The Wendy's Company
- Doctor's Associates LLC (Subway)
- Chick-fil-A Inc.
- Chipotle Mexican Grill Inc.
- Deep Blue Restaurants
- Panera Bread Company
- Papa John's International Inc.
- Shake Shack Inc.
- Jack in the Box Inc.
- Inspire Brands, Inc.
- Jollibee Foods Corporation
- Jubilant FoodWorks Ltd (Domino's India)
- Yoshinoya Holdings Co. Ltd.
- Little Caesar Enterprises Inc.
- Five Guys Enterprises, LLC
Key Opportunities for Market Participants
The opportunities compare packaging compliance for EU restaurant operators with platform integration for expanding company-operated chains. Since August 12, 2026, EU rules have barred food-contact packaging containing per- and polyfluoroalkyl substances (PFAS) above strict limits from the EU market.[3] Shake Shack announced Project Catalyst in April 2026 to scale digital, data, and operational platforms. The packaging restriction creates an immediate compliance task, while Shake Shack's announced program links integration work to its goal of 1,500 company-operated Shacks.
Market Opportunities Table of Quick-Service Restaurant (QSR) Market
| Opportunity | Why now | Buyer / lead segment | Recommended play | Main barrier | Likely beneficiaries |
|---|---|---|---|---|---|
| Compliant take-away packaging | Applicable limits on PFAS in food-contact packaging | QSR operators using affected EU packaging | Replace affected formats with compliant alternatives | Meeting limits while preserving the intended food-contact use | Compliant packaging suppliers and take-away operators |
| Chain-wide packaging qualification | Compliance decisions must translate into usable restaurant supplies | Multilocation QSR operators in the EU | Standardize qualification and replacement specifications across outlets | Consistent conformance across multiple packaging formats | Qualification specialists and restaurant supply coordinators |
| Coordinated restaurant platform implementation | Shake Shack's announced platform-scaling initiative | Expanding company-operated restaurant systems | Sequence integrations around committed point-of-sale and kitchen systems | Implementation, vendor performance, timing, and cost risks | Integration providers and restaurant operators |
| Source: Mordor Intelligence | |||||
Qu was already engaged for Shake Shack's point-of-sale and kitchen display systems when Project Catalyst was announced. That commitment makes adjacent integration support a more credible opening than assuming the core systems contract is available. Compliant packaging has a more immediate commercial basis than technology demand tied to a single announced program because it addresses an effective operating requirement.
Recent Industry Developments in Quick-Service Restaurant (QSR) Market
- Sep 2026: El Pollo Loco announced a planned New York entry, including a signed lease for a Queens restaurant targeted to open in mid-2027. The company agreed to terms for 3 development agreements covering 15 area restaurants over 5 years.
- Sep 2026: Five Guys opened its 2,000th restaurant worldwide at Universal CityWalk at Universal Orlando Resort in Florida.
- Sep 2026: McDonald's announced plans to deploy GenAI-enabled ArchIQ at scale across U.S. and international operated markets, targeting about 250 basis points of gross restaurant-level efficiency gains.
Quick-Service Restaurant (QSR) Market Report Scope and Research Methodology
Market Definition and Coverage
The quick-service restaurant (QSR) market measures annual consumer spending on prepared food and beverages sold by quick-service restaurant outlets worldwide. It covers independent and chained or franchised outlets across cuisine types and service models.
Scope exclusions: Full-service and casual-dining restaurant sales, prepared food and beverage sales by grocery and convenience stores, delivery platform fees and commissions, and separately sold food ingredients and supplies are excluded.
Segments Covered in This Report
- By Cuisine
- Burger/Sandwich
- Pizza/Pasta
- Meat-based Cuisine
- Seafood
- Ice-Cream/Dessert
- Bakery Products
- Other Cuisines (Mexican, Asian, etc.)
- By Structure
- Independent Outlets
- Chained/Franchised Outlets
- By Service Model
- Dine-In
- Drive-Thru
- Take-Away/Walk-Up Counter
- Home Delivery (First- and Third-Party)
- Curbside Pickup
- By Geography
- North America
- United States
- Canada
- Mexico
- Rest of North America
- Europe
- Germany
- United Kingdom
- Italy
- France
- Spain
- Netherlands
- Poland
- Belgium
- Sweden
- Rest of Europe
- Asia-Pacific
- China
- India
- Japan
- Australia
- Indonesia
- South Korea
- Thailand
- Singapore
- Rest of Asia-Pacific
- South America
- Brazil
- Argentina
- Colombia
- Chile
- Peru
- Rest of South America
- Middle East and Africa
- South Africa
- Saudi Arabia
- United Arab Emirates
- Nigeria
- Egypt
- Morocco
- Turkey
- Rest of Middle East and Africa
- North America
Data Sources, Market Sizing, and Validation
Desk Research
The United Nations Department of Economic and Social Affairs' World Urbanization Prospects provides comparable city, town, and rural population estimates and projections that help frame potential demand catchments. The USDA Economic Research Service's Food Expenditure Series distinguishes limited-service restaurant spending from other food-away-from-home outlets, while its Food Service Industry market-segments analysis supplies historical and seasonal sales indicators. The U.S. Census Bureau's Advance Monthly Retail Trade Survey provides a separate, regularly updated signal for food-service sales and changes in consumer spending.
Company annual filings and investor materials can clarify outlet counts, franchised versus company-operated structures, comparable-sales trends, channel mix, and operating costs, while reputable financial and trade press can help check dated openings, closures, and market events. These sources are illustrative and are not exhaustive. Further sources inform collection, validation and clarification.
Primary Interviews and Surveys
Interviews and structured surveys can include restaurant executives, franchise and independent operators, finance and strategy leaders, and managers responsible for operations, digital ordering, delivery, and menu planning across the global regions. Respondents can check secondary findings on sales channels, outlet structures, menu mix, regional conditions, and operating constraints, while targeted follow-up questions clarify conflicting or missing inputs. Analyst estimates can then be triangulated against public indicators and respondent explanations, with unresolved gaps treated through explicit ranges or scenario assumptions rather than invented observations.
Distribution of primary research fieldwork respondents
| Company type | Respondent position | Region |
|---|---|---|
| Top tier: 34% | CXOs: 20% | APAC: 38% |
| Mid tier: 42% | Functional/Unit leaders: 35% | EMEA: 28% |
| Smaller Players: 24% | Managers: 45% | Americas: 34% |
Market-Sizing & Forecasting
A top-down model estimates global annual restaurant sales in current U.S. dollars, then allocates the total across cuisine, outlet structure, service model, and geography using outlet revenues, segment sales indicators, and the observed mix of restaurant formats. Key inputs include limited-service food-service sales, outlet counts and openings, comparable-sales growth, average customer spend and menu-price changes, and the share of sales taken through dine-in, drive-thru, takeaway, and delivery. These indicators respectively anchor market scale, physical capacity, same-store demand, ticket value, and channel mix. Historical sales and outlet trends support a multivariate regression or scenario analysis, with price and changes in service mix considered separately when they affect nominal spending.
Segment shares are built from available sales splits and outlet or channel evidence, checked to the global total, and refined where comparable public data are available. Sampled outlet revenue and price-times-volume checks can test selected country and format estimates. Forecast variables are extended by geography and segment using documented trends, with alternative assumptions for restaurant expansion, spending per order, and channel mix where evidence is limited. Analysts can ask primary respondents to assess each major driver and forecast assumption, then reconcile their explanations with independent sales and outlet indicators. Conflicting inputs are flagged and carried as ranges or scenario cases until the evidence supports a central estimate.
Data Validation & Update Cycle
Analysts triangulate restaurant sales estimates with independent food-service spending, outlet growth, comparable-sales, and channel indicators, then check totals and segment shares for anomalies and unexplained year-to-year changes. A second review traces material variances to source definitions, periods, currency treatment, or market events, and analysts seek clarification from relevant respondents when a gap remains material or a source changes. The model is refreshed annually, updated between cycles when material events change the market outlook, and given a fresh source and calculation review before delivery.
Mordor Intelligence's Quick Service Restaurants Market Sizing Compared With Other Published Estimates
Published estimates can differ in the transactions and products they count and the inputs used to model demand. The quick-service restaurant (QSR) market measures annual consumer spending on prepared food and beverages sold by quick-service restaurant outlets worldwide.
Key Gap Drivers include the study's defined coverage and market-specific modeling choices. Key inputs include limited-service food-service sales, outlet counts and openings, comparable-sales growth, average customer spend and menu-price changes, and the share of sales taken through dine-in, drive-thru, takeaway, and delivery.
Benchmark comparison
| Source | Market Size | Gaps in Research Methodology |
|---|---|---|
| Mordor Intelligence | USD 1.26 T (2027) | |
| Global Consultancy A | USD 971 B (2025) | At its 2025 base, this estimate is 22.9% below this report's 2027 value of USD 1.26 T, 2 years later. Its published base is earlier, so intervening market growth contributes to the lower comparison. |
| Regional Consultancy B | USD 1.11 T (2026) | At its 2026 base, this estimate is 11.9% below this report's 2027 value of USD 1.26 T, 1 year later. Its stated growth rate is below this report's forecast rate, contributing to a lower forward estimate. |
Mordor Intelligence's analysts triangulate restaurant sales estimates with independent food-service spending, outlet growth, comparable-sales, and channel indicators, then check totals and segment shares for anomalies and unexplained year-to-year changes.
Key Questions Answered in the Report
What is the quick-service restaurant (QSR) market size and growth outlook?
The size is projected to rise from USD 1.26 trillion in 2027 to USD 1.87 trillion by 2032, at a CAGR of 8.18% between 2027 and 2032.
What supports repeat demand for quick-service meals?
Digital loyalty and convenient ordering create channels for maintaining customer relationships. McDonald's reported nearly 210 million 90-day active loyalty users across 70 markets in 2025.
Which cuisine leads quick-service restaurant spending?
Meat-based cuisine held 36.95% of spending in 2026, the largest share among cuisines.
Which companies are major quick-service competitors?
McDonald's Corporation, Yum! Brands Inc., Restaurant Brands International, Domino's Pizza Inc., and Starbucks Corporation are major competitors.
What constrains quick-service restaurant margins?
Labor costs are a key constraint. Chipotle's labor costs rose to 25.1% of total revenue in 2025 from 24.7% in 2024, primarily because of lower sales volumes and wage inflation, partly offset by menu price increases.
Which regions lead the quick-service sector?
North America led with 32.24% of spending in 2026. Asia-Pacific is forecast to be the fastest-growing region, at a CAGR of 10.2% between 2027 and 2032.