Automated Optical Inspection System Market Size and Share
Market Overview
| Study Period | 2020 - 2031 |
|---|---|
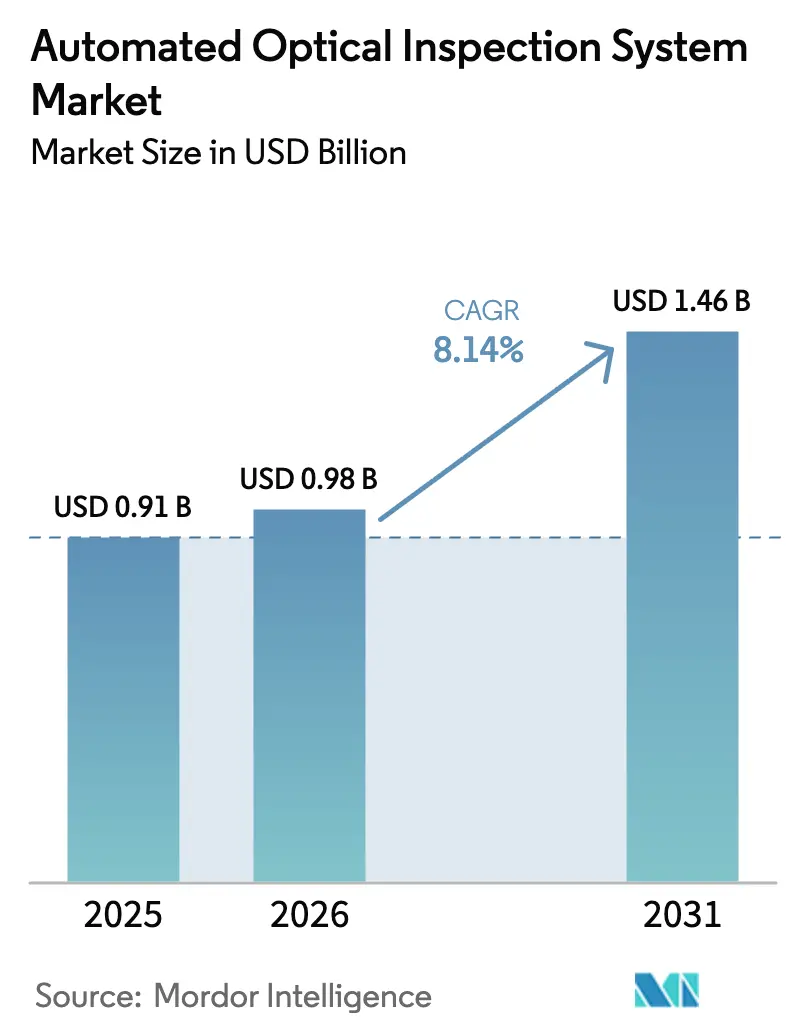
| Market Size (2026) | USD 0.98 Billion |
| Market Size (2031) | USD 1.46 Billion |
| Growth Rate (2026 - 2031) | 8.14% CAGR |
| Fastest Growing Market | Asia Pacific |
| Largest Market | Asia Pacific |
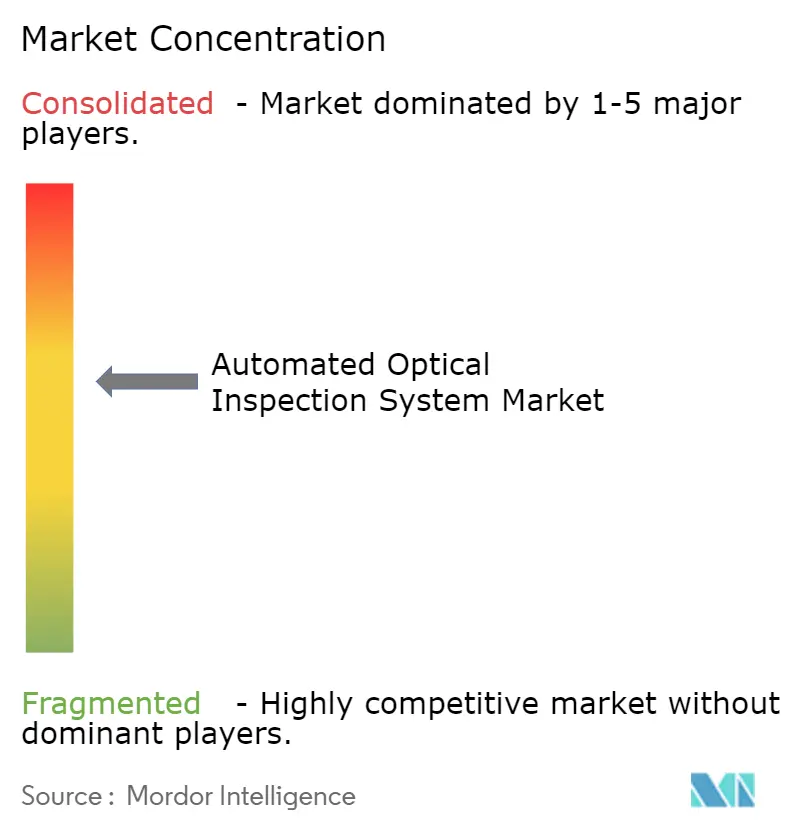
| Market Concentration | Medium |
Major Players*Disclaimer: Major Players sorted in no particular order Image © Mordor Intelligence. Reuse requires attribution under CC BY 4.0. |
|
Automated Optical Inspection System Market Analysis by Mordor Intelligence
The automated optical inspection system market size is expected to grow from USD 0.91 billion in 2025 to USD 0.98 billion in 2026 and is forecast to reach USD 1.46 billion by 2031 at 8.14% CAGR over 2026-2031. Rising demand for micron-level quality checks across surface-mount lines and semiconductor back-end processes anchors this expansion. Manufacturers now connect inspection data to factory analytics, shifting from reactive to predictive defect control that lifts first-pass yields and trims scrap. Component miniaturization in 5G handsets and high-layer server boards intensifies the need for multi-angle 3D inspection that evaluates height, coplanarity and void content in one pass. Reshoring incentives in the United States and India further swell capital outlays for advanced inline tools, while ISO-26262 compliance drives automotive plants toward zero-defect standards. Competition, meanwhile, pivots from hardware to AI-based software modules that slash false calls and shorten program cycles.
Key Report Takeaways
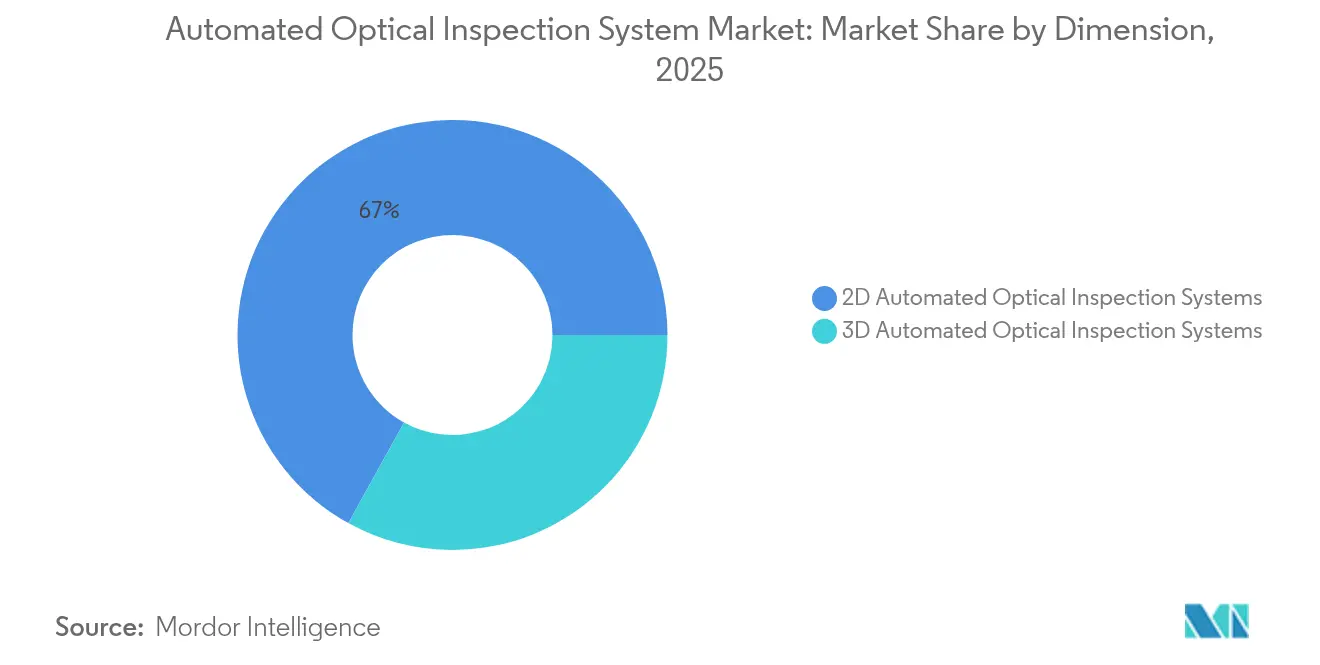
- By dimension, 2D platforms led with 66.95% automated optical inspection system market share in 2025; 3D systems are projected to expand at a 8.92% CAGR through 2031.
- By technology deployment, inline units held 68.35% of the automated optical inspection system market in 2025, and hybrid smart-factory configurations around these units are growing at 10.88% CAGR.
- By production stage, post-reflow solutions accounted for a 54.10% share of the automated optical inspection system market size in 2025, while solder-paste inspection is advancing at 9.56% CAGR to 2031.
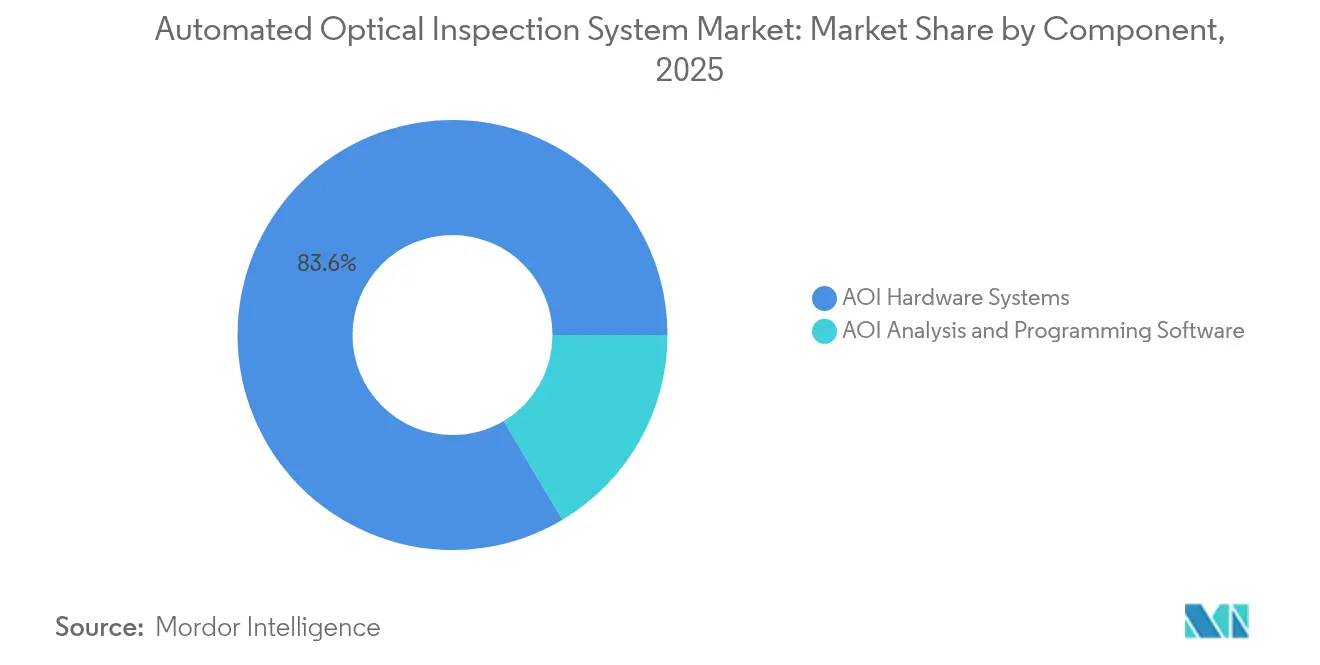
- By component, hardware systems dominated with an 83.55% revenue share in 2025; software is the fastest-growing slice at 11.05% CAGR on rising demand for AI algorithms.
- By industry vertical, IT & Telecom captured 56.90% of the automated optical inspection system market in 2025, whereas automotive electronics posts the highest growth at 8.52% CAGR.
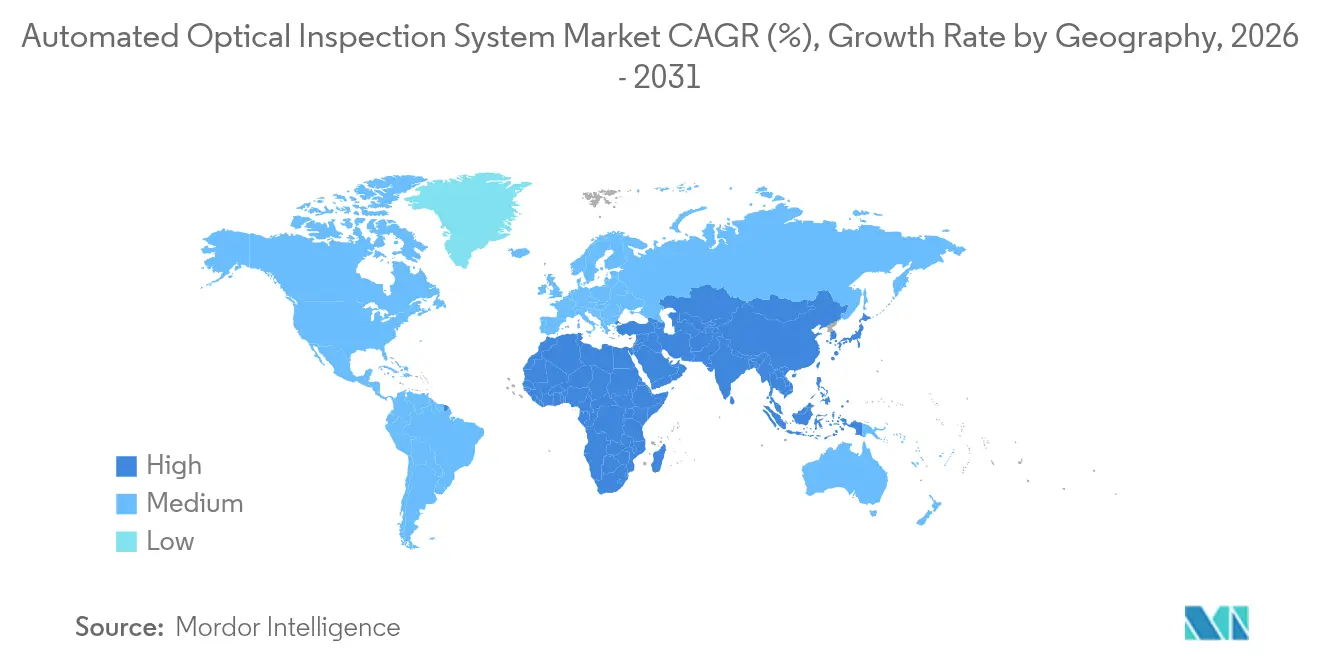
- By geography, Asia Pacific commanded 44.95% revenue in 2025 and is forecast to grow at 8.74% CAGR to 2031.
Note: Market size and forecast figures in this report are generated using Mordor Intelligence’s proprietary estimation framework, updated with the latest available data and insights as of 2026.
Market Trends and Insights
Drivers Impact Analysis of Automated Optical Inspection System Market*
| Driver | (~) % Impact on CAGR Forecast | Geographic Relevance | Impact Timeline |
|---|---|---|---|
| Advanced packaging & miniaturized PCBs | +2.1% | East Asia, Southeast Asia | Medium term (2-4 years) |
| EV power-electronics lines demanding zero-defect solder joints | +1.8% | North America, Europe | Medium term (2-4 years) |
| ISO-26262-driven 3D adoption at German Tier-1s | +1.5% | Europe, global | Long term (≥ 4 years) |
| AI predictive upgrades for legacy SMT lines | +1.3% | East Asia, global | Short term (≤ 2 years) |
| US & India semiconductor-reshoring incentives | +1.0% | North America, South Asia | Medium term (2-4 years) |
| MES-led inline refresh cycles in South Korea | +0.7% | East Asia, North America | Short term (≤ 2 years) |
| Source: Mordor Intelligence | |||
Proliferation of Advanced Packaging & Miniaturized PCBs
Component densities on smartphone boards have risen 35% since 2024, rendering legacy 2D inspection inadequate for pitches below 0.3 mm. Fan-out wafer-level and SiP designs push manufacturers toward multi-projection 3D systems that survey stacked-die interfaces at 80 cm²/s line rates.[1]IEEE Electronics Packaging Society, “75th Electronic Components and Technology Conference Program,” ieee.orgPremium optics with 25 MP sensors command 40-60% price premiums, yet secure orders because they halve rework versus baseline models. East-Asian vendors embed AI classifiers to auto-adjust lighting, creating a performance gap that stratifies the automated optical inspection system market into high-end and budget tiers.
EV Power-Electronics Demanding Zero-Defect Solder Joints
In 800 V battery packs, solder joint reliability is a safety metric. North American and European plants now mandate 100% inline 3D checks that spot micro-cracks and voids in under a second per joint.[2]Stellantis, “First Half 2024 Results,” stellantis.comSpecialized systems that overlay thermal imaging with optical data earn 25-30% higher margins and fuel the automated optical inspection system market as automotive electronics climbs 8.9% CAGR.
ISO-26262 Driving 3D AOI Penetration
The standard requires traceable inspection for ASIL components. German Tier-1s raised AOI capital spending 35% since 2024, selecting machines that log every height map and link to compliance databases.[3]International Organization for Standardization, “ISO 26262 Road Vehicles—Functional Safety,” iso.orgSoftware that aligns defect codes with FMEA frameworks opens new service revenue, heightening barriers for low-cost entrants.
AI-Enabled Predictive Analytics for Legacy SMT Lines
Japanese factories retrofit neural-network modules onto existing cameras, cutting false calls 40% and lifting real defect catch 25-30%.[4]OMRON Automation. "OMRON Automation to Showcase Latest AI-Driven AOI Technology at IPC APEX 2025." omron,comAOI vendors now market plug-in AI packs that deliver sub-12-month payback, carving a 15-20% growth pocket within the automated optical inspection system market.
Restraints Impact Analysis of Automated Optical Inspection System Market*
| Restraint | (~) % Impact on CAGR Forecast | Geographic Relevance | Impact Timeline |
|---|---|---|---|
| Shortage of skilled AOI programmers | -1.2% | Southeast Asia | Medium term (2-4 years) |
| High false-call rates on multilayer boards | -0.9% | Europe | Short term (≤ 2 years) |
| Capital-ex squeeze at Tier-2 ODMs | -0.7% | East Asia, global | Short term (≤ 2 years) |
| IP-security limits on cloud AOI | -0.5% | North America, Middle East | Long term (≥ 4 years) |
| Source: Mordor Intelligence | |||
Skilled Engineer Shortage Constraining Implementation
ASEAN EMS hubs face six-month backlogs because 65% of plants lack AOI programmers; salary premiums hit 50% above industry norms. Self-programming machines reduce setup time but cost 25-35% more, tempering automated optical inspection system market adoption until training pipelines expand.
False-Call Rates Undermining European ROI
Multilayer boards in European high-mix shops show 30% false positives, adding 45-60 s operator verification per board. Hybrid optical–X-ray stations lower mis-flags but raise cap-ex, prompting software suppliers to release algorithms that trim errors 15-20%.
*Our forecasts treat driver/restraint impacts as directional, not additive. The impact forecasts reflect baseline growth, mix effects, and variable interactions.
Automated Optical Inspection System Market Segment Analysis
By Dimension:
3D Systems Redefine Defect Capture2D platforms held 66.95% share in 2025, illustrating their cost edge in straightforward assemblies. Yet 3D tools are expanding at 8.92% CAGR-faster than the automated optical inspection system market-because they measure coplanarity and volume in a single scan. Recent sensors resolve 5 µm features, and MRS optics remove glare on BGAs and QFNs. As hardware prices have fallen 20% since 2024, 3D is becoming the default for new lines.
Height-mapping also feeds predictive analytics engines, giving process engineers data to adjust stencil pressure or reflow curves. While 2D remains viable for post-reflow sampling, the automated optical inspection system market size for 3D platforms is projected to exceed USD 0.51 billion by 2031, fueled by automotive and advanced packaging orders.


By Technology Deployment:
Inline Integration Accelerates YieldInline systems accounted for 68.35% of the automated optical inspection system market in 2025 and clock the highest growth at 10.88% CAGR. Positioned directly after placement or reflow, they feed MES dashboards in milliseconds, letting operators halt drift before defects cascade. Parallel imaging engines now match 100,000 CPH pick-and-place speeds, erasing prior bottlenecks.
Offline machines still serve high-mix, low-volume plants where flexibility trumps raw speed. Hybrid setups-inline for critical steps, offline for sample-based debug-gain favor, pushing vendors to deliver seamless data hand-offs. This evolution cements inline architecture as the backbone of the automated optical inspection system market.
By Production Stage:
SPI Gains MomentumPost-reflow inspection dominated with 54.10% revenue in 2025 because it verifies complete assemblies. Yet solder-paste inspection is rising 9.56% CAGR as firms realize early error catch saves rework.
AI-enhanced SPI links paste-volume metrics to joint-failure prediction, embedding preventive logic into process contro. As predictive adoption widens, the automated optical inspection system market anticipates SPI revenues to narrow the gap with post-reflow lines by 2031.
By Component:
Software Emerges as Growth DriverHardware still commands 83.55% revenue, reflecting capital intensity. However, software subscriptions expand 11.05% CAGR as plants license cloud analytics that refine thresholds and share models across sites.
Vendor-agnostic platforms overlay AI on multiple camera brands, unbundling the traditional hardware-centric value chain. This pivot underscores the automated optical inspection system industry shift toward algorithmic value.
By Industry Vertical:
IT and Telecom Retains Scale, Automotive AcceleratesIT and Telecom secured 56.90% of 2025 revenue due to relentless 5G rollout and data-center refresh cycles demanding zero downtime. Conversely, automotive electronics logs the fastest 8.52% CAGR as EV powertrains and ADAS triple board counts per vehicle.
Consumer electronics remains price-pressured, whereas aerospace & defense and medical devices pursue specialized AOI with security and traceability, sustaining premium pricing in the automated optical inspection system market.
Geography Analysis
APAC Automated Optical Inspection System Market
Asia Pacific led with 44.95% revenue in 2025 and is tracking 8.74% CAGR, underpinned by colossal SMT capacity in China, Taiwan, South Korea and Japan. National smart-factory subsidies embed AOI into every new line, while local champions such as ViTrox and Pemtron undercut global pricing, amplifying automated optical inspection system market adoption. South Korea’s MES rollouts spur inline refreshes, and Japan’s AI retrofits extend life cycles of installed bases.
North America, EMEA, LATAM and India Automated Optical Inspection System Market
North America ranks second, buoyed by CHIPS-Act fabs and EV assembly. Buyers favor premium AI-ready AOI with compliance logging for automotive PPAP and AS9100 audits. Europe concentrates on high-mix manufacturing; German Tier-1s deploy ISO-26262-compliant 3D units, but false-call concerns and capital constraints temper pace elsewhere. Latin America and Middle East & Africa remain niches yet grow as Mexico and Brazil add automotive electronics lines and Gulf defense contractors demand secure inspection gear. India’s semiconductor incentives accelerate new SMT deployments, injecting fresh automated optical inspection system market size through 2031.

Competitive Landscape
The automated optical inspection system market is moderately concentrated; Omron, Koh Young, Test Research Inc., KLA and Cognex together hold 45%. Incumbents couple optical, X-ray and solder-paste modules under unified software, locking in lifecycle service revenue. Asian challengers led by ViTrox and Mirtec leverage faster iteration and aggressive pricing to court contract manufacturers, squeezing margins.
Competition shifts toward AI. Recent releases claim 90% program-time cuts and 40% false-call drops. Start-ups sell cloud analytics overlaying mixed hardware fleets, disaggregating traditional bundles. CyberOptics’ proprietary MRS sensor propelled 59% growth in its WaferSense line, proving that differentiated optics still drive outsized gains. Strategic vertical integration toward laser and X-ray units positions full-suite vendors to secure bigger wallet share as factories standardize on single-source inspection ecosystems.
Automated Optical Inspection System Industry Leaders
-
Cognex Corporation
-
KLA Corporation
-
Omron Corporation
-
Camtek Ltd.
-
Viscom AG
- *Disclaimer: Major Players sorted in no particular order
Automated Optical Inspection System Market Companies Covered in this Report
- Omron Corporation
- Koh Young Technology Inc.
- Test Research Inc. (TRI)
- KLA Corporation
- Cognex Corporation
- Camtek Ltd.
- Viscom AG
- CyberOptics Corporation
- Nordson YESTECH
- Saki Corporation
- Mirtec Co. Ltd.
- ViTrox Corporation
- GOPEL electronic GmbH
- Daiichi Jitsugyo Asia
- ASC International
- Yamaha Intelligent Machines
- JUKI Automation Systems
- PARMI Corp.
- Mek (Marantz Electronics)
- Pemtron Corporation

Recent Industry Developments in Automated Optical Inspection System Market
- April 2025: Chroma ATE launched BLiS-based AOI for semiconductor packaging at Touch Taiwan 2025.
- March 2025: GÖPEL electronic debuted MultiEyeS plus with augmented-reality placement support.
- March 2025: Test Research Inc. introduced TR7700Q SII 3D AOI with 2.5 µm resolution.
- February 2025: Kopin secured initial orders for SXGA-R15 microdisplay aimed at 3D AOI.
- January 2025: OMRON Automation unveiled AI-driven AOI at IPC APEX, cutting program time 90% and reducing false positives.


Automated Optical Inspection System Market Report Scope and Research Methodology
Market Definition and Coverage
Our study defines the automated optical inspection (AOI) system market as revenues generated from new 2-D and 3-D inline or offline machines that use machine-vision cameras, structured lighting, and analysis software to identify defects on printed-circuit boards and other electronic assemblies. Values are reported in USD at the manufacturer invoice level and include the embedded software licence that ships with each unit.
Scope Exclusion: handheld microscopes, solder-paste inspection, X-ray, or other non-optical inspection tools remain outside the present scope.
Segments Covered in This Report
-
By Dimension
- 2D Automated Optical Inspection Systems
- 3D Automated Optical Inspection Systems
-
By Technology Deployment
- Inline AOI
- Offline AOI
-
By Industry Vertical
- IT and Telecom
- Consumer Electronics
- Automotive Electronics
- Industrial Electronics
- Aerospace and Defense
- Medical Devices
- Semiconductor Foundries
- Other Industries
-
By Production Stage
- Solder Paste Inspection (SPI) AOI
- Pre-Reflow AOI
- Post-Reflow AOI
- Final Assembly AOI
-
By Component
- AOI Hardware Systems
- AOI Analysis & Programming Software
-
By Geography
-
North America
- United States
- Canada
- Mexico
-
Europe
- Germany
- United Kingdom
- France
- Italy
- Spain
- Rest of Europe
-
Asia-Pacific
- China
- Japan
- South Korea
- India
- South East Asia
- Rest of Asia-Pacific
-
South America
- Brazil
- Rest of South America
-
Middle East and Africa
-
Middle East
- United Arab Emirates
- Saudi Arabia
- Rest of Middle East
-
Africa
- South Africa
- Rest of Africa
-
Middle East
-
North America
Data Sources, Market Sizing, and Validation
Primary Research
Mordor analysts interviewed SMT line engineers, quality-control managers, and regional distributors across Asia-Pacific, North America, and Europe. Conversations clarified average selling prices, line-throughput thresholds that trigger AOI adoption, and real-world swap-out rates for legacy 2-D machines, letting us reconcile desk findings with on-ground sentiment.
Desk Research
We gathered baseline numbers from freely accessible authorities such as IPC statistical yearbooks, UN Comtrade shipment codes for AOI machinery, the International Federation of Robotics' electronics installation data, and SMT Association journals. Company financials were screened on D&B Hoovers, while patent trends were sampled through Questel to flag emerging 3-D metrology claims. Press releases, 10-Ks, and regulatory filings supplied price points and recent unit launches. This list is illustrative, not exhaustive.
Market-Sizing & Forecasting
A top-down production and trade reconstruction began with global PCB assembly volumes, AOI penetration per line, and weighted ASPs. Selective bottom-up roll-ups of sampled vendor revenues served as a cross-check. Key variables like 3-D AOI share, smartphone and EV electronics output, average SMT line density, and capex per million solder joints feed a multivariate regression forecast. Gap pockets in supplier data were bridged with region-specific ASP benchmarks and inventory turns agreed in expert calls.
Data Validation & Update Cycle
Outputs pass variance screens versus robotics installations, IPC equipment billings, and customs declarations, followed by dual analyst review. Reports refresh each year, with interim tweaks when material events, such as major fab expansions or regulatory shifts, occur, and a final validation pass precedes delivery.
How Mordor Intelligence's Automated Optical Inspection System Market Size Compares to Other Published Estimates
Published values often diverge because firms pick different scopes, price ladders, and refresh cadences.
According to Mordor Intelligence, choosing a disciplined PCB-centric scope and yearly source refresh makes our baseline visibly consistent.
Benchmark comparison
| Market Size | Anonymized source | Primary gap driver |
|---|---|---|
| USD 0.91 B (2025) | Mordor Intelligence | |
| USD 1.05 B (2024) | Global Consultancy A | includes SPI and X-ray equipment, limited primary checks |
| USD 0.98 B (2024) | Trade Journal B | assumes flat ASP, no regional split adjustment |
| USD 1.66 B (2026) | Global Consultancy C | counts software upgrades and service contracts as hardware sales |
In sum, by anchoring forecasts to clearly defined hardware units, validated ASP progressions, and a transparent update rhythm, Mordor Intelligence delivers a balanced, reproducible baseline that decision-makers can rely on for strategic planning.


Key Questions Answered in the Report
What is the projected size of the automated optical inspection system market by 2031?
The market is forecast to reach USD 1.46 billion in 2031 on an 8.14% CAGR.
Which segment is growing faster, 2D or 3D inspection?
3D systems outpace the overall automated optical inspection system market with a 8.92% CAGR thanks to superior height-related defect capture
Why are inline AOI platforms gaining preference?
Inline units integrate with MES dashboards, enabling real-time process corrections and now represent 68.35% of the market with 10.88% CAGR growth.
How does ISO-26262 influence AOI adoption?
The functional-safety standard requires traceable inspection, prompting German Tier-1s to boost 3D AOI spending by 35% since 2024.
What challenge limits AOI expansion in Southeast Asia?
A 65% shortfall of skilled AOI programmers extends installation backlogs to six months, damping short-term market growth.
Which industry vertical drives the highest AOI volume?
IT and Telecom leads with 56.90% market share due to 5G infrastructure and data-center hardware that demand zero-downtime reliability.
Page last updated on:


