
Security Orchestration Market Size and Share
Market Overview
| Study Period | 2020 - 2031 |
|---|---|
| Market Size (2026) | USD 1.40 Billion |
| Market Size (2031) | USD 2.81 Billion |
| Growth Rate (2026 - 2031) | 14.88 % |
| Fastest Growing Market | Asia Pacific |
| Largest Market | North America |
| Market Concentration | Medium |
Major Players *Disclaimer: Major Players sorted in no particular order Image © Mordor Intelligence. Reuse requires attribution under CC BY 4.0. | |
Security Orchestration Market Analysis by Mordor Intelligence
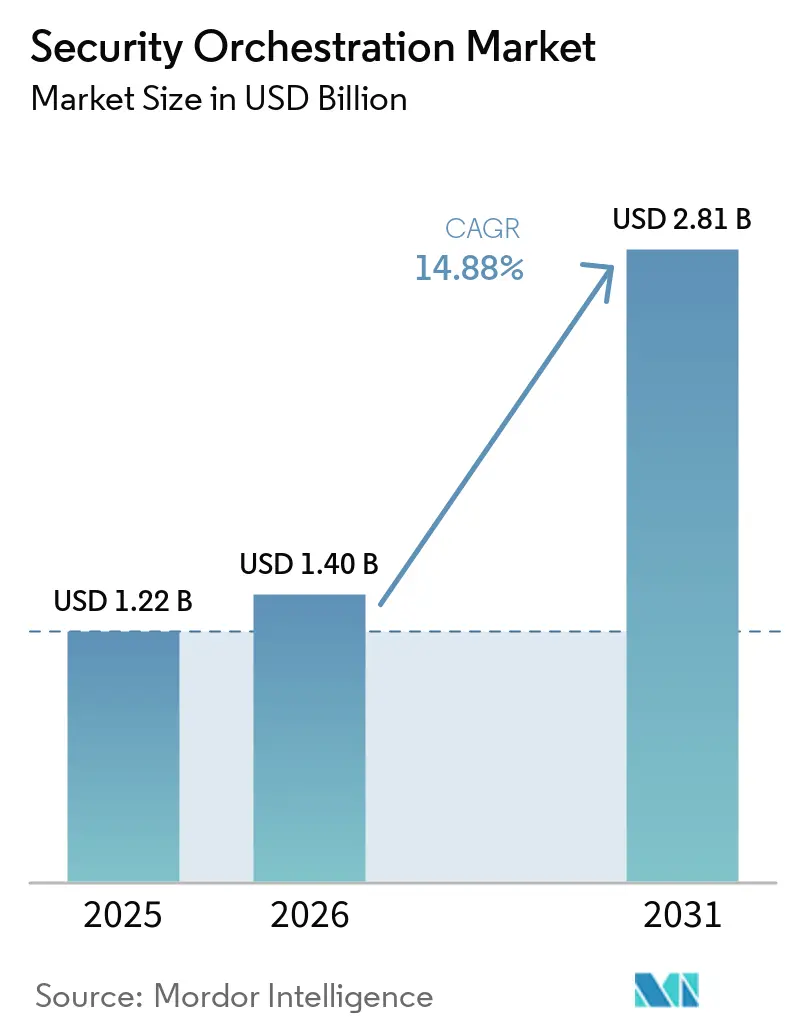
The security orchestration market size was valued at USD 1.22 billion in 2025 and estimated to grow from USD 1.4 billion in 2026 to reach USD 2.81 billion by 2031, at a CAGR of 14.88% during the forecast period (2026-2031). Growth is propelled by enterprises that can no longer rely on manual, reactive security processes and are embedding automation directly into everyday response workflows. Most organizations now struggle with thousands of alerts a day, so platforms that can ingest telemetry from identity, endpoint, and network tools and then trigger pre-approved actions are becoming a spending priority. Vendors that once competed on long lists of playbooks are shifting toward high-velocity connectors, recognizing that orchestration value sits in how quickly data can be normalized and acted on. Regulatory pressure has also intensified: breach-reporting timelines in the European Union, the United States, and Singapore effectively require near-real-time containment, driving automated case management adoption in highly regulated industries. All of these factors converge to keep pricing power intact even as more competitors enter, resulting in a structurally durable growth curve.
Key Report Takeaways
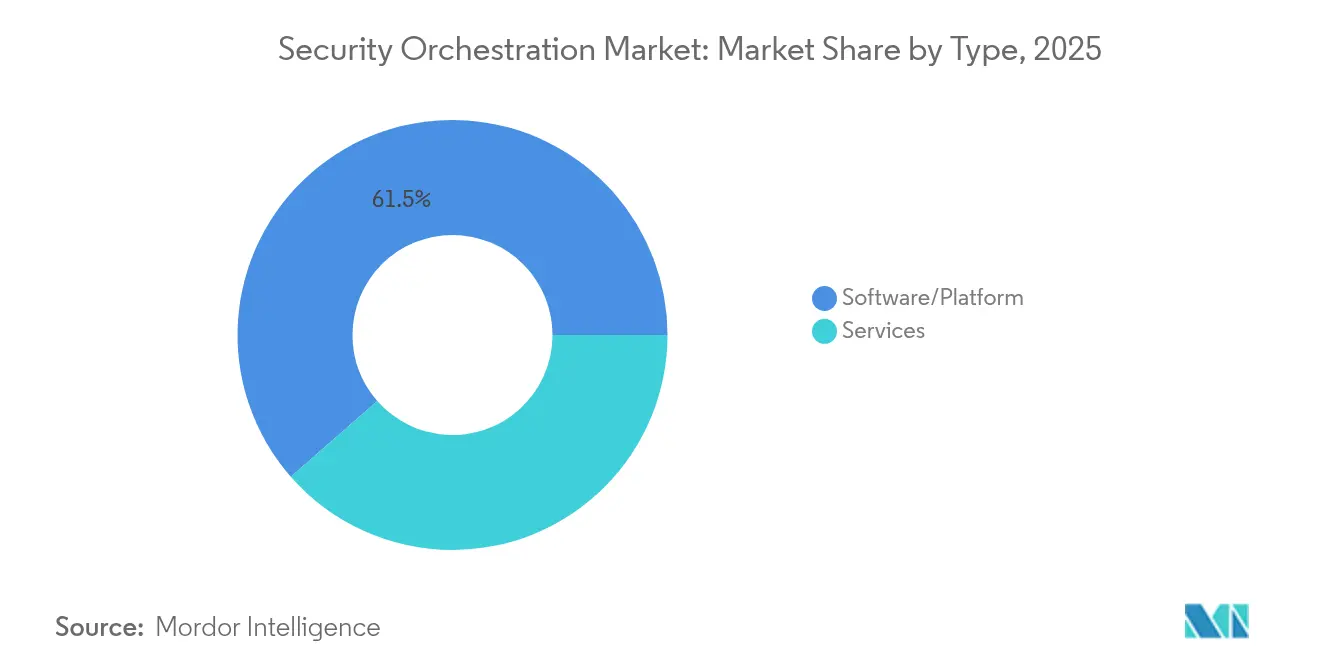
- By type, software and platforms led with 61.45% revenue share in 2025 while services are projected to expand at a 15.72% CAGR through 2031.
- By deployment mode, on-premises captured 55.10% of the security orchestration market share in 2025, but cloud-based platforms are forecast to grow at 16.38% to 2031.
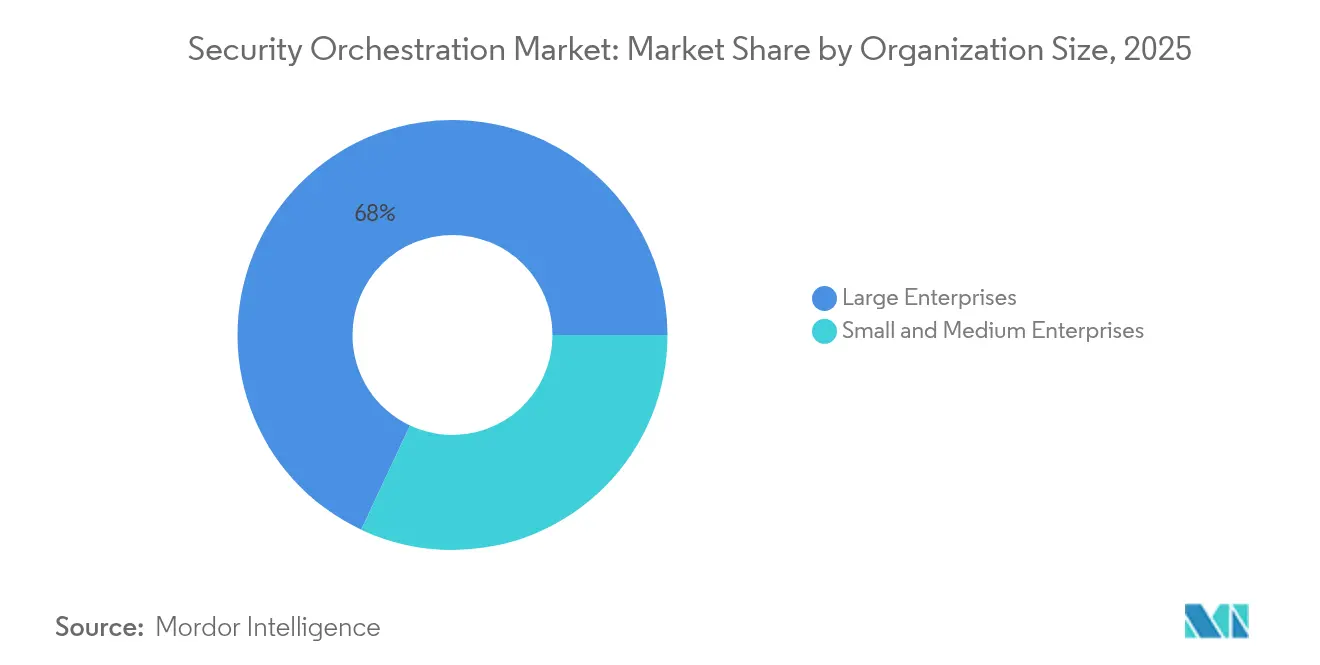
- By organization size, large enterprises held 68.02% of the 2025 market; small and medium enterprises record the fastest outlook at a 15.94% CAGR to 2031.
- By end-user industry, banking, financial services, and insurance controlled 29.15% of 2025 demand while healthcare is expected to log a 16.02% CAGR through 2031.
- By geography, North America accounted for 38.10% of 2025 value, with Asia Pacific advancing at a 15.52% CAGR to 2031.
Note: Market size and forecast figures in this report are generated using Mordor Intelligence’s proprietary estimation framework, updated with the latest available data and insights as of 2026.
Market Trends and Insights
Drivers Impact Analysis of Security Orchestration Market*
| Driver | (~) % Impact on CAGR Forecast | Geographic Relevance | Impact Timeline |
|---|---|---|---|
| Rising Trend of Automated Security Operations | +3.20% | Global, with concentration in North America and Europe | Medium term (2-4 years) |
| Need to Integrate Disparate Cybersecurity Technologies | +2.80% | Global, particularly acute in large enterprises across all regions | Short term (≤ 2 years) |
| Increasing Sophistication and Volume of Cyberattacks | +3.50% | Global, with elevated impact in BFSI and Healthcare verticals | Short term (≤ 2 years) |
| Growing Adoption of Cloud-Based Security Architectures | +2.40% | North America, Europe, Asia Pacific core markets | Medium term (2-4 years) |
| Integration of SOAR Into DevSecOps Pipelines | +1.60% | North America and Europe, emerging in Asia Pacific | Long term (≥ 4 years) |
| AI-Powered Adaptive Playbooks Accelerating Response | +2.10% | Global, with early adoption in technology and financial sectors | Medium term (2-4 years) |
| Source: Mordor Intelligence | |||


Rising Trend of Automated Security Operations
Security teams now replace manual ticket triage with security orchestration automation and response workflows that execute machine-initiated containment steps in seconds, compressing mean time to respond from nearly an hour to mere minutes.[1]CrowdStrike Research Team, “2024 Global Threat Report,” CrowdStrike, crowdstrike.com Ransomware that can encrypt systems within 45 minutes leaves no buffer for human signoff, making automated response a survival imperative. Playbooks also serve proactive hunting functions, launching scheduled queries across endpoint, network, and cloud logs when threat feeds highlight new indicators. Enterprises that postpone automation confront both slower defense and rapid analyst churn, given that alert volumes rose 30% year on year in 2024.[2]Fortinet Labs, “2024 Threat Landscape Report,” Fortinet, fortinet.com
Need To Integrate Disparate Cybersecurity Technologies
Enterprises run roughly 45 security tools yet struggle to link more than one-fifth of them through robust two-way APIs.[3]Nikesh Arora, “Fiscal Year 2024 Earnings Call,” Palo Alto Networks, paloaltonetworks.com Orchestration solves the swivel-chair problem by normalizing alerts and enriching them in a single pane, an approach that becomes indispensable once organizations exceed 40 tools. Regulatory frameworks such as GDPR enforce rapid incident containment, making manual cross-tool correlation unworkable. The security orchestration market, therefore, scales in direct proportion to tool sprawl because ROI shifts from productivity to basic feasibility.
Increasing Sophistication and Volume of Cyberattacks
The Federal Bureau of Investigation logged USD 12.5 billion in cybercrime losses for 2023 and noted 2024 ransomware incidents climbed another 15%.[4] Federal Bureau of Investigation, “Internet Crime Report 2023,” IC3, ic3.gov Threat actors exploit legitimate utilities to hide in plain sight, forcing security operations centers to correlate identity anomalies, process chains, and lateral movement. Orchestration automates this enrichment, pulling intelligence and detonating suspicious payloads within a singular playbook. Meanwhile, automated exploit scanners drove a 25% surge in attack attempts per organization during 2024, overwhelming teams that still rely on manual prioritization.
AI-Powered Adaptive Playbooks Accelerating Response
Artificial intelligence now tunes decision branches based on live telemetry, so playbooks evolve without hand coding. Splunk launched AI-driven orchestration in 2024 that harvests historical incident outcomes and recommends logic changes to cut false positives. IBM introduced natural-language playbook generation, letting analysts describe workflows conversely and leaving the platform to translate that intent into code. Early adopters claim hours instead of weeks to operationalize new threat intelligence, a benefit that underpins the double-digit expansion forecast for the security orchestration market.
Restraints Impact Analysis of Security Orchestration Market*
| Restraint | (~) % Impact on CAGR Forecast | Geographic Relevance | Impact Timeline |
|---|---|---|---|
| Lack of Skilled Cybersecurity Personnel | -2.10% | Global, particularly acute in Asia Pacific and emerging markets | Short term (≤ 2 years) |
| High Initial Deployment and Integration Costs | -1.80% | Global, with elevated impact on SME segment | Short term (≤ 2 years) |
| Low Interoperability of Proprietary Orchestration Standards | -1.30% | Global, affecting multi-vendor security environments | Medium term (2-4 years) |
| Regulatory Hesitation Toward Fully Automated Response | -0.90% | Europe, North America, with emerging impact in Asia Pacific | Long term (≥ 4 years) |
| Source: Mordor Intelligence | |||
Lack Of Skilled Cybersecurity Personnel
ISC2 reported a 4.8-million-person shortfall in 2024, and orchestration projects stall when teams lack API and playbook engineering skills. Many deployments wind up automating little more than ticket creation because advanced steps network isolation or cloud instance suspension require logic design expertise. Skills gaps are acute in Asia Pacific, where 68% of Indian security leaders flagged talent scarcity as the primary barrier to adoption. Vendors now push low-code builders and managed services, but those fixes dilute customization and can leave organizations locked into vendor playbooks.
High Initial Deployment and Integration Costs
Comprehensive projects range from USD 500,000 to USD 1.5 million once platform licenses, professional services, and change management are counted. Each additional security tool demands a connector, making final budgets hard to pin down until deep into scoping. Subscription pricing and cloud delivery cut capital outlays yet leave professional services and ongoing tuning costs intact. Managed services offer relief but shift expenses into operating budgets, a trade-off that still slows decisions in cash-constrained small and medium enterprises. This cost friction explains why service revenue is growing faster than software sales in the security orchestration market.
*Our forecasts treat driver/restraint impacts as directional, not additive. The impact forecasts reflect baseline growth, mix effects, and variable interactions.
Security Orchestration Market Segment Analysis
By Type:
Services Gain as Complexity Outpaces LicensingThe security orchestration market size for software and platforms reached USD 749.7 million in 2025 and commanded 61.45% share. Services, however, are projected to widen at a 15.72% CAGR through 2031, signalling that integration and operational management drive value more than code ownership. Professional services concentrate on custom API bridges linking orchestration engines to specialty tools, an area where off-the-shelf connectors are still lacking. Managed services appeal to organizations that cannot expand headcount but still need 24-hour response coverage. Vendors therefore bundle licenses with outcome-based service tiers that guarantee target mean time to respond instead of selling pure software subscriptions. Pricing pressure on the software line has already surfaced, with consumption-based models letting buyers pay per playbook execution rather than commit to enterprise licenses.
As service uptake grows, strategic emphasis shifts to knowledge transfer and continuous tuning. Enterprises recognize that a static library of playbooks loses relevance within months, so they pay integrators to perform quarterly logic reviews and update connectors as vendor APIs evolve. These dynamic feeds a recurrent revenue stream that stabilizes vendor cash flow, even if new logo growth slows. It also raises competitive barriers, because incumbent integrators embed deeply in customer environments, making rip-and-replace decisions costly. For buyers, the calculus pivots from license discounts to provider expertise, driving consolidation among boutique systems integrators eager to scale globally.


By Deployment Mode:
Cloud Gains as Hybrid Architectures MatureOn-premises deployments still make up 55.10% of the security orchestration market share, driven by data sovereignty rules in government, defense, and healthcare. Yet cloud platforms are expanding at 16.38% a year because they scale compute instantly during alert spikes and integrate natively with cloud-native security services. Vendors report that bookings tied to cloud subscriptions outstrip on-premises deals, reflecting preference for pay-as-you-go economics. Hybrid patterns have become the norm in regulated industries, which store sensitive case data on company servers while offloading compute-heavy malware analysis to vendor clouds. This architecture satisfies compliance, delivers elasticity, and allows gradual migration without rewriting playbooks.
Cloud adoption also aligns with DevSecOps, where development teams expect security tooling to run in the same Kubernetes clusters as application workloads. Orchestration delivered as a container service meets that expectation and avoids lengthy infrastructure procurement cycles. Meanwhile, major vendors embed threat intelligence directly into their cloud offerings, an advantage on-premises versions lack unless organizations acquire third-party feeds. As the regulatory climate clarifies, especially around personal data processing, experts anticipate a tipping point after which cloud consumption overtakes on-premises footprints, echoing the broader SaaS trend already visible in adjacent security categories.
By Organization Size:
SMEs Adopt as Vendors Modularize OfferingsLarge enterprises controlled 68.02% of 2025 spending because they operate vast tool ecosystems that virtually mandate orchestration. However, small and medium enterprises will post a 15.94% CAGR to 2031, helped by low-code builders and bundled managed services. Vendors now ship starter editions that include core playbooks for phishing triage and credential reset, allowing buyers to show value fast before expanding into advanced use cases. Subscription tiers scale by execution volume, which aligns well with the variable alert profiles common in smaller firms. Vendors target mid-market channel partners to offer packaged deployments with two-week go-live timelines.
SME interest also reflects supply-chain risk; smaller vendors often serve as entry points for attackers seeking to breach larger partners. Customers and insurers, therefore, push SMEs to demonstrate automated containment and evidence capture. Cloud delivery further removes infrastructure hurdles, permitting smaller organizations to run orchestration within minutes of onboarding. Over time, successful SME adoption is expected to spur broader ecosystem changes, such as universal connector standards and community-maintained playbook repositories that lower development effort across market segments.
By End-User Industry:
Healthcare Accelerates as Ransomware IntensifiesThe banking, financial services, and insurance vertical accounted for 29.15% of global revenue in 2025, reflecting strict compliance mandates and high data-loss penalties. Healthcare, however, will expand at 16.02% annually through 2031 as ransomware groups target hospitals where downtime endangers patient safety. The security orchestration market size for healthcare solutions is forecast to double because automated response minimizes disruption by isolating compromised devices within seconds. Hospitals also face staff shortages, making automation an operational necessity rather than an optional upgrade. Vendors respond by pre-loading playbooks that integrate with electronic health record systems and medical device networks, easing adoption in clinical settings.
Beyond healthcare, telecom operators use orchestration to process the deluge of alerts produced by 5G infrastructures, while energy utilities demand playbooks that respect safety interlocks in operational technology environments. Retailers pair orchestration with fraud-detection engines to stem payment-card compromises. Government agencies incorporate automated incident reporting to meet breach-notification laws. Together these verticals diversify demand, though each imposes its own compliance nuances that vendors must encode into playbooks, reinforcing the shift toward service-centric revenue.
Geography Analysis
North America Security Orchestration Market
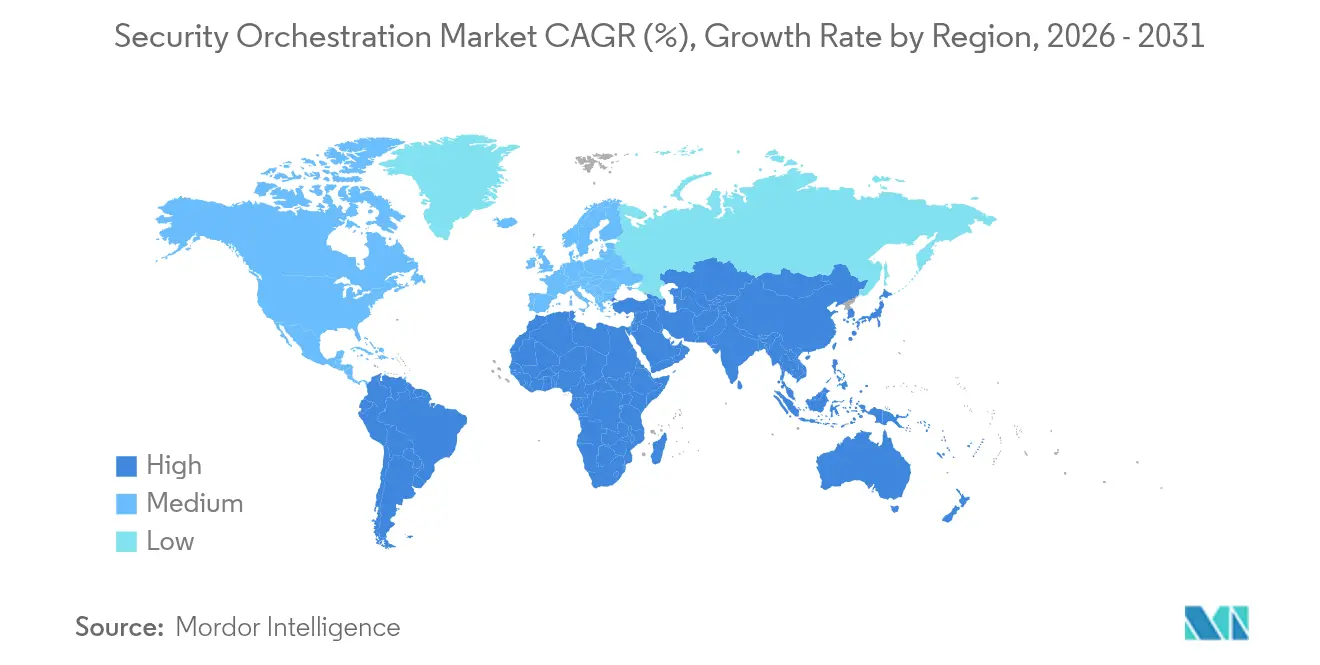
North America generated 38.10% of 2025 revenue thanks to early adopter enterprises, well-defined regulatory frameworks, and a dense vendor ecosystem. Federal directives, including CISA guidance encouraging SIEM-SOAR convergence, sustain procurement by critical infrastructure operators. Growth is decelerating from early-cycle highs as most Fortune 1000 organizations already run at least pilots. Focus now shifts to optimization engagements, where service providers fine-tune existing logic rather than sell new licenses.
APAC Security Orchestration Market
Asia Pacific is set to lead growth at 15.52% CAGR through 2031, powered by accelerated digital transformation in India, Japan, Australia, and China. Monetary authorities such as the MAS in Singapore codify automated response expectations for financial institutions, effectively mandating SOAR adoption. The region’s 2.6-million-person cybersecurity talent gap motivates automation as a compensatory strategy. Vendors succeed by pairing cloud delivery with local data-center options to respect residency rules, a model that attracts mid-tier banks and e-commerce platforms alike.
EMEA and South America Security Orchestration Market
Europe occupies a nuanced middle ground. GDPR breach-notification requirements push enterprises toward orchestration capable of time-stamped evidence capture, but fragmented national regulations complicate cross-border playbooks. Hybrid deployments dominate, keeping sensitive data on local servers while using cloud compute for enrichment. Middle East programs in the United Arab Emirates and Saudi Arabia earmark public funds for automated security operations, creating lighthouse projects that lift regional visibility. Africa and South America remain nascent, with adoption concentrated in multinational subsidiaries and government agencies, yet cloud delivery plus managed services are lowering barriers quickly.

Regulatory Landscape
Security orchestration adoption is increasingly shaped by cybersecurity governance frameworks that tighten incident readiness and response documentation. In the European Union, the Digital Operational Resilience Act (DORA) for financial entities is being operationalized through regulatory technical standards, which pushes firms to formalize ICT risk management processes and testing. That, in turn, increases demand for orchestrated workflows that can execute and provide evidence controls across multiple tools. EU Implementing Regulation 2024/2690 also sets technical and methodological risk-management requirements for critical entities, referencing established standards such as ISO/IEC 27001, and reinforcing the use of auditable automation for detection, response, and evidence capture in regulated environments.
Outside the EU, policy and standards activity similarly anchors orchestration in operating models. In the United States, CISA published guidance in May 2025 on procuring and implementing SIEM and SOAR, encouraging more structured convergence and measurable outcomes for critical infrastructure programs. The NSA Zero Trust framework includes an Automation and Orchestration pillar that emphasizes replacing manual steps with policy-driven actions. In China, MIIT issued YD/T 4966-2024 (technical reference architecture for orchestration, automation, and response) in July 2024, providing a design and testing reference for SOAR implementations. At the enterprise framework level, NIST Cybersecurity Framework 2.0 (February 2024) added a Govern function, shifting orchestration from a SOC tool toward a governance-backed capability tied to risk management and supply chain oversight.
Competitive Landscape
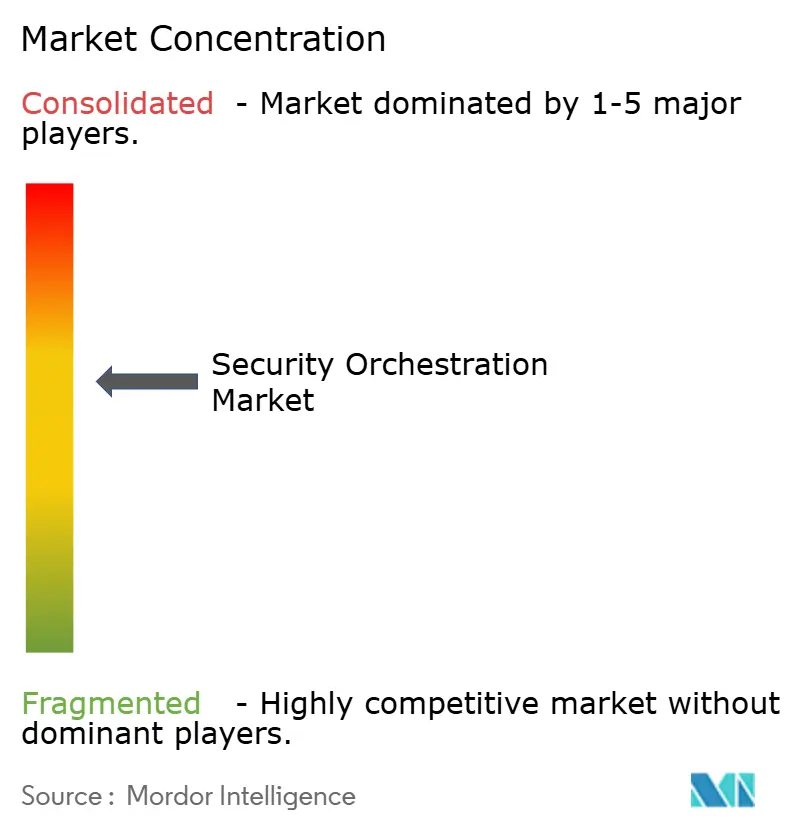
The security orchestration market exhibits moderate concentration with a blended field of platform giants and focused specialists. Palo Alto Networks, IBM, Splunk, and Cisco leverage existing customer bases to cross-sell orchestration modules embedded in broader security portfolios. Pure-play vendors like Swimlane, ThreatConnect, and Trellix compete on integration depth, low-code customization, and vertical-specific content packs. Differentiation has migrated from the number of pre-made playbooks to the speed and breadth of native connectors feeding into XDR, SIEM, and identity platforms.
Artificial intelligence represents the newest competitive axis. Patents now cluster around machine-learning-driven incident classification and automated playbook tuning. IBM owns multiple filings linking cognitive models with security orchestration workflows. Meanwhile, hyperscale cloud providers bundle basic orchestration within native security services; Microsoft and Amazon offer playbook automations that satisfy baseline requirements for many cloud-first organizations. This “good-enough” built-in tooling forces specialized vendors to prove clear superiority in multi-cloud, multi-vendor environments.
Mergers and acquisitions reinforce convergence. Cisco’s 2024 purchase of Splunk created a combined observability and security stack positioned against Palo Alto’s Cortex suite. Google folded Siemplify into its Chronicle operation, adding orchestration to log analytics. These integrations shrink standalone vendor territory, pressuring independents to cultivate niche depth, such as operational technology or threat-intelligence fusion. Service-led strategies grow in importance; providers embed staff onsite or remotely manage orchestration as a turnkey outcome, locking in multiyear engagements that deter platform switches.
Security Orchestration Industry Leaders
IBM Corporation
Tufin Software Technologies Ltd
Mandiant (Google LLC)
Cisco Systems, Inc.
Amazon Web Services, Inc.
- *Disclaimer: Major Players sorted in no particular order
Security Orchestration Market Companies Covered in this Report
- International Business Machines Corporation
- Cisco Systems Inc.
- Palo Alto Networks Inc.
- Splunk Inc.
- Swimlane LLC
- FireEye Inc.
- DFLabs SpA
- Siemplify Ltd
- Tufin Software Technologies Ltd
- RSA Security LLC
- Fortinet Inc.
- Rapid7 Inc.
- LogRhythm Inc.
- Cyberbit Ltd
- Forescout Technologies Inc.
- ThreatConnect Inc.
- Securonix Inc.
- Exabeam Inc.
- Accenture PLC
- Amazon Web Services Inc.

Market Opportunities and Future Outlook
A gap remains in operationalizing regulatory and governance requirements into repeatable, time-stamped workflows across heterogeneous security stacks. DORA-driven harmonization of ICT risk management in financial services, the EU critical-entity requirements under Implementing Regulation 2024/2690, and the expanded Govern focus in NIST CSF 2.0 all reinforce demand for orchestration that does more than execute playbooks. Buyers increasingly need platforms and services that capture decision trails, approvals, and evidence as part of case management, audit logs, and report templates, particularly for BFSI and healthcare, where spending momentum is already concentrated.
Another opportunity is consolidation and embedded orchestration inside broader SOC platforms, alongside a countertrend for vendor-agnostic automation fabrics in multi-vendor environments. Large vendors are folding orchestration into SIEM and XDR suites, while specialist vendors compete on breadth of connectors, low-code customization, and cross-domain orchestration spanning identity, endpoint, network, and cloud. CISA guidance on SIEM and SOAR implementation (May 2025) provides procurement and integration framing that can speed platform rationalization projects. Evaluation is also shifting as agentic and AI-assisted triage becomes a differentiator, with buyers increasingly focused on how quickly orchestration can normalize telemetry, recommend actions, and reduce analyst workload amid high alert volumes and ongoing skills constraints.
Recent Industry Developments in Security Orchestration Market
- June 2026: IBM introduced new agentic and automation capabilities for its managed detection and response services through its Autonomous Threat Operations Machine (ATOM). The update operationalizes higher levels of autonomous investigation and response for customers that want managed execution rather than only tooling, reinforcing the services-led expansion within security orchestration.
- March 2026: IBM and CrowdStrike expanded their strategic partnership to integrate CrowdStrike Charlotte AI with IBM ATOM for machine-speed investigation and containment. The integration targets faster cross-platform workflows between threat intelligence, detection, and automated response, supporting buyers seeking orchestration that spans multiple vendor stacks.
- November 2025: Tufin launched Tufin Orchestration Suite R25-2 with enhanced policy automation across network, cloud, and SASE environments, along with improved topology accuracy and updated AI-driven insights via TufinAI. The release strengthens unified control-plane capabilities for hybrid infrastructures, which is a common constraint when enterprises need orchestration that coordinates change and response across distributed connectivity.


Security Orchestration Market Report Scope and Research Methodology
Market Definition and Coverage
This market covers spending on security orchestration tools and related services that help teams connect security products, manage incidents, and automate response steps through workflows and playbooks across an organization.
Scope exclusions: We exclude general IT workflow tools that are not built for security operations, and we do not count unmanaged services that sit outside orchestration-led incident handling.
Segments Covered in This Report
- By Type
- Software/Platform
- Services
- Professional Services
- Managed Services
- By Deployment Mode
- On-Premises
- Cloud
- Hybrid
- By Organization Size
- Large Enterprises
- Small and Medium Enterprises
- By End-User Industry
- Banking, Financial Services and Insurance
- Information Technology and Telecommunication
- Government and Defense
- Healthcare and Life Sciences
- Retail and Ecommerce
- Energy and Utilities
- Other End-User Industries
- By Geography
- North America
- United States
- Canada
- Mexico
- South America
- Brazil
- Argentina
- Rest of South America
- Europe
- United Kingdom
- Germany
- France
- Russia
- Rest of Europe
- Asia Pacific
- China
- Japan
- India
- Australia
- South Korea
- Rest of Asia Pacific
- Middle East
- United Arab Emirates
- Saudi Arabia
- Turkey
- Rest of Middle East
- Africa
- South Africa
- Egypt
- Nigeria
- Rest of Africa
- North America
Data Sources, Market Sizing, and Validation
Desk Research
Desk work starts by framing what counts as security orchestration spend and what should be left out, because budgets can be reported under broader security operations or automation lines. We review public materials such as NIST guidance, CISA advisories, and MITRE ATT&CK references, plus data releases from the US Bureau of Labor Statistics and the US International Trade Commission (where available for software and IT services signals). We also use peer reviewed journals and conference proceedings to understand how orchestration, playbooks, and incident response processes are implemented and measured.
On top of that, we read annual reports, earnings call transcripts, investor presentations, and product documentation to understand pricing approaches and typical deployment patterns across on-premise, cloud, and hybrid environments. A paid subscription for company financials and intelligence is used selectively to standardize revenue splits and confirm corporate structure changes, and a patent database is used when we need to validate where automation and orchestration R&D is trending. The desk sources mentioned here are illustrative only, and other public materials were also referenced for data collection, validation, and clarification.
Primary Interviews and Surveys
Primary work is used to pressure test the scope, attach realistic adoption ranges, and confirm how buyers split spend between platform licenses and supporting services. We speak with security operations leaders, incident responders, IT security architects, and service partners across the Americas, EMEA, and APAC, so deployment mix assumptions, renewal behavior, and workflow maturity are checked against how these teams run security orchestration in practice.
Distribution of primary research fieldwork respondents
| Company type | Respondent position | Region |
|---|---|---|
| Top tier: 29% | CXOs: 15% | APAC: 49% |
| Mid tier: 51% | Functional/Unit leaders: 27% | EMEA: 32% |
| Smaller Players: 20% | Managers: 58% | Americas: 19% |
Market-Sizing & Forecasting
Sizing starts with a top-down build where broader cybersecurity and security operations spending pools are reconstructed into an orchestration-specific demand pool using adoption and budget-share assumptions by deployment type and industry. Once that structure is in place, we corroborate it with selective bottom-up approximations, such as sampled license price points, typical seat or incident-based packaging, and supplier revenue sanity checks, and then adjust totals when the two views diverge beyond a reasonable band.
Inputs are chosen to match how the category is actually purchased and used. Key model variables include the estimated number of SOC teams by region, alert volumes and tool sprawl indicators that trigger orchestration projects, the cloud versus on-premise deployment mix, professional services attach rates during rollout, and renewal and expansion behavior as playbooks mature. Where secondary data is thin, gaps are handled by using bounded ranges from interviews and then applying conservative midpoints until further validation is obtained.
For forecasting, we use scenario analysis supported by a regression-style linkage between spend and a few practical drivers, such as security staffing constraints, incident response cycle-time improvement targets, and overall enterprise security budget growth expectations. The final forecast is reviewed against regional momentum signals so short-term swings do not overly distort the longer trend line.
Data Validation & Update Cycle
Validation is done by checking the model output against independent signals like security software growth rates, security services spending patterns, and deployment mix shifts that show up in public filings and buyer commentary. When a region or vertical shows a sharp jump, the underlying drivers are rechecked, and follow-up calls are triggered to confirm whether it is a real adoption step-up or a modeling artifact.
Before sign-off, the calculations go through multi-step analyst reviews that look for unit consistency, currency timing alignment, and unreasonable price or penetration assumptions. Reports are refreshed annually, and interim updates are made when material events occur, such as major regulatory shifts or meaningful changes in solution packaging. Right before delivery, we perform a fresh pass so clients receive the latest updated view.
Mordor Intelligence's Security Orchestration Market Size Versus Other Published Estimates
Published numbers for security orchestration do not always match because the market boundary can move depending on whether automation and response features, adjacent case management, and bundled SOC tooling are counted together. Differences also come from how each publisher treats services, the assumed pace of cloud migration, and whether the base year is a true observed year or a forward-looking stepping stone.
Key gap drivers tend to show up quickly in the benchmark table, since some sources lean toward a broader SOAR-style definition, while others stay closer to pure orchestration platforms and related services. Currency timing and the way price erosion or premium packaging is modeled can also widen the spread, especially when multi-year contracts are normalized differently.
Benchmark comparison
| Source | Market Size | Gaps in Research Methodology |
|---|---|---|
| Mordor Intelligence | USD 1.22 B (2025) | |
| Global Consultancy A | USD 1.72 B (2024) | Uses a SOAR framing and a different base year, which can pull in wider automation and response spend beyond orchestration-led workflow and incident handling, and it can lift totals when platform bundles are treated as fully attributable. |
| Industry Publisher B | USD 1.20 B (2024) | Shows a narrower growth profile and lower CAGR assumptions, and it can understate services contribution when implementation and integration work is not consistently attached to the platform spend across regions. |
The table shows a clear spread that mainly tracks scope breadth and the year selected for the headline number, and in Mordor Intelligence's model the spend is counted only when orchestration platform and directly tied services are purchased for security operations workflows (rather than general automation tooling). When those rules are kept consistent and then cross-checked with adoption and pricing inputs, the final value becomes easier to trace back to practical buying behavior and repeatable steps.


Key Questions Answered in the Report
How fast is the security orchestration market expected to grow through 2031?
The market is forecast to register a 14.88% CAGR, lifting value from USD 1.22 billion in 2025 to USD 2.81 billion in 2031.
Which deployment mode is expanding the quickest?
Cloud-based orchestration platforms show the fastest expansion, advancing at 16.38% a year as organizations favor elastic compute and subscription pricing.
Why are services growing faster than software in this space?
Enterprises increasingly pay for integration expertise and continuous playbook tuning, pushing professional and managed services revenue above license growth.
What sector shows the highest growth outlook?
Healthcare is projected to post a 16.02% CAGR as ransomware attacks on hospitals drive urgent need for automated containment.
How does the skills shortage affect adoption?
A 4.8 million global deficit in cybersecurity professionals limits internal automation engineering capacity, steering many buyers toward low-code platforms or managed SOAR services.
Which region will contribute the most incremental demand?
Asia Pacific is expected to lead incremental growth at a 15.52% CAGR, buoyed by regulatory mandates and rapid cloud adoption across emerging markets.
Page last updated on:





