Process Mining Software Market Size and Share
Market Overview
| Study Period | 2020 - 2031 |
|---|---|
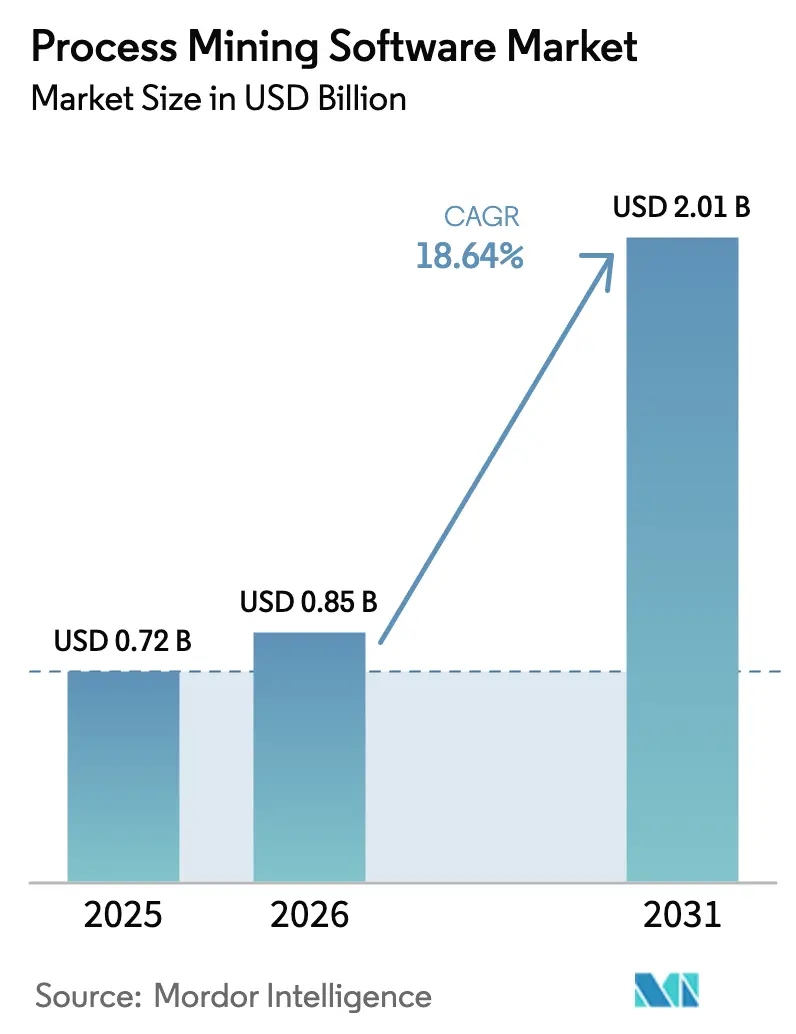
| Market Size (2026) | USD 0.85 Billion |
| Market Size (2031) | USD 2.01 Billion |
| Growth Rate (2026 - 2031) | 18.64% CAGR |
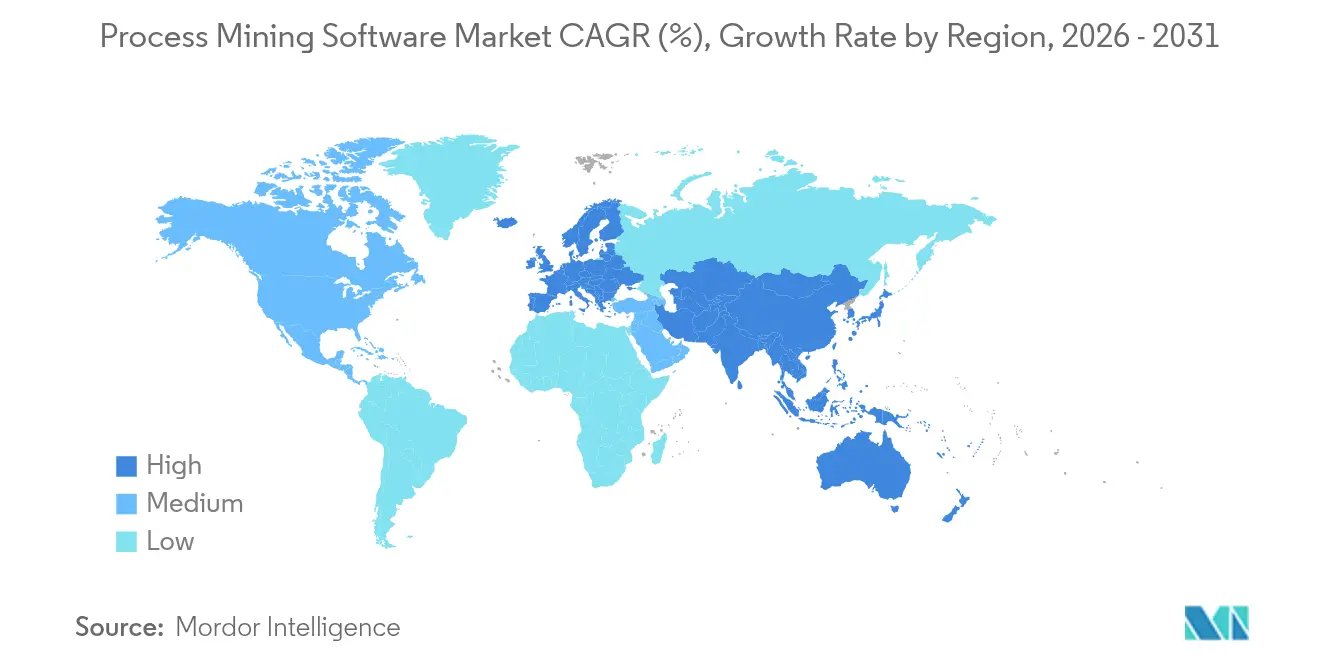
| Fastest Growing Market | Asia Pacific |
| Largest Market | Europe |
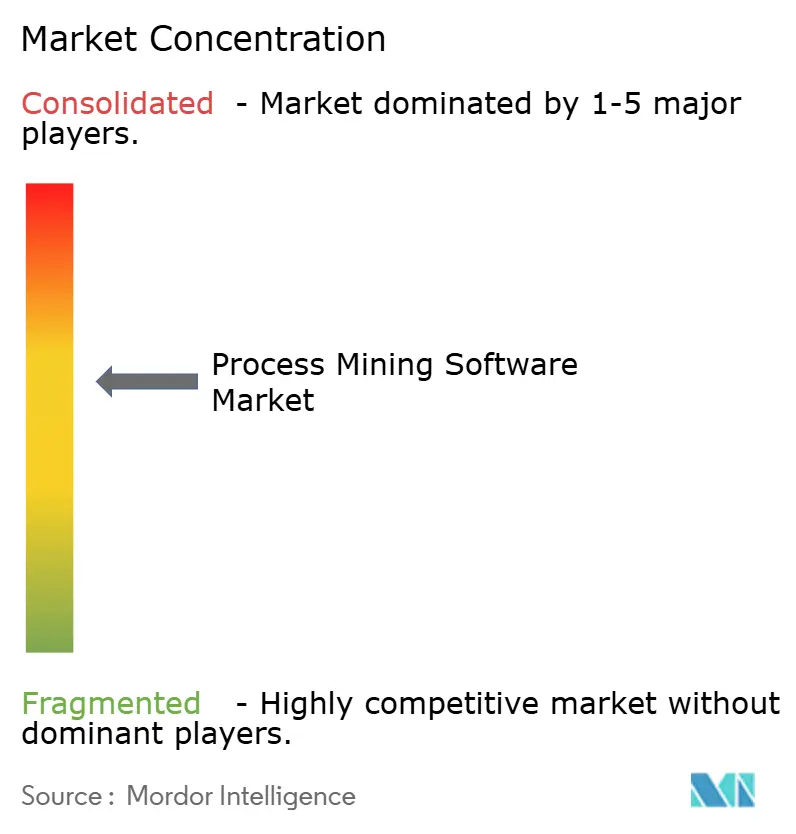
| Market Concentration | Medium |
Major Players *Disclaimer: Major Players sorted in no particular order Image © Mordor Intelligence. Reuse requires attribution under CC BY 4.0. | |
Process Mining Software Market Analysis by Mordor Intelligence
The process mining software market size in 2026 is estimated at USD 0.85 billion, growing from 2025 value of USD 0.72 billion with 2031 projections showing USD 2.01 billion, growing at 18.64% CAGR over 2026-2031. Heightened enterprise urgency to visualize complex, cross-system workflows, combined with regulatory compliance pressures, continues to accelerate buying decisions. Artificial intelligence enhancements embedded in leading platforms now surface bottlenecks that conventional business-process-management tools seldom catch, amplifying return on investment for early adopters. Cloud-first strategies dominate new deployments, and vendors increasingly bundle task-mining connectors to widen accessibility for small and medium businesses. Meanwhile, a moderate but rising threat of vendor lock-in pushes buyers to favor open-connectivity architectures.
Key Report Takeaways
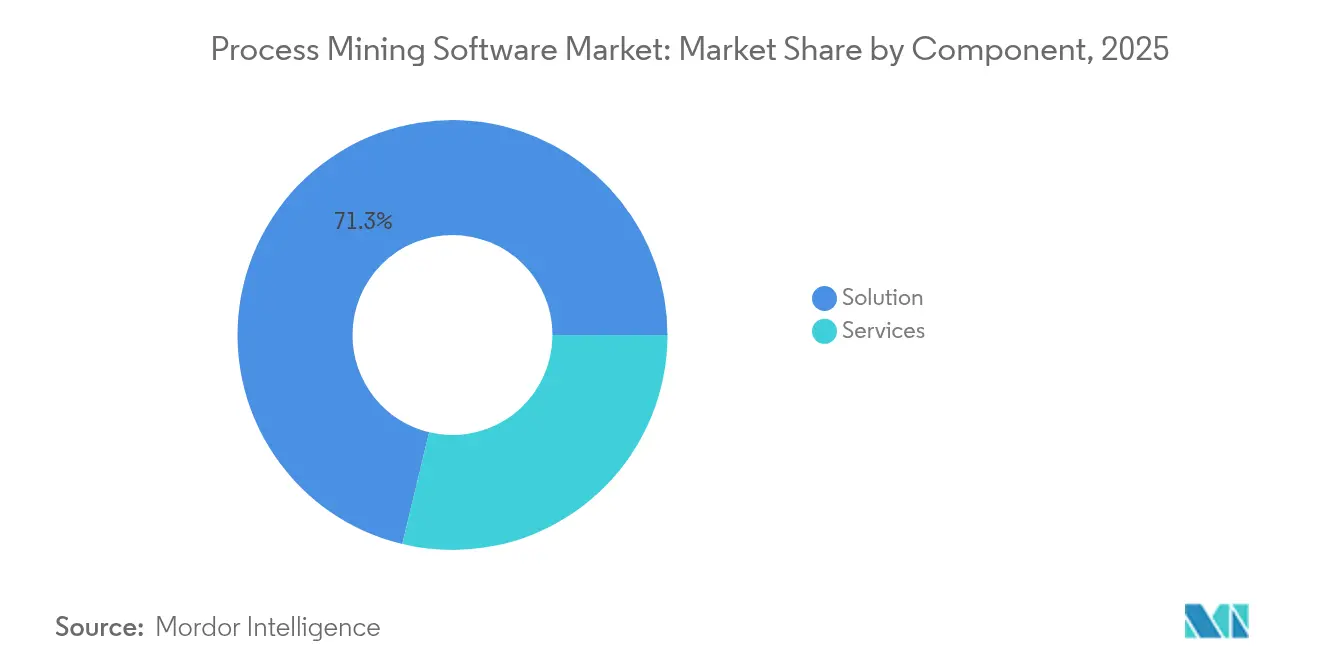
- By component, the Solution segment retained 71.25% of the process mining software market share in 2025, while Services is advancing at a 35.12% CAGR through 2031.
- By deployment mode, cloud solutions accounted for 66.80% of the process mining software market size in 2025; cloud is forecast to expand at a 32.47% CAGR to 2031.
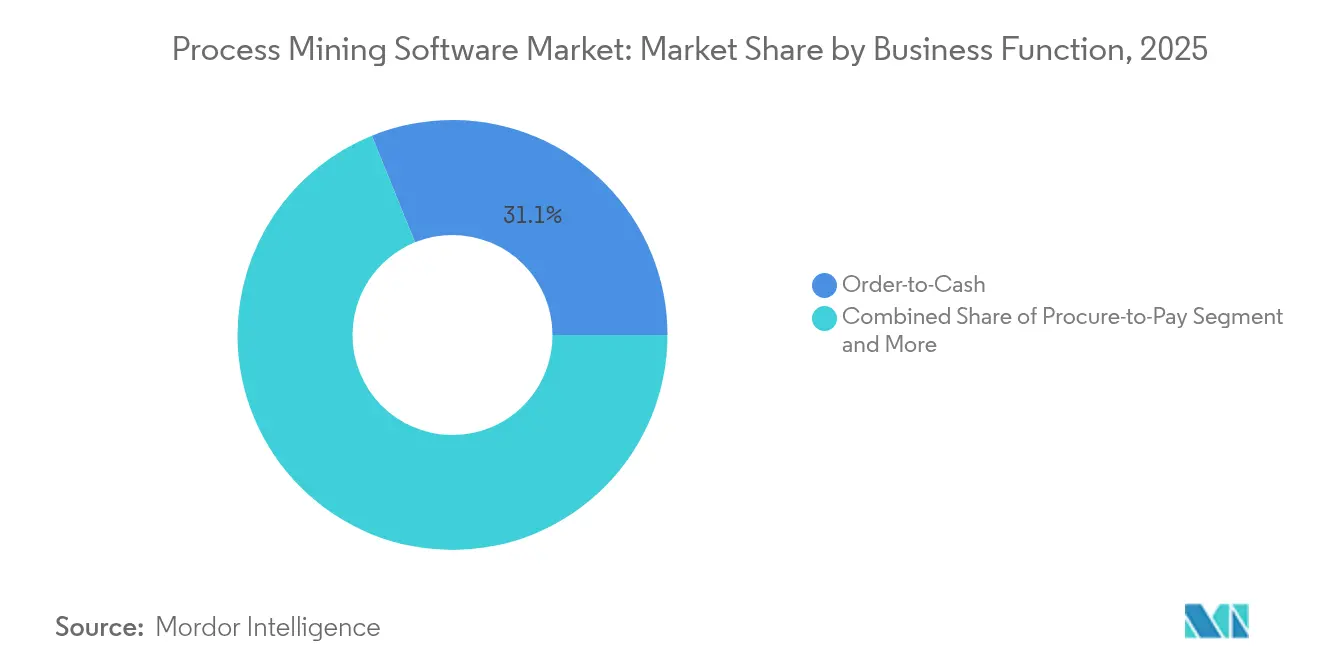
- By business function, Order-to-Cash held 31.12% revenue share in 2025; Customer Service & Support is growing fastest at 26.38% CAGR through 2031.
- By end-user industry, Banking, Financial Services & Insurance (BFSI) led with 23.40% share in 2025, whereas Healthcare is projected to climb at 24.62% CAGR to 2031.
- By geography, Europe commanded 44.20% of the process mining software market share in 2025; Asia-Pacific is accelerating at 24.91% CAGR to 2031.
Note: Market size and forecast figures in this report are generated using Mordor Intelligence’s proprietary estimation framework, updated with the latest available data and insights as of 2026.
Market Trends and Insights
Drivers Impact Analysis of Process Mining Software Market*
| Driver | ( ~ ) % Impact on CAGR Forecast | Geographic Relevance | Impact Timeline |
|---|---|---|---|
| Demand for digital transformation | +6.2% | Global, concentrated in North America & Europe | Medium term (2-4 years) |
| Rising need for compliance and auditing | +4.8% | Europe & North America, expanding to Asia-Pacific | Short term (≤ 2 years) |
| Integration with RPA and hyperautomation | +3.9% | Global, led by North America | Medium term (2-4 years) |
| Cloud-first deployment models | +2.7% | Global, highest uptake in Asia-Pacific | Short term (≤ 2 years) |
| Task-mining connectors enable SMB adoption | +1.4% | North America & Europe, emerging in Asia-Pacific | Long term (≥ 4 years) |
| ESG-driven supply-chain transparency | +0.8% | Europe & North America, regulatory spillover to Asia-Pacific | Long term (≥ 4 years) |
| Source: Mordor Intelligence | |||
Digital transformation mandates
Enterprises continue to place digital-transformation outcomes at the center of strategic agendas. As legacy workflow maps fail to capture real-world system interactions, the process mining software market benefits from tools that reconstruct end-to-end execution in near real time. NEC Corporation trimmed 700 hours of manual data handling after deploying Celonis, freeing staff for higher-value tasks while accelerating invoice approvals[1]Celonis, “NEC Drives Accounts Payable Excellence with Process Mining,” celonis.com. Organizations now see data-driven process intelligence as foundational to broader transformation programs rather than a niche analytics add-on.
Compliance and auditing requirements
Stringent regulations across finance, healthcare, and manufacturing propel demand for auditable process visibility. IBM Process Mining helped Credito Emiliano cut credit-card approval time from 4 days to 1 day while yielding annual savings of EUR 500,000 (USD 565,000) and ensuring rule adherence. Automated compliance monitoring lowers audit costs and provides a defensible audit trail, making process mining a preferred choice for organizations preparing for external reviews.
RPA integration and hyperautomation
Synergies between process mining and robotic process automation intensify because discovery analytics identify high-return automation candidates. UiPath’s platform unifies both capabilities, a factor that kept the company in the leadership quadrant of Everest Group’s 2025 assessment. Closed-loop optimization—from detection to execution—shortens deployment cycles and underpins enterprise hyperautomation roadmaps.
Cloud-first deployment
Cloud service models slash upfront infrastructure expense while offering elastic scale for event-log ingestion. Multi-tenant architectures also shorten proof-of-concept timelines. SAP Signavio’s 2024 cloud release underscored how platform vendors now position Software-as-a-Service as default, even for heavily regulated clients after achieving requisite security certifications.
Restraints Impact Analysis of Process Mining Software Market*
| Restraint | ( ~ ) % Impact on CAGR Forecast | Geographic Relevance | Impact Timeline |
|---|---|---|---|
| High implementation cost and data-privacy risk | -3.2% | Global, higher impact in cost-sensitive SMB segment | Short term (≤ 2 years) |
| Shortage of skilled process-mining analysts | -2.1% | Global, acute in Asia-Pacific emerging markets | Medium term (2-4 years) |
| Poor event-log quality in legacy OT/IT | -1.8% | Manufacturing-heavy regions with older systems | Long term (≥ 4 years) |
| Vendor lock-in via proprietary data models | -1.3% | Global, regulatory scrutiny in Europe | Medium term (2-4 years) |
| Source: Mordor Intelligence | |||
High implementation cost and privacy concerns
Total cost of ownership extends beyond software licenses to data integration, change-management, and governance layers. Smaller firms wrestle with budgeting for both technology and consultancy fees. Granular event logs often contain personally identifiable information, pushing organizations to invest in anonymization and role-based access controls to satisfy GDPR and similar statutes[3]arXiv, “Privacy Challenges in Process Mining: A Review of GDPR Impact,” arxiv.org. These additional safeguards lengthen project timelines and dilute near-term ROI.
Skills shortage
Effective process intelligence hinges on analysts who blend domain knowledge with data science proficiency. Talent scarcity drives external-consulting reliance, which in turn inflates project budgets. The supply-demand gap is especially pressing in developing Asia-Pacific markets where certified practitioners remain few, delaying large-scale rollouts and tempering the process mining software market’s near-term penetration rate.
*Our forecasts treat driver/restraint impacts as directional, not additive. The impact forecasts reflect baseline growth, mix effects, and variable interactions.
Process Mining Software Market Segment Analysis
By Component:
Services outpace solutionsSolution licenses generated 71.25% of 2025 revenue, securing a commanding position in the process mining software market. Yet Services are projected to climb at 35.12% CAGR, as enterprises seek bespoke implementation, training, and optimization assistance. The divergence underscores a maturation phase where realized value, not software features, differentiates vendors.
Services revenue grows through managed engagements that provide continuous monitoring and KPI recalibration. Consulting alliances, such as the Celonis–McKinsey tie-up, bundle analytics platforms with transformation playbooks, positioning professional-service arms as profit centers and reinforcing vendor-client lock-in for multi-year cycles.


By Deployment Mode:
Cloud dominance intensifiesCloud held 66.80% share in 2025 and is on track for 32.47% CAGR, whereas on-premises deployments recede amid cost and agility comparisons. The process mining software market size for cloud deployments could exceed USD 1.43 billion by 2031 if the forecast tracks to plan. Software-as-a-Service allows rapid iteration, real-time collaboration, and consumption-based pricing, attracting even regulated industries as platforms earn ISO 27001 and SOC 2 attestations.
Hybrid models remain relevant in data-sovereign jurisdictions, yet growing parity in security certifications steadily erodes the control advantage of on-premises setups. Vendors now release new AI features to cloud users first, incentivizing clients to migrate for early access.
By Business Function:
Customer-service accelerationOrder-to-Cash processes still anchor 31.12% of 2025 revenue, securing the largest slice of the process mining software market. However, Customer Service and Support functions are forecast to expand at 26.38% CAGR, reflecting a pivot toward experience-driven differentiation. Complex multi-channel interactions generate rich data trails that analytics engines convert into response-time and first-contact-resolution improvements.
Organizations also extend process intelligence to Procurement, Hire-to-Retire, and IT service-management workflows, signaling a future where operational silos are replaced by enterprise-wide visibility. This diversification supports recurring license growth and shields vendors from single-function dependency risks.
By End-user Industry:
Healthcare surgesBFSI maintained 23.40% share in 2025 on the strength of anti-money-laundering and credit-approval use cases. Yet Healthcare adoption is rising at 24.62% CAGR as providers pursue patient-pathway optimization and regulatory compliance. Studies published in BMC Medical Informatics and Decision Making highlight measurable wait-time reductions when process mining guides scheduling and resource allocation.
Manufacturing, IT and Telecom, and Public Sector entities also accelerate deployments to reconcile supply-chain disruptions and modernize citizen-service delivery. Industry diversity broadens the total addressable market and positions vendors for prolonged growth beyond early financial-services footholds.
Geography Analysis
Germany Process Mining Software Market
Europe led 2025 revenue owing to entrenched process culture and stringent compliance frameworks. German industrial firms—Siemens, BMW, Lufthansa—leverage process mining to harmonize global supply chains, illustrating how the process mining software market scales in complex manufacturing ecosystems. Continuous audit logging delivers dual benefits of risk mitigation and performance enhancement, making adoption a board-level priority.
APAC Process Mining Software Market
Asia-Pacific’s momentum rests on accelerated Industry 4.0 projects and expansion of digital-transformation budgets. Government incentives in Japan, China, and India partially subsidize factory modernization, which often includes process mining components to monitor throughput and quality. Vendors achieve rapid wins by bundling AI-driven anomaly detection tailored to local supply-chain structures.
North America Process Mining Software Market
North America remains a hotbed for product innovation, housing many platform-engineering headquarters and early-stage startups that inject new machine-learning features. Healthcare institutions capitalize on process mining to improve patient-flow efficiency under value-based-care models, creating a recurrent revenue stream for vendors with HIPAA-compliant offerings.

Competitive Landscape
The process mining software market is moderately concentrated. Celonis, UiPath, and IBM combined captured slightly above 40% of 2024 revenue. Celonis leverages its execution-management system to upsell orchestration modules, while UiPath’s unified automation suite deepens customer lock-in by merging discovery and execution capabilities. IBM differentiates through hybrid-cloud and mainframe connectors that resonate with highly regulated enterprises.
Specialists such as Apromore and QPR Software compete on open-source flexibility and niche vertical templates. Start-ups like Skan.ai introduce AI agents that auto-generate process maps without predefined event logs, appealing to customers with limited data maturity. Strategic alliances proliferate: Celonis joined Microsoft Fabric in 2025 to enrich embedded analytics, and Software AG divested integration assets to focus on ARIS, signaling portfolio realignments to capture higher-margin analytics revenue.
Legal skirmishes emerge around data ownership. Celonis’ 2025 lawsuit against SAP underscores buyer concerns over proprietary data models restricting cross-platform analytics, intensifying focus on open APIs and standardized connectors. Patent filings on data-quality monitoring and tamper-resistant logging, notably by Palantir, indicate that intellectual-property strategies are a pivotal competitive lever moving forward.
Process Mining Software Industry Leaders
IBM Corporation
Microsoft Corporation
SAP SE
Software AG
Celonis SE
- *Disclaimer: Major Players sorted in no particular order
Process Mining Software Market Companies Covered in this Report
- Celonis SE
- UiPath Inc.
- IBM Corp.
- Microsoft Corp.
- SAP SE (Signavio)
- Software AG
- Appian Corp.
- ABBYY Solutions Ltd.
- QPR Software Plc
- Apromore Pty Ltd.
- Pegasystems Inc.
- ServiceNow Inc.
- PAFnow (Process Analytics Factory)
- Fluxicon BV
- mindzie LLC
- Skan.ai
- kyp.ai GmbH
- PuzzleData Corp.
- Soroco Pte Ltd.
- Minit (Microsoft)

Recent Industry Developments in Process Mining Software Market
- June 2025: Celonis expanded collaboration with Microsoft to embed process intelligence into Microsoft Fabric, integrating analytics and operational data for unified insights.
- May 2025: Celonis partnered with Lobster to extend AI-driven process intelligence to broader enterprise-application ecosystems.
- March 2025: UiPath posted Q4 FY2025 revenue of USD 424 million and introduced Autopilot and Agent Builder features for AI-enhanced automation.
- January 2025: Celonis launched four new Platform Apps, including Claims Management Control Center and Software Development Lifecycle Management, to deliver out-of-the-box industry solutions.


Process Mining Software Market Report Scope and Research Methodology
Market Definition and Coverage
Our study defines the global process mining software market as the revenue generated by license- or subscription-based applications that automatically discover, monitor, and optimize business workflows by reading time-stamped event logs from ERP, CRM, and allied transactional systems. This includes both pure-play platforms and embedded suites that ship the same core functionality.
Scope Exclusion: Stand-alone task-mining tools, generic business-intelligence software, and unrelated professional services are outside the boundary.
Segments Covered in This Report
- By Component
- Solution
- Services
- By Deployment Mode
- Cloud
- On-Premises
- By Business Function
- Order-to-Cash
- Procure-to-Pay
- Customer Service and Support
- Others (Hire-to-Retire, etc.)
- By End-user Industry
- BFSI
- IT and Telecom
- Manufacturing
- Healthcare
- Logistics and Transportation
- Public Sector and Utilities
- By Geography
- North America
- United States
- Canada
- Mexico
- South America
- Brazil
- Argentina
- Rest of South America
- Europe
- United Kingdom
- Germany
- France
- Italy
- Spain
- Nordics
- Rest of Europe
- Middle East and Africa
- Middle East
- Saudi Arabia
- United Arab Emirates
- Turkey
- Rest of Middle East
- Africa
- South Africa
- Egypt
- Nigeria
- Rest of Africa
- Middle East
- Asia-Pacific
- China
- India
- Japan
- South Korea
- ASEAN
- Australia
- New Zealand
- Rest of Asia-Pacific
- North America
Data Sources, Market Sizing, and Validation
Primary Research
Mordor analysts held structured interviews with product managers at leading software houses, system integrators running live deployments across Europe, North America, and Asia-Pacific, and process-owner teams in BFSI, healthcare, and manufacturing. These conversations clarified average seat counts, license discounts, adoption hurdles, and regional demand pulses, letting us align assumptions with frontline reality.
Desk Research
We began with freely available macro and technology datasets from Eurostat, the U.S. Census ICT Survey, and the Bank for International Settlements, then layered in software usage ratios reported by trade groups such as the Business Software Alliance. Vendor footprints, pricing bands, and funding flows were mapped from 10-K filings, investor decks, Dow Jones Factiva archives, and patent families in Questel. Cloud workload splits and log-volume proxies were drawn from IDC tracker notes and GitHub public repositories. The sources cited here are illustrative; many other public records informed data collection and verification.
Market-Sizing & Forecasting
A top-down reconstruction starts with global enterprise-software outlays, which are apportioned using workflow-analytics penetration rates and cloud share. Results are cross-checked through selective bottom-up roll-ups that multiply sampled average selling prices by active user seats captured during primary work. Key model fingerprints include (i) percentage of enterprises running robotic-process-automation, (ii) median event-log size per process, (iii) cloud deployment ratio, and (iv) annual subscription price erosion. Forecasts for 2025-2030 rely on multivariate regression against GDP per employee, IT-spend intensity, and digital-maturity scores, with scenario analysis absorbing economic shocks. Data gaps in vendor roll-ups are bridged through triangulation with shipment records and channel checks.
Data Validation & Update Cycle
Outputs pass two analyst reviews, variance tests versus historical ratios, and anomaly scans against independent metrics. Reports refresh each year, with interim revisions if major M&A, funding rounds, or regulations materially alter demand so clients receive the latest view.
How Mordor Intelligence's Process Mining Software Market Size Compares to Other Published Estimates
Published estimates often diverge because firms bundle adjacent analytics tools, apply different average-price curves, or refresh at irregular intervals. Mordor's disciplined scoping, annual update rhythm, and mixed modeling produce a steadier reference point for planners.
The comparison shows that, by selecting a focused scope and validating every input, Mordor delivers a balanced, transparent baseline that decision-makers can trust.
Benchmark comparison
| Market Size | Anonymized source | Primary gap driver |
|---|---|---|
| USD 0.72 B (2025) | Mordor Intelligence | - |
| USD 2.46 B (2024) | Global Consultancy A | Bundles task-mining and consulting revenue; assumes rapid RPA-led uptake |
| USD 1.40 B (2024) | Industry Analyst Firm B | Uses list prices without regional discounts; counts cloud seats only |
| USD 1.80 B (2023) | Research Publisher C | Older baseline and linear CAGR; limited primary validation |
The comparison shows that, by selecting a focused scope and validating every input, Mordor delivers a balanced, transparent baseline that decision-makers can trust.


Key Questions Answered in the Report
What is the projected value of the process mining software market by 2031?
The market is expected to reach USD 2.01 billion by 2031, growing at a 18.64% CAGR.
Which deployment mode grows fastest?
Cloud deployments are expanding at 32.47% CAGR, outpacing on-premises alternatives due to scalability and lower upfront costs.
Why is healthcare adoption rising so quickly?
Healthcare providers use process mining to optimize patient pathways and meet stringent regulatory requirements, driving a 24.62% CAGR in the sector.
How do process mining and RPA work together?
Process mining uncovers automation candidates, while RPA executes those tasks, creating a feedback loop that speeds end-to-end workflow optimization.
What’s the biggest restraint hampering wider adoption?
High implementation costs combined with data-privacy compliance overhead pose the greatest short-term barrier, particularly for small and medium enterprises.
Which region is growing the fastest?
Asia-Pacific leads with a 24.91% CAGR, fueled by manufacturing modernization and government digitization initiatives.
Page last updated on:


