Complex Event Processing Market Size and Share
Market Overview
| Study Period | 2020 - 2031 |
|---|---|
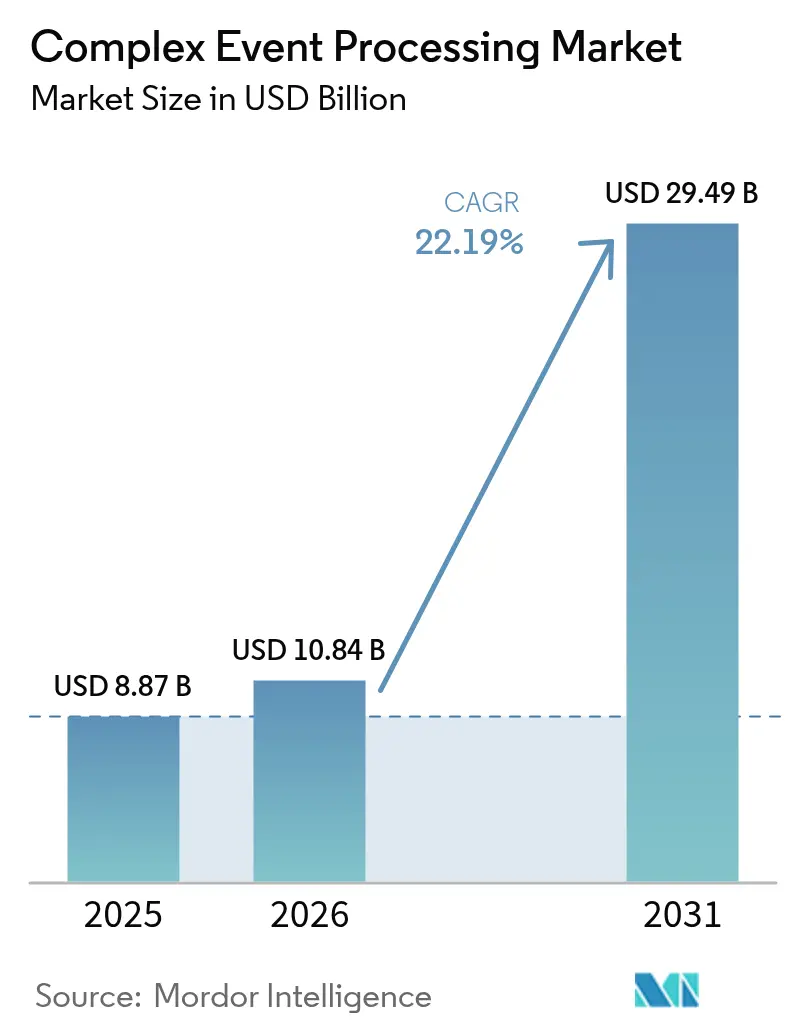
| Market Size (2026) | USD 10.84 Billion |
| Market Size (2031) | USD 29.49 Billion |
| Growth Rate (2026 - 2031) | 22.19% CAGR |
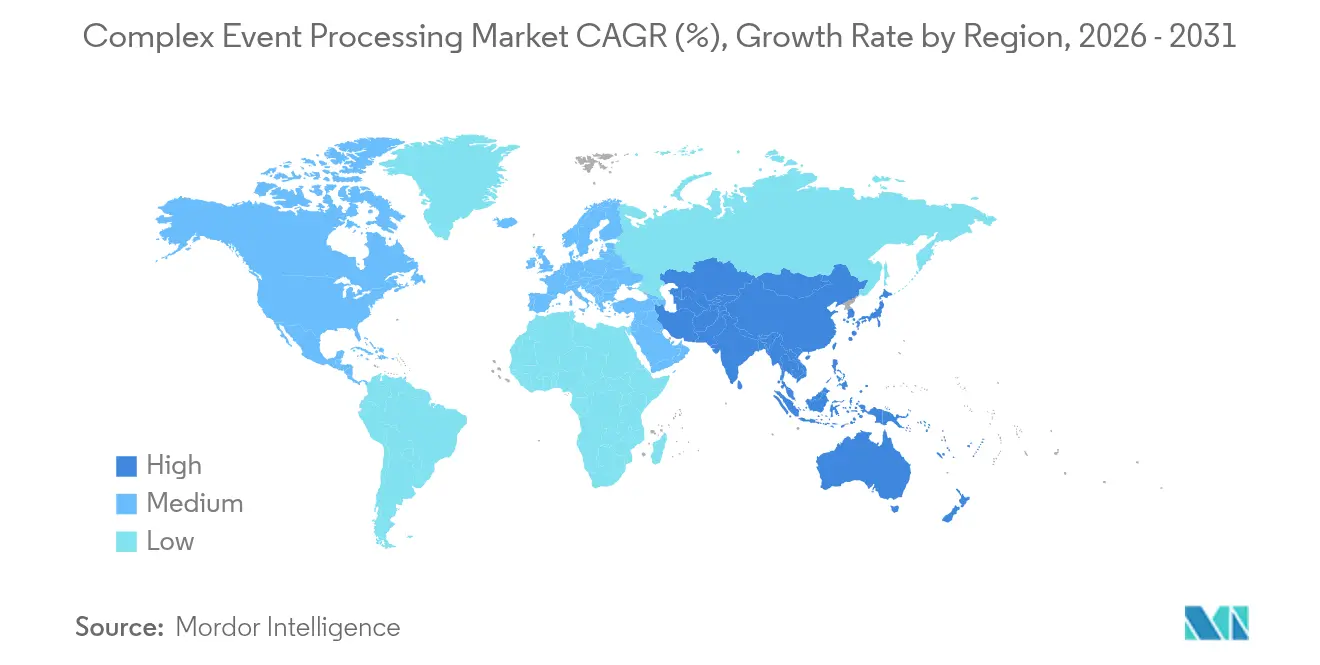
| Fastest Growing Market | Asia Pacific |
| Largest Market | North America |
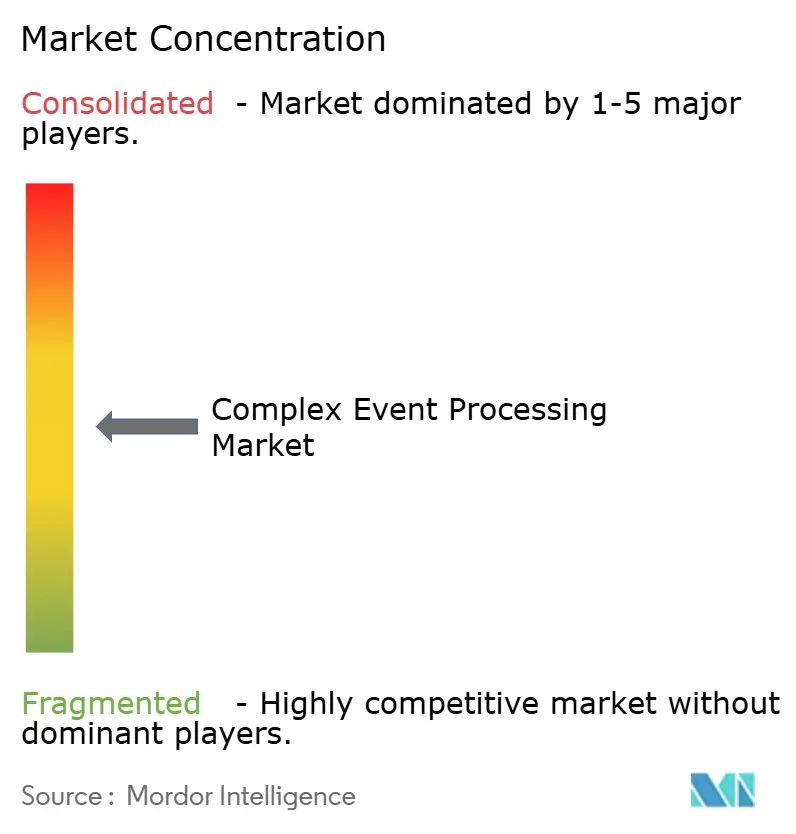
| Market Concentration | Medium |
Major Players *Disclaimer: Major Players sorted in no particular order Image © Mordor Intelligence. Reuse requires attribution under CC BY 4.0. | |
Complex Event Processing Market Analysis by Mordor Intelligence
The complex event processing market size is expected to grow from USD 8.87 billion in 2025 to USD 10.84 billion in 2026 and is forecast to reach USD 29.49 billion by 2031 at 22.19% CAGR over 2026-2031. Enterprises are accelerating investments to transition from batch reports to sub-millisecond intelligence that flags fraud, optimizes supply chains, and exploits fleeting arbitrage opportunities before competitors react. Cloud vendors embedding Apache Kafka, Apache Flink, and proprietary engines inside platform-as-a-service (PaaS) offerings captured a 56.27% share in 2024, highlighting how bundled infrastructure contracts influence buying decisions toward hyperscalers. Services generated 36.71% of 2024 revenue and are expected to grow the fastest at 23.44% through 2030, as integration skills, rather than software licenses, remain the primary spending line item. Telecommunication carriers, banks, and manufacturers now route millions of sensor, transaction, and network-probe events per second into low-latency pipelines, while strict data-residency rules push regulated industries toward hybrid patterns that synchronize on-premises clusters with cloud analytics. Competitive pressure remains intense as hyperscalers undercut pure-play vendors on price, yet whitespace persists in energy, defense, and pharmaceutical deployments that cannot fully shift to public cloud infrastructure.
Key Report Takeaways
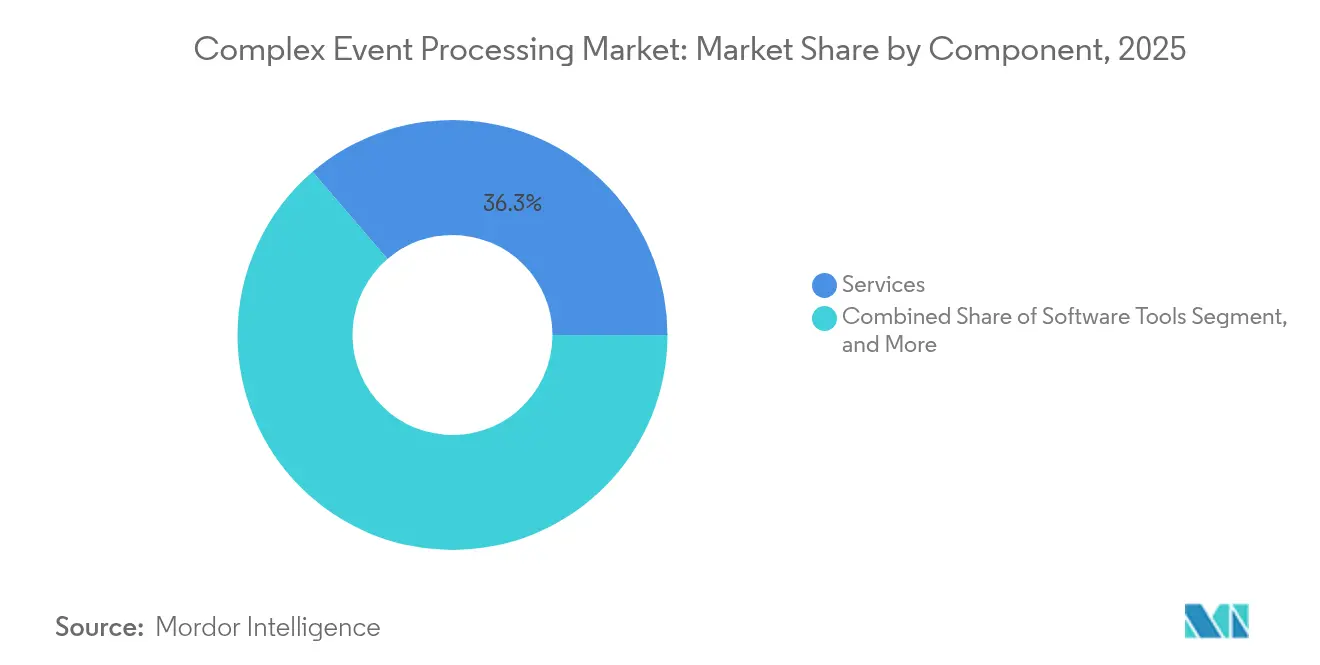
- By component, services held 36.28% of the complex event processing market share in 2025 and are forecast to expand at a 23.08% CAGR through 2031.
- By deployment mode, cloud accounted for 55.62% of the complex event processing market share in 2025, whereas hybrid implementations are set to record the highest CAGR of 23.10% between 2026 and 2031.
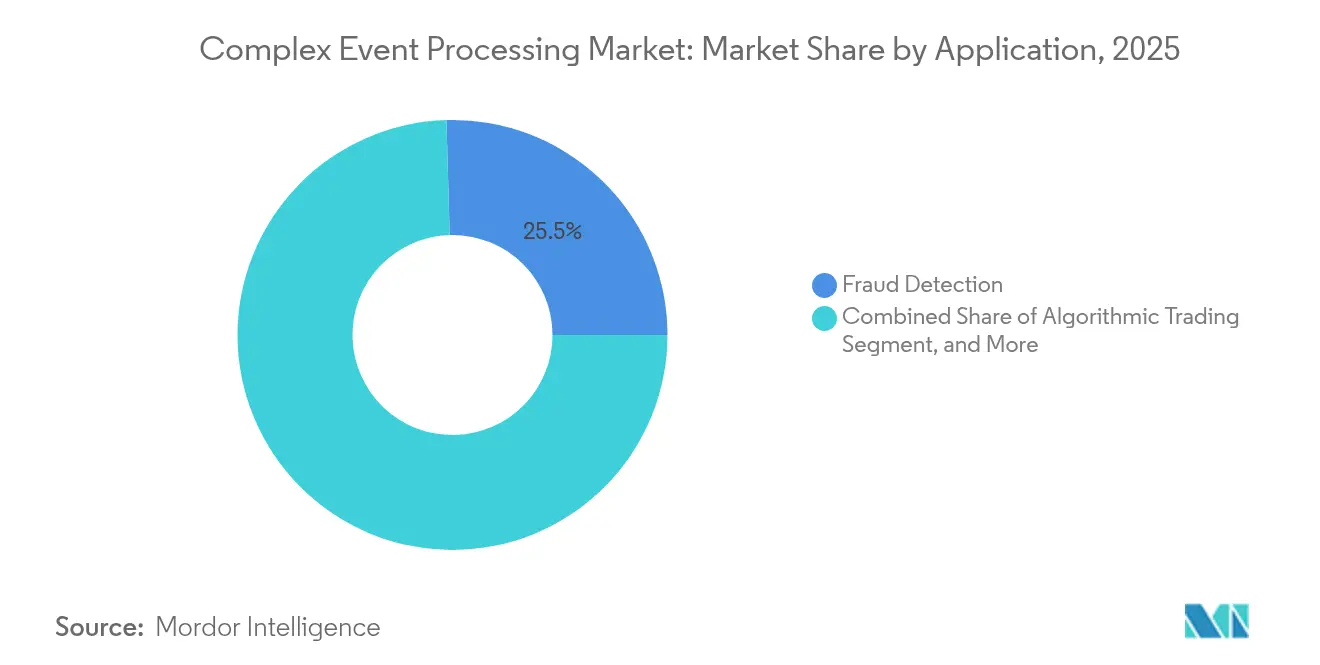
- By application, fraud detection led with 25.45% share of the complex event processing market size in 2025, while predictive maintenance is projected to register a 23.52% CAGR to 2031.
- By industry vertical, telecommunications captured a 27.45% of the complex event processing market share in 2025, and healthcare represents the fastest-growing vertical at a 22.96% CAGR over the forecast period.
- By geography, North America commanded a 37.62% of the complex event processing market share in 2025, yet the Asia Pacific is on track for the fastest expansion at a 23.48% CAGR through 2031.
Note: Market size and forecast figures in this report are generated using Mordor Intelligence’s proprietary estimation framework, updated with the latest available data and insights as of 2026.
Global Complex Event Processing Market Trends and Insights
Drivers Impact Analysis*
| Driver | (~) % Impact on CAGR Forecast | Geographic Relevance | Impact Timeline |
|---|---|---|---|
| Rising Adoption of Event-Driven Microservices Architectures | +4.2% | Global with focus in North America and Europe | Medium term (2-4 years) |
| Escalating IoT-Generated Data Volumes in Industrial Settings | +4.8% | Asia-Pacific core with spillover to U.S. manufacturing hubs | Long term (≥4 years) |
| Integration of AI and ML for Real-Time Predictive Analytics | +5.1% | Global led by North America and Europe | Medium term (2-4 years) |
| Surge in Instant Fraud Detection Requirements Across BFSI | +3.9% | Financial centers in North America, Europe and Asia-Pacific | Short term (≤2 years) |
| Expansion of Edge Computing for Ultra-Low Latency Processing | +3.6% | Asia-Pacific manufacturing, North America telecommunications | Medium term (2-4 years) |
| Venture Capital Inflows into Pure-Play Stream Processing Start-Ups | +1.2% | North America and Europe venture ecosystems | Short term (≤2 years) |
| Source: Mordor Intelligence | |||
Rising Adoption of Event-Driven Microservices Architectures
Firms decomposing monoliths into containerized workloads notice that synchronous REST calls propagate latency and cascading failure. Publishing events to durable logs lets downstream services replay missed data after recovery, trimming mean time to recovery and boosting resilience. Goldman Sachs disclosed that its event-driven settlement platform shortened equity trade clearance time by 40% compared with message-queue predecessors.[1]Goldman Sachs, “Technology Briefings 2024,” GOLDMANSACHS.COM Kubernetes-native operators such as Strimzi automate cluster rollout, yet tuning partitions, replication factors and consumer offsets still demands scarce distributed-systems expertise. As additional industries embrace microservices, steady demand for elastic, exactly-once pipelines sustains growth in the complex event processing market.
Escalating IoT-Generated Data Volumes in Industrial Settings
A modern automotive plant emits nearly 2 terabytes of real-time telemetry per day, overwhelming nightly ETL windows. Lightweight edge processors detect robotic welder temperatures that drift 3 °C above spec, enabling corrections before defects propagate. Siemens reported a 25% cut in unplanned downtime and EUR 18 million (USD 19.4 million) cost avoidance once vibration streams flowed into predictive algorithms.[2]Siemens, “Annual Report 2024,” SIEMENS.COM Edge gateways filter noise and forward only anomalies, conserving bandwidth and keeping response below 100 milliseconds. The surging sensor footprint anchors long-run momentum for the complex event processing market.
Integration of AI and ML for Real-Time Predictive Analytics
Machine-learning models embedded directly inside streaming engines now push scored outcomes to frontline systems within seconds. Retailers that price products dynamically every few seconds lift conversion rates by up to 20% versus batch updates, according to field deployments by a top U.S. big-box chain. Telecom operators detect denial-of-service signatures in flight and reroute packets before service degrades. Apache Flink integrations with MLflow simplify feature pipelines, yet regulators demand explainable AI and auditable event lineage, spurring vendors to enrich governance tooling. These developments reinforce demand across the complex event processing market.
Surge in Instant Fraud Detection Requirements Across BFSI
Card networks authorizing billions of daily transactions must decide in under 50 milliseconds whether to approve or challenge payments. Graph-based CEP platforms correlate device fingerprints and geolocation data, capturing fraud that classic rules miss. Mastercard stated real-time engines lowered false positives by 30% while catching 12% more fraudulent events, saving banks an estimated USD 1.2 billion annually.[3]Mastercard, “Investor Presentation 2024,” MASTERCARD.COM Compliance directives such as PSD2 reinforce the urgency, cementing BFSI as a cornerstone revenue stream for the complex event processing market.
Restraints Impact Analysis*
| Restraint | (~) % Impact on CAGR Forecast | Geographic Relevance | Impact Timeline |
|---|---|---|---|
| Shortage of Skilled Stream-Processing Engineers | -2.8% | Global, acute in North America and Europe | Long term (≥4 years) |
| Legacy System Integration Complexity in Large Enterprises | -2.4% | North America and Europe enterprise segments | Medium term (2-4 years) |
| Data Sovereignty and Privacy Compliance Hurdles | -1.9% | Europe (GDPR, NIS2), China (PIPL), cross-border deployments | Medium term (2-4 years) |
| High Cloud Consumption Costs for High-Throughput Workloads | -1.6% | Global, particularly cost-sensitive mid-market enterprises | Short term (≤2 years) |
| Source: Mordor Intelligence | |||
Shortage of Skilled Stream-Processing Engineers
Universities rarely teach event-time semantics, watermark strategies or partition-rebalance theory, forcing firms to rely on consultants or lengthy internal boot camps. A 2024 Confluent survey found 68% of data leaders citing talent scarcity as the top adoption barrier. Roles stay unfilled for six months or longer in many metros, inflating project budgets and delaying production timelines. Managed services partly mask complexity, yet boards remain cautious about outsourcing mission-critical event flows, prolonging the constraint.
Legacy System Integration Complexity in Large Enterprises
Mainframe programs, proprietary bus protocols and aging ERP packages seldom expose change logs in open formats. IBM documented that 73% of Fortune 500 transformation projects suffered 12-month overruns owing to integration hurdles. Point-to-point connectors grow brittle, replication latencies creep upward and data consistency risks escalate. The added middleware spend slows deal cycles and tempers growth for the complex event processing market even as overall demand climbs.
*Our forecasts treat driver/restraint impacts as directional, not additive. The impact forecasts reflect baseline growth, mix effects, and variable interactions.
Segment Analysis
By Component: Services Anchor Revenue and Skill Demand
Services generated 36.28% revenue in 2025, underscoring that architecture design, Kubernetes tuning and schema governance require expert support. Complex event processing market size for services is set to climb at a 23.08% CAGR through 2031 as enterprises engage system integrators to unify SCADA feeds, IoT telemetry and transactional databases. Typical engagements last 6-12 months and exceed USD 500,000, a billable base that dwarfs license fees. Platforms, including commercial Kafka, Flink, and vendor-specific engines, retain a healthy share; however, commoditization rises as hyperscalers integrate managed streaming into broader cloud bundles. Ancillary developer tools face even stronger price pressure because open-source dashboards and CLIs replicate core functionality.
Despite margin compression, platforms still matter. Enterprises standardizing on Apache Kafka or Pulsar treat the event backbone as foundational, allocating multiyear budgets for global replication, disaster recovery and exactly-once guarantees. Software tooling focuses on developer productivity, schema registries, IDE plugins, lineage trackers, but seldom represents more than 10% of annual spend. The defensibility of services therefore strengthens. Compliance audits, zero-trust security reviews and performance retuning under scaling load all demand human oversight, keeping services as the most reliable contributor to the complex event processing market.


By Deployment Mode: Cloud Leads, Hybrid Rises
Cloud accounted for 55.62% revenue in 2025 as AWS Managed Streaming for Apache Kafka, Azure Event Hubs and Google Pub/Sub removed the toil of provisioning clusters. Usage-based pricing benefits spiky workloads that spike during product launches or flash sales, and auto-scaling curbs idle spend. Yet telecom operators and capital-market venues with steady high throughput report monthly cloud bills topping USD 50,000, nudging repatriation to on-premises Kubernetes. Complex event processing market share for hybrid architectures will expand fastest at 23.10% because regulated industries need both sovereign control and elastic analytics.
Hybrid design creates complexity. Enterprises must synchronize ACLs, security tokens and schemas between plant-floor clusters and cloud data lakes. European NIS2 cybersecurity rules push critical-infrastructure operators to keep raw events inside national borders. Vendors respond by shipping cluster-aware connectors that propagate only sanitized aggregates across jurisdictional boundaries. Over the forecast horizon, the complex event processing market will witness cloud providers doubling down on managed connectors that ease hybrid orchestration, while hardware OEMs integrate lightweight Kafka nodes into industrial gateways to guarantee sub-10-millisecond latency at the edge.
By Application: Fraud Detection Dominates, Predictive Maintenance Accelerates
Fraud detection held 25.45% of 2025 revenue as issuers, acquirers and e-commerce gateways scored transactions in real time. Complex event processing market size for fraud detection continues to expand steadily but faces saturation in mature banking regions. Predictive maintenance, with a 23.52% forecast CAGR, represents the breakout opportunity. Manufacturers streaming vibration, acoustic and thermal data into anomaly detectors avoid catastrophic downtime and prolong asset life. Edge-resident processors flag bearing faults hours in advance, scheduling maintenance without halting production lines.
Network monitoring remains indispensable for telecoms correlating bandwidth, jitter and packet-loss events. Algorithmic trading stands apart for latency requirements measured in microseconds, prompting FPGA accelerators co-located in exchange data centers. Sales and marketing use tap clickstream events to trigger real-time price adjustments and personalized offers, achieving documented double-digit conversion lifts. Each use case demands tailored schemas, windows and join logic, so vendor roadmaps add vertical templates to lower development overhead. By 2030, predictive maintenance is expected to nearly match fraud detection in total revenue contribution, supporting another growth leg for the complex event processing market.
By Industry Vertical: Telecommunications Leads, Healthcare Surges
Telecom operators contributed 27.45% of 2025 spending, correlating call-detail records with network probes to route traffic efficiently and prevent SLA breaches. Yet subscriber churn and over-the-top competition compress carrier margins, motivating deeper analytics monetization strategies tied to real-time subscriber data. Healthcare, expanding at 22.96% CAGR, gains momentum from the European Health Data Space mandate requiring hospitals to stream electronic-health-record updates across borders. Continuous telemetry from wearables and bedside monitors feeds clinical decision support that spots sepsis hours sooner, saving lives and reducing cost.
Banking, financial services and insurance maintain steady demand for fraud interdiction and trade-surveillance pipelines. Retail and e-commerce rely on inventory synchronization and real-time recommendation loops. Manufacturing leverages predictive maintenance to offset skilled-labor shortages and cut scrap rates. Government and defense insist on air-gapped deployments to safeguard classified data, creating a durable niche for on-premises vendors. Energy and utilities correlate smart-meter feeds with grid conditions to balance supply and avoid blackouts. All told, vertical diversification cushions cyclical swings, making the complex event processing market resilient across macro scenarios.
Geography Analysis
North America controlled 37.62% revenue in 2025 thanks to Wall Street trading firms and Silicon Valley technology giants that pioneered algorithmic trading, fraud detection and clickstream personalization. Venture investors funneled billions into Confluent, Imply and Materialize, building a deep engineering talent pool. The California Consumer Privacy Act pushes real-time anonymization pipelines, expanding addressable demand. Yet a shortage of distributed-systems engineers remains acute, inflating salaries and delaying project start dates. Mid-market adopters often choose managed services to sidestep the talent gap, fueling service-provider growth inside the complex event processing market.
Asia Pacific registers the fastest growth at 23.48% CAGR through 2031. Chinese smart-city programs instrument traffic lights, utility meters and surveillance cameras, streaming petabytes of events to command centers. India’s Unified Payments Interface processed 11.4 billion transactions in October 2024, requiring sub-second clearing and fraud detection. Japanese factories automate predictive maintenance to offset workforce aging, and South Korean carriers use 5G network slicing that depends on real-time resource allocation. Sovereign data laws such as China’s PIPL force in-country clusters, raising duplicate infrastructure costs but simultaneously boosting local vendor revenues, further enlarging the complex event processing market.
Europe benefits from automotive telematics and industrial IoT rollouts in Germany, France and Sweden. GDPR, NIS2 and the pending AI Act impose strict lineage and consent obligations that favor platforms capably tracking every event transformation. Middle East smart-city megaprojects in Dubai and Saudi Arabia rely on streaming analytics to route traffic and optimize energy grids. Africa remains nascent yet shows promise through mobile-money ecosystems that transfer micro-payments in near real time. South America concentrates activity in Brazil, where banks deploy CEP engines to combat Pix payment fraud. Overall, regional variances in regulation, connectivity and industrial maturity ensure a diverse demand landscape that enriches the complex event processing market.

Regulatory Landscape
Complex event processing (CEP) deployments in regulated industries are increasingly shaped by cybersecurity, data-sovereignty, and auditability obligations that apply directly to streaming pipelines. In the United States, Federal Energy Regulatory Commission approval of updates tied to NERC Reliability Standard CIP-003-11 in 2026 raises expectations around access control and cyber hygiene for critical-infrastructure environments that rely on remote access and cloud-connected operations. China has also tightened requirements for government-data handling through GB/T 45396-2025 (effective October 2025), reinforcing localization and security controls that favor in-country processing and stronger governance at event ingress.
In Europe, Regulation (EU) 2024/1689 (EU AI Act) increases compliance pressure on event logging and record-keeping for high-risk AI systems, which translates into design requirements for tamper-resistant, append-only logs and lineage across data streams and model decisions. At the same time, the US Securities and Exchange Commission issued a 2026 Concept Release (Release No. 34-105251) to review the Consolidated Audit Trail and related data sources, keeping market participants focused on surveillance data integrity, cybersecurity, and cost, all of which affects how CEP platforms implement logging, retention, and controls across high-volume event pipelines.
Value Chain Analysis
The CEP value chain begins with event producers that generate high-velocity telemetry and transactions, including IoT sensors, industrial controllers, payment rails, and telecom network elements (for example, baseband units and radio remote heads). Events move through collection, transport, and normalization layers (agents, gateways, API/event hubs, and Kafka-class distributed logs), then into stream-processing and CEP engines (such as Apache Flink, Esper, and Siddhi) for windowing, correlation, and pattern detection. Packaged use cases and vertical applications (fraud decisioning, network monitoring, predictive maintenance, and observability) sit above the processing layer, while governance, security, and data-management tooling (schema registries, lineage, access controls, and policy enforcement) wraps the stack for regulated deployments.
System integrators, managed-service providers, and industry-specific platform vendors take on much of the implementation work because most enterprises need connectors to legacy systems and operational runbooks for 24x7 reliability. Telecom-oriented orchestration highlights where value accumulates from cross-domain integration rather than the CEP engine alone, as frameworks that converge OSS/BSS workflows target faster activation and fault isolation. On the infrastructure side, the supply ecosystem includes cloud providers that bundle managed streaming with broader platform contracts, along with hardware and edge vendors that bring ingestion and inference closer to where events originate. This reduces bandwidth and latency but increases the weight of lifecycle operations, security patching, and compliance reporting across hybrid estates.
Competitive Landscape
The top five suppliers, Confluent, AWS, IBM, Oracle, and Google, held most of the revenue in 2024, indicating moderate concentration. Hyperscalers embed managed streaming in broader infrastructure deals, slashing unit pricing and pressuring pure-play providers. Confluent differentiates via cloud-agnostic connectors and advanced governance, but must counter AWS’s aggressive pricing for comparable Kafka services. Hazelcast and Striim focus on low-latency in-memory processing and change-data-capture pipelines for legacy databases, filling niches that hyperscalers often overlook. Open-source projects Apache Flink, Pulsar, and Redpanda attract firms wary of vendor lock-in, yet they require operations talent, creating a parallel market for managed-service providers.
Competitive strategy increasingly tilts toward vertical solutions. Vendors ship healthcare interoperability packs, financial risk blueprints or industrial-protocol adapters to shorten time to value. Redpanda rewrote Kafka’s wire protocol in C++ to cut garbage-collection stalls and claims 10x efficiency gains, while Materialize presents PostgreSQL-compatible syntax to lower developer friction. Exactly-once semantics, sub-second end-to-end latency, and tight MLOps integration surface as core differentiators. Confluent filed patents around adaptive watermarking to balance latency and correctness under network jitter, signaling ongoing IP races. Despite pricing pressure, the complex event processing market retains room for specialists that innovate around performance, governance or domain expertise.
Over the forecast term, consolidation is likely. Hyperscalers may acquire boutique firms owning high-value connectors or domain know-how to embed within broader cloud suites. Meanwhile, sovereign-cloud providers and industrial automation giants explore OEM partnerships to bundle streaming engines directly into gateways and edge controllers. Such moves aim to lock in vertical segments where hyperscaler data centers cannot penetrate due to sovereignty or latency barriers. The resulting landscape will blend a few global platforms with multiple specialist vendors, sustaining competitive dynamism across the complex event processing market.
Complex Event Processing Industry Leaders
Confluent, Inc.
TIBCO Software Inc.
Software AG
Informatica Inc.
Hazelcast, Inc.
- *Disclaimer: Major Players sorted in no particular order

Market Opportunities and Future Outlook
Hybrid and sovereign deployments remain a key whitespace where buyers need consistent event governance across on-premises clusters and cloud analytics, driven by data-residency and audit mandates. The EU AI Act requirements around logging and record-keeping for high-risk AI systems create a tangible pull for CEP platforms that can provide tamper-resistant event logs, end-to-end lineage, and policy enforcement across streaming and model-inference workflows. This aligns with the report's emphasis on bundled cloud streaming services and the continued demand for services-led implementation to operationalize schemas, controls, and cross-environment synchronization.
A second opportunity centers on the convergence of CEP with agentic AI and real-time decision automation, where enterprises need to correlate tool calls, actions, and contextual signals in-flight rather than after the fact. In 2026, Databricks introduced Real-Time Mode for Apache Spark (Spark 4.1) to push millisecond-latency streaming without a separate engine, signaling continued competition around unified execution for streaming analytics. Product activity also points to demand for real-time AI context pipelines: RisingWave announced version 3.0 in July 2026 with additions such as Apache Iceberg V3 support and native pgvector integration, and AWS published an April 2026 reference architecture for an intelligent telecom mediation fabric built around Bedrock AgentCore and related agent frameworks. These updates support near-term commercial focus on CEP capabilities that combine low-latency processing with governance, connectors, and operational automation for telecom, industrial, and enterprise AI workloads.
Recent Industry Developments
- June 2026: Vantiq signed a strategic MOU with Daol TS to expand real-time, event-driven AI orchestration and an AI appliance business across South Korea, targeting manufacturing, logistics, public sector, and energy use cases. The partnership centers on integrated solution design and local delivery, strengthening go-to-market execution where deployments depend on ecosystem partners and vertical integration.
- May 2026: Confluent announced expanded Confluent Intelligence and Confluent Cloud capabilities aimed at making it easier to build and secure real-time AI. The update reinforces vendor differentiation around governed streaming data as AI context, tightening the link between CEP-style streaming pipelines, security controls, and enterprise AI consumption.
- October 2025: Confluent launched Confluent Intelligence to address the AI context gap by connecting governed, real-time business data streams to AI applications. The launch elevates competitive emphasis on packaging CEP-adjacent capabilities (stream processing, governance, and connectors) into AI-ready platform experiences rather than standalone event engines.


Research Methodology Framework and Report Scope
Market Definition and Coverage
For this study, the Complex Event Processing (CEP) market covers platforms, software tools, and services that detect patterns across high-volume event streams in near real time, and then trigger insights or actions for enterprise use cases.
Scope exclusions: We exclude general-purpose data storage, basic BI and reporting tools, and non-CEP streaming infrastructure that does not provide event pattern detection and rules-based processing as a primary function.
Segmentation Overview
- By Component
- Platforms
- Software Tools
- Services
- By Deployment Mode
- Cloud
- On-Premises
- Hybrid
- By Application
- Fraud Detection
- Network Monitoring
- Algorithmic Trading
- Predictive Maintenance
- Sales and Marketing
- Other Application
- By Industry Vertical
- Banking, Financial Services and Insurance
- Telecommunications
- Retail and E-Commerce
- Manufacturing
- Healthcare
- Government and Defense
- Energy and Utilities
- Other Industry Vertical
- By Geography
- North America
- United States
- Canada
- Mexico
- Europe
- Germany
- United Kingdom
- France
- Italy
- Rest of Europe
- Asia-Pacific
- China
- Japan
- India
- South Korea
- Australia
- Rest of Asia-Pacific
- Middle East and Africa
- Middle East
- Saudi Arabia
- United Arab Emirates
- Rest of Middle East
- Africa
- South Africa
- Egypt
- Rest of Africa
- Middle East
- South America
- Brazil
- Argentina
- Rest of South America
- North America
Data Sources, Market Sizing, and Validation
Desk Research
Desk research was used to set the base structure of the model and keep definitions consistent across regions and buyer types, before final numbers were locked in. We reviewed public materials such as US SEC filings (including 10-Ks), investor presentations, product documentation, and reputable press coverage to map typical pricing methods and how buyers purchase CEP, including licensing, subscriptions, and services.
We also used non-paywalled sources such as OECD and World Bank digital economy indicators, ITU connectivity statistics, NIST publications on event-driven systems and security practices, and Eurostat ICT adoption series to anchor regional demand direction and adoption readiness. For additional cross-checks, we referenced paid subscriptions for company financials and intelligence, news and financials, and patent databases to gauge R&D intensity and sanity-check vendor exposure to CEP. The desk sources mentioned above are illustrative only, and many other public references were also used for data collection, validation, and research clarification.
Primary Interviews and Surveys
Primary work focused on interviews and structured surveys with CEP software providers, system integrators, cloud partners, and enterprise users across major industries such as BFSI, telecom, retail, manufacturing, and healthcare. These discussions clarified how CEP sits inside broader real-time analytics programs, what drives attach rates for integration and support services, and how deployment choices (cloud, on-premises, hybrid) translate into different contract values by region.
Distribution of primary research fieldwork respondents
| Company type | Respondent position | Region |
|---|---|---|
| Top tier: 26% | CXOs: 14% | APAC: 45% |
| Mid tier: 58% | Functional/Unit leaders: 31% | EMEA: 34% |
| Smaller Players: 16% | Managers: 55% | Americas: 21% |
Market-Sizing & Forecasting
Sizing was built using a top-down and bottom-up approach, where regional enterprise IT spend patterns and real-time analytics adoption signals were used to reconstruct the CEP demand pool, which was then allocated into platforms, software tools, and services. We corroborated totals with selective bottom-up approximations such as sampled supplier revenue exposure to CEP, channel checks with integrators, and an ASP x volume view for common use cases, and then adjusted when mismatches persisted.
Key inputs that shaped the model included cloud versus on-premises deployment mix, service attach rates for integration and ongoing support, typical contract sizes by enterprise size, adoption by high-event-volume industries (such as BFSI and telecom), and use case weighting across fraud detection, network monitoring, algorithmic trading, predictive maintenance, and sales and marketing workflows. When direct values were not available for smaller geographies, we used proxy indicators such as ICT adoption, enterprise software spend growth, and the local mix of regulated industries, then rechecked those assumptions using primary inputs.
For forecasting, we used scenario analysis informed by expert consensus on how quickly CEP use cases expand with event-driven architecture adoption and cloud migration. Assumptions were refreshed for pricing progression, services penetration, and regional growth differences so the forecast remains repeatable and easy to trace to the variables used.
Data Validation & Update Cycle
Validation was done through multi-step checks that compare model outputs with independent signals, including vendor commentary trends, regional cloud adoption direction, and the implied spend per CEP deployment. Outliers were flagged, the drivers behind variance were reviewed by another analyst, and follow-up calls were triggered when a single assumption pushed the result outside a reasonable range.
The report is refreshed annually, and interim updates are made when material events occur, such as major pricing shifts, product bundling changes, or a clear demand shock in a key vertical. Before delivery, a final analyst pass is completed to ensure the latest public disclosures and primary feedback are reflected in the current-year estimate and the forecast path.
Mordor Intelligence's Global Complex Event Processing Cep Market Market Estimate Compared With Other Published Estimates
Published CEP market numbers can look far apart because the same term is used differently across studies, and because providers can bundle CEP with broader streaming analytics or integration work. Differences also show up when one estimate assumes a wider services envelope, and another keeps services limited to CEP-specific delivery.
Some outside estimates expand the scope to include adjacent event streaming and broader real-time analytics stacks, and then carry aggressive long-run growth rates into later years. For Mordor Intelligence, the count is limited to CEP platforms, software tools, and related services that are purchased specifically for event pattern detection and rules-based processing, which helps avoid pulling in general streaming infrastructure spend.
Benchmark comparison
| Source | Market Size | Gaps in Research Methodology |
|---|---|---|
| Mordor Intelligence | USD 10.84 B (2026) | |
| Industry Data Publisher A | USD 13.99 B (2026) | This figure is consistent with a wider inclusion set that can pull in broader streaming analytics and surrounding implementation spend, which increases the 2026 total versus a CEP-only count. |
| Industry Research Publisher B | USD 7.23 B (2025) | The lower value aligns with narrower counting that may focus mainly on CEP software revenue and a thinner services layer, and it is also anchored to a different base year. |
The table suggests the largest drivers of variation are scope expansion into adjacent streaming and analytics spend, plus differences in how services revenue is treated and how the base year is defined. By keeping the model tied to CEP purchase triggers, deployment mix, and use case demand checks that can be verified through interviews, the output stays transparent and repeatable for planning.


Key Questions Answered in the Report
How fast is global demand for complex event processing expected to grow?
The complex event processing market posts a 22.19% CAGR between 2026 and 2031, lifting value from USD 10.84 billion to USD 29.49 billion.
Which deployment pattern is expanding quickest?
Hybrid architectures that mix on-premises clusters with cloud analytics register the highest 23.10% CAGR through 2031 as regulated users seek sovereignty and elasticity.
What makes services the biggest spending category?
Enterprises lack in-house expertise to stitch legacy systems, SCADA feeds and modern stream processors, so services collected 36.28% of 2025 revenue and will grow at 23.08% annually.
Why is healthcare a high-growth vertical?
Real-time patient monitoring and new European Health Data Space rules push hospitals to stream electronic-health-record events, driving a 22.96% CAGR for healthcare deployments.
Which region shows the strongest growth potential?
Asia Pacific advances at 23.48% CAGR through 2031, fueled by Chinese smart-city projects and India’s high-volume digital payments infrastructure.
How concentrated is vendor competition?
The top five suppliers hold about 45% share, indicating moderate concentration and leaving room for specialists focused on low-latency edge processing or domain-specific connectors.
Page last updated on:


