
Potato Market Size and Share
Potato Market Analysis by Mordor Intelligence
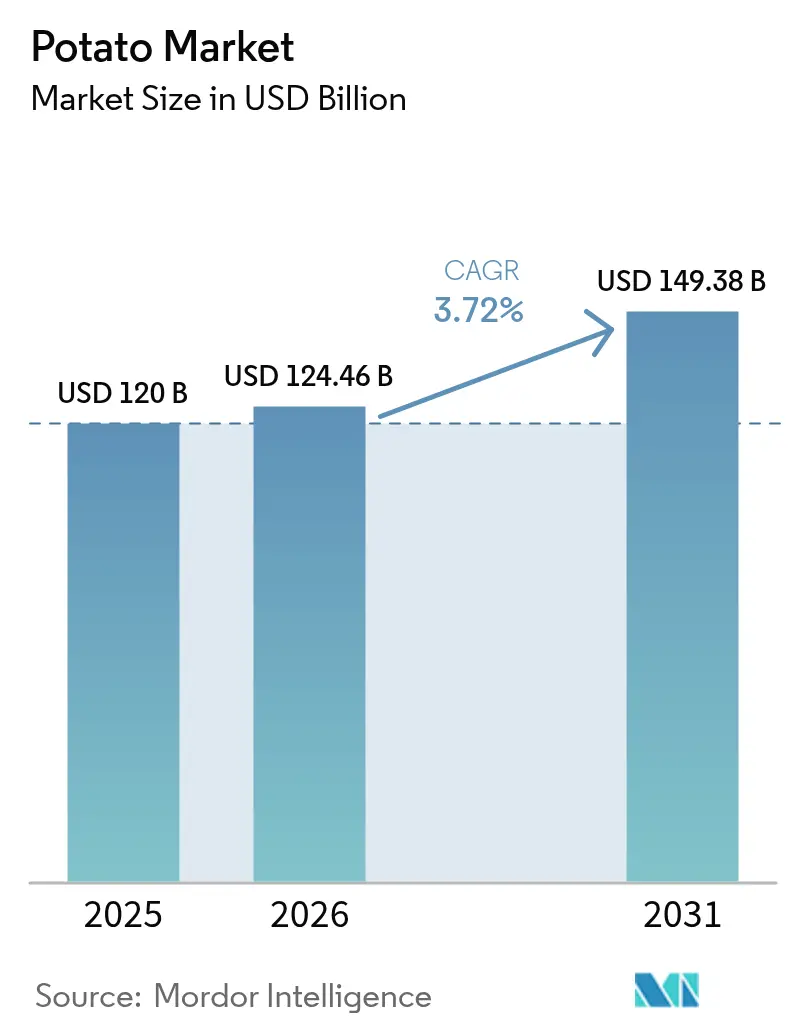
The potato market size was valued at USD 120 billion in 2025 and estimated to grow from USD 124.46 billion in 2026 to reach USD 149.38 billion by 2031, at a CAGR of 3.72% during the forecast period (2026-2031). Rising demand from frozen processors, aggressive quick-service restaurant expansion, and adoption of climate-smart agronomy keep volumes growing even as weather shocks and regulatory costs create pricing volatility. Processors are locating new plants closer to croplands to trim freight costs, while growers invest in controlled-environment seed systems that lift yields and reduce disease losses. Government-backed breeding programs for drought and heat tolerance are gaining momentum in Africa, South Asia, and parts of Europe. Together, these forces are reshaping trade flows, prompting exporters to pivot toward higher-value cuts and organic offerings as consumer preferences shift toward premium and sustainably grown products.
Key Report Takeaways
- By consumption volume, Asia-Pacific commanded 50.18% of global potato demand in 2025; Africa is anticipated to register the highest 5.08% CAGR through 2031.
Note: Market size and forecast figures in this report are generated using Mordor Intelligence’s proprietary estimation framework, updated with the latest available data and insights as of 2026.
Global Potato Market Trends and Insights
Drivers Impact Analysis*
| Driver | (%) Impact on CAGR Forecast | Geographic Relevance | Impact Timeline |
|---|---|---|---|
| Rising demand from frozen potato product processors | +1.2% | Asia-Pacific and North America | Medium term (2-4 years) |
| Growth in quick-service restaurant chains | +0.9% | Global focus on Asia-Pacific, Africa | Short term (≤ 2 years) |
| Government support for climate-smart potato breeding | +0.6% | Europe, Africa, South Asia | Long term (≥ 4 years) |
| Expansion of controlled-environment agriculture for seed potatoes | +0.4% | Europe and North America | Medium term (2-4 years) |
| Increasing adoption of regenerative farming practices | +0.2% | Global, priority in Africa and South America | Long term (≥ 4 years) |
| Emerging carbon-credit revenue streams for growers | +0.1% | Europe and North America, expanding globally | Long term (≥ 4 years) |
| Source: Mordor Intelligence | |||
Rising Demand From Frozen Potato Product Processors
Industrial buyers now account for 60% of commercial output in developed economies as retail and institutional frozen segments join traditional QSR channels. McCain Foods invested EUR 350 million (USD 385 million) in regenerative supply programs covering 71% of its growers to ensure a steady raw-material flow and sustainability credentials. Premium cuts and organic variants command price uplifts that offset higher input costs for growers. Co-location of plants near croplands is reducing cold-chain spending and shrinkage. The push for plant-based alternatives is actually boosting potato volumes because processors rely on its familiar texture and starch profile.
Growth in Quick-Service Restaurant Chains
McDonald’s plans 1,000 new Chinese outlets in 2025, aiming for 10,000 units by 2028, a 67% network jump that will intensify local procurement of fries-grade tubers. Chains are locking in multi-year contracts that reward growers meeting tight solids, sugar, and size specs, pushing specialty varieties into wider cultivation. Digital delivery platforms extend reach beyond shopping malls into suburban districts, raising throughput for central kitchens. Regional QSR operators across Africa and South America are replicating this model, creating cluster demand for frozen inputs and supporting new cold-storage projects.
Government Support for Climate-Smart Potato Breeding
Heat and drought cut Russia’s 2024 harvest by 14.5% to 7.3 million metric tons, highlighting the urgency of tolerant cultivars. CGIAR pipelines target 15-20% yield stability lifts under stress. Kenya’s adoption of biofortified lines raised farm output 30% while improving vitamin A intake. Regulatory fast-track channels in the EU now trim variety approval cycles to six years, accelerating commercialization. Integration of digital advisory tools speeds on-farm uptake and fertilizer optimization.
Expansion of Controlled-Environment Agriculture for Seed Potatoes
Aeroponic units yield 900 mini-tubers per m², versus 8 in soil, slashing land needs by 80%. Indonesia’s agriculture ministry reports break-even at 3,507 tubers with an R/C ratio of 1.4, making the tech viable for commercial adoption. Dutch firms lead rollouts, cutting generation time from 18 to 12 months and boosting disease-free certification rates. Precision nutrient delivery trims fertilizer use by 60% yet lifts output to 75%.
Restraints Impact Analysis*
| Restraint | (%) Impact on CAGR Forecast | Geographic Relevance | Impact Timeline |
|---|---|---|---|
| Volatility of farm-gate prices due to weather shocks | -0.8% | Global, with highest impact in Europe and North America | Short term (≤ 2 years) |
| Stringent pesticide residue regulations | -0.5% | Europe and North America, expanding to Asia-Pacific | Medium term (2-4 years) |
| Supply-chain disruptions from geopolitical conflicts | -0.6% | Europe and Asia-Pacific, with spillover effects globally | Short term (≤ 2 years) |
| Rising competition from alternative carbohydrates (e.g., cassava) | -0.4% | Asia-Pacific and Africa, with growing impact in South America | Long term (≥ 4 years) |
| Source: Mordor Intelligence | |||
Volatility of Farm-Gate Prices Due to Weather Shocks
European prices jumped 23% in 2024 after drought curbed yields, forcing buyers to seek imports at premiums[1]Source: European Commission, “Agricultural Price Report 2024,” ec.europa.eu. Russia’s shortfall redirected flows from China, whose exports leaped fivefold to 46.7 thousand t, demonstrating how regional shocks echo through global trade. Insurance and forward contracts partly buffer risk, but coverage gaps persist in emerging markets where exposure is greatest.
Stringent Pesticide Residue Regulations
EU limits on glyphosate and neonicotinoids lifted rejection rates for non-compliant shipments and pushed exporters to spend USD 500 per consignment on residue testing[2]Source: European Food Safety Authority, “Pesticide Residue Monitoring 2024,” efsa.europa.eu . Smallholders face cash-flow strain during the two-to-three-year transition to organic or integrated pest programs, which may initially dent yields by 10-15%. Divergent maximum residue levels across markets complicate compliance for global traders.
*Our forecasts treat driver/restraint impacts as directional, not additive. The impact forecasts reflect baseline growth, mix effects, and variable interactions.
Geography Analysis
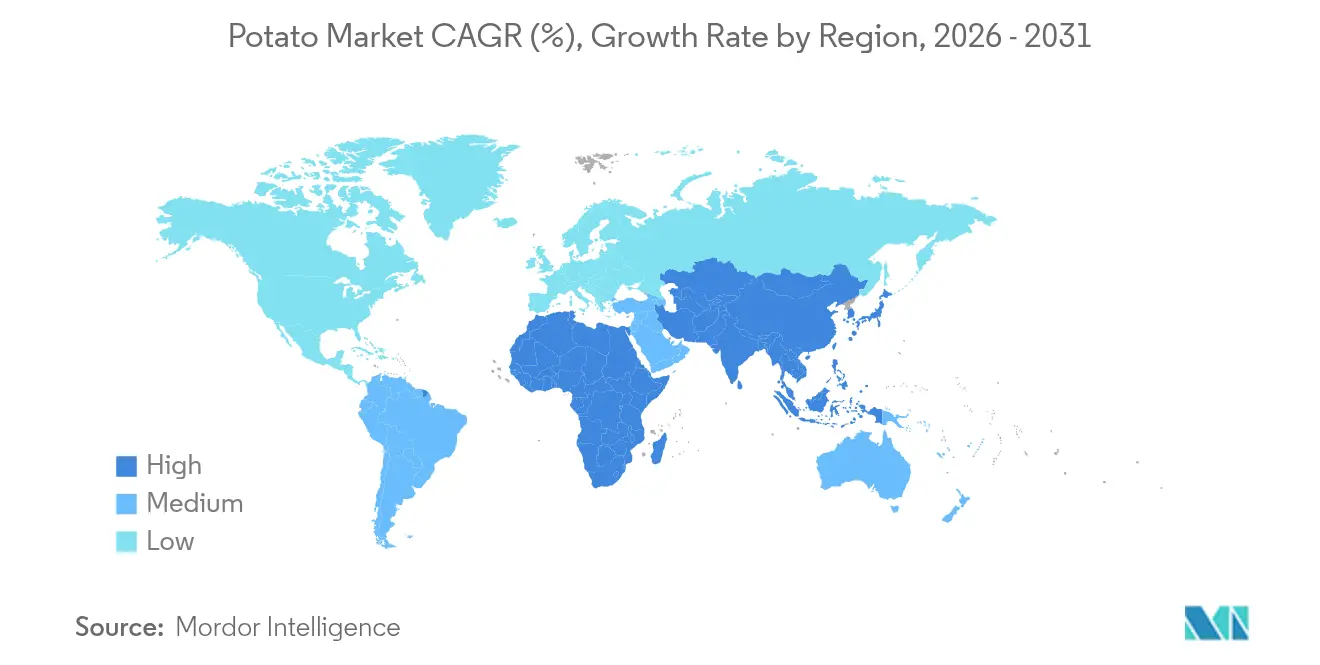
Asia-Pacific retains 50.18% of worldwide potato consumption in 2025. China’s 95.6 million-ton crop and India’s surge in new processing lines approved by the Ministry of Food Processing Industries underpin the region’s dominance and accelerate demand for on-farm cold storage and logistics upgrades. The Ministry of Commerce confirmed that McDonald’s China subsidiary secured foreign-investment clearance for a network expansion to 10,000 outlets by 2028, a move anticipated to lock in long-term contracts for fries-grade potatoes Regional growth over the next five years will rely on the rollout of aeroponic seed units and sensor platforms to smaller producers, initiatives already funded through the Asian Development Bank’s AgriTech corridor program.
Africa delivers the fastest regional gains, with 5.08% CAGR through 2031. Nigeria’s National Bureau of Statistics attributes rising output to government-financed irrigation corridors in Kaduna and Plateau States that lifted yields 18% over two seasons. Kenya’s Ministry of Agriculture reports that distribution of foundation seed from aeroponic hubs increased certified-seed use among smallholders from 5% to 18% in 2024, translating into a 22% yield jump. South Africa’s Department of Trade, Industry and Competition cleared two greenfield processing plants that will double national frozen-fries capacity by 2026, while Egypt’s General Authority for Investment approved incentives that encourage multinational processors to locate cold-chain warehouses near Red Sea ports. Sustained growth hinges on timely road and cold-storage upgrades under the African Development Bank’s Special Agro-Industrial Processing Zone program.
Russia’s Federal State Statistics Service reported that adverse weather cut the 2024 harvest 14.5% to 7.3 million metric tons, underscoring climate risk across the wider region. Maintaining competitiveness through 2030 will require deeper uptake of regenerative farming methods supported by the EU Common Agricultural Policy and rapid deployment of heat-tolerant cultivars certified by the Community Plant Variety Office.


Regulatory Landscape
Global potato trade is shaped mainly by phytosanitary controls, seed certification rules, and pesticide-residue compliance, with Europe applying some of the strictest operational benchmarks. In Europe, the RUCIP 2025 rules for inter-European potato trade became effective in October 2025, formalizing trade practices (including expert assessment and arbitration) that affect contract execution and dispute resolution for ware and processing potatoes across borders.
Phytosanitary risk management functions as a key non-tariff barrier between seed and ware movements. The European Commission implemented temporary origin-specific measures for Egyptian potato tubers through Implementing Regulation (EU) 2025/1289 (July 2025), and later refined plant-health implementation detail via Implementing Regulation (EU) 2026/1110 (May 2026) on exemptions tied to regulated non-quarantine pests (RNQPs) for specific plants for planting. In the United Kingdom, the Department for Business and Trade updated phytosanitary controls for seed potatoes, with revised import footnotes for commodity code 0701100000 effective 20 April 2026, while the United States continues to route new commodity access through USDA APHIS pest risk analysis and public comment processes before authorizing entry.
Market Opportunities and Future Outlook
Processing-led capacity additions and tighter farmer-linked procurement models are expanding demand for fries-grade and specialty potatoes, especially in emerging markets building domestic frozen supply. In India, HyFun Foods announced a USD 108 million (INR 900 crore) investment in March 2026 for a new processing plant in North Gujarat to increase French fries and potato specialty capacity by late 2026, while 360 ONE Asset invested USD 70 million (January 2026) in Iscon Balaji Foods to support capacity expansion, cold chain infrastructure, and farmer-linked supply chain development. These steps create room for contract farming, storage, and grading services, and they bring adoption of controlled-environment seed systems and varietal specialization closer to processors.
As standards tighten and trade routes shift, risk-management and compliance infrastructure also becomes an actionable opportunity. The first complete rewrite of the UNECE Seed Potato Standard (S-1) in 2025, along with its promotion to a multi-country audience in March 2026, reinforces momentum for harmonized seed language, traceability, and labeling, which tends to favor suppliers that can document certification and plant-health status. At the same time, market participants are adjusting to pricing and hedging constraints, including the European Energy Exchange decision to close its processing potato futures contracts effective early June 2026. That change increases the relevance of alternative contracting structures, such as multi-year supply agreements, indexation, and tighter quality-linked premiums, and it supports the case for digital agronomy tools that improve solids consistency while reducing residue and rejection risk.
Recent Industry Developments
- July 2026: Agristo held a groundbreaking ceremony for its first US potato processing facility in Grand Forks, North Dakota. The project indicates a major geographic expansion of large-scale frozen potato processing capacity into the United States and reworks long-term raw potato sourcing and logistics planning around a new regional hub.
- June 2026: InvestIndustrial (through Kiremko, Idaho Steel, and Reyco) acquired Tummers Group and Van der Giessen. The combination broadens integrated processing-equipment capabilities for potato lines, supporting faster turnkey plant delivery and lifecycle service for processors expanding fries, flakes, and specialty output.
- December 2024: McCain Foods completed its EUR 350 million regenerative agriculture rollout covering 71% of its growers. The program deepens supply-chain requirements for verified on-farm practices and gives large buyers a clearer pathway to standardize sustainability-linked procurement across contracted potato acres.


Research Methodology Framework and Report Scope
Market Definition and Coverage
For this study, the potato market is measured as the value and volume of potatoes traded and consumed as a raw agricultural commodity across major producing and consuming regions, with pricing interpreted through the prevailing trade and wholesale context.
Scope exclusions: Value added processed products (such as chips, fries, flakes, and starch derivatives) are not counted as part of the core potato market value.
Segmentation Overview
- By Geography (Production Analysis (Volume), Consumption Analysis (Volume and Value), Import Analysis (Volume and Value), Export Analysis (Volume and Value), and Price Trend Analysis)
- North America
- United States
- Canada
- Mexico
- South America
- Brazil
- Argentina
- Europe
- Russia
- France
- United Kingdom
- Italy
- Germany
- Spain
- Belgium
- Netherlands
- Asia-Pacific
- China
- Japan
- India
- Middle East
- Turkey
- Iran
- Africa
- South Africa
- Egypt
- North America
Data Sources, Market Sizing, and Validation
Desk Research
Desk work starts by mapping the global potato supply and demand picture, and then checking how trade flows and prices behave across seasons and regions. Public datasets are used to anchor the model, such as FAOSTAT for country production and yield, UN Comtrade for import and export values and volumes, and national agriculture statistics (for example USDA and similar agencies in Europe and Asia) for acreage, stocks, and utilization.
We also review sources such as trade and grower association publications, peer reviewed agronomy and post-harvest studies, and customs and port updates that describe disruptions. Company filings and investor presentations from large farming, storage, and trading groups help confirm commercial realities, while an import and export shipment-level database and a company financials and intelligence subscription are used selectively to sanity-check trade intensity and price points. These desk research sources are illustrative, and other public and paid sources were also referenced to collect data, validate it, and clarify open questions.
Primary Interviews and Surveys
Primary work focused on conversations and surveys with growers, aggregators, cold storage operators, exporters and importers, and large buyers that purchase potatoes for fresh distribution and for processing inputs. These interviews were used to confirm harvest timing, grade splits, storage loss assumptions, and typical price realization by region, then to stress-test trade and consumption signals when desk data did not fully explain year-to-year changes.
Distribution of primary research fieldwork respondents
| Company type | Respondent position | Region |
|---|---|---|
| Top tier: 38% | CXOs: 12% | APAC: 41% |
| Mid tier: 46% | Functional/Unit leaders: 29% | EMEA: 37% |
| Smaller Players: 16% | Managers: 59% | Americas: 22% |
Market-Sizing & Forecasting
Sizing starts from a top-down reconstruction that links official production and trade statistics to implied availability, and then to consumption value using region-specific price trend series. Because potatoes are a seasonal crop, the model is adjusted for storage carryover and loss rates so supply signals do not get overstated in bumper years.
Key inputs include harvested area and yield per hectare, export and import volumes with unit values, wholesale and farmgate price direction where available, and changes in stocks and utilization (fresh versus processing pull where it affects raw potato demand). Where data gaps exist, proxy indicators from similar neighboring markets and expert ranges from interviews are applied, and then revisited during validation.
For forecasting, scenario analysis is used around weather driven yield swings and trade policy sensitivity, and then smoothed with trend-based techniques so the curve does not overreact to a single season. The output is corroborated through selective bottom-up checks, such as sampled price times volume calculations in key countries and channel checks on traded volumes, which are then used to refine the final totals.
Data Validation & Update Cycle
Checks are done in layers so the totals remain consistent with real-world signals. We compare value outputs against independent metrics like unit values from trade data, major producing-country price movements, and noticeable shifts in import dependency, then investigate sharp jumps that do not match crop or trade narratives.
Before sign-off, the work goes through multi-step analyst reviews, followed by targeted re-contacts when assumptions around losses, pricing, or grade mix appear to be driving outsized changes. The report is refreshed annually, with interim updates when material events occur, and a final pre-delivery review is completed so the numbers reflect the latest available releases.
Mordor Intelligence's Potato Market Size Measured Against Other Published Estimates
Published potato market values often do not match because the underlying price basis, included flows, and even the year used as the starting point can vary across sources. Differences also show up when some estimates lean heavily on production value, while others put more weight on trade unit values or wholesale pricing.
The main gap comes from whether the value is framed at producer and importer wholesale prices or reconstructed from consumption and trade value signals, and then cross-checked against volumes and price trends, which is how Mordor Intelligence treats the 2026 total. Other gaps are created by currency timing, how stock changes and storage losses are treated in supply availability, and whether the estimate quietly blends in downstream processed categories that expand the figure beyond the raw commodity market.
Benchmark comparison
| Source | Market Size | Gaps in Research Methodology |
|---|---|---|
| Mordor Intelligence | USD 124.46 B (2026) | |
| Industry Data Publisher A | USD 111.21 B (2024) | Uses an earlier base year and does not clearly state the pricing basis or what is included, which can understate the market when prices rise and the scope is not consistently tied to trade and price trend checks. |
| Trade Analytics Provider B | USD 135.10 B (2024) | Values the market using nominal wholesale revenues of producers and importers, which can differ from a consumption and trade-reconciled build when regional price realization, stock changes, and loss assumptions are applied. |
Taken together, the spread is mainly explained by pricing level differences and by how each publisher connects volume to value in years where prices and trade mix shift. By keeping the calculation traceable to production, trade, and price signals, and then validating the result through expert checks, the methodology produces a balanced figure that can be updated as new crop and trade data is released.


Key Questions Answered in the Report
How large is the potato market in 2026?
The potato market size reached USD 124.46 billion in 2026 and is forecast to grow at a 3.72% CAGR to reach USD 149.38 billion by 2031.
Which region leads global consumption?
Asia-Pacific holds the largest consumption share at 50.18%, powered by large-scale production in China and India.
Why do processors favor contract farming?
Contracts secure uniform tuber quality, lower procurement risk, and allow processors to align agronomic practices with sustainability pledges.
What new industrial uses are emerging?
Potato starch is being blended into bio-plastic resins for compostable cutlery and packaging, offering processors a route to diversify beyond food.
Page last updated on:




