Alfalfa Market Size and Share
Market Overview
| Study Period | 2021 - 2031 |
|---|---|
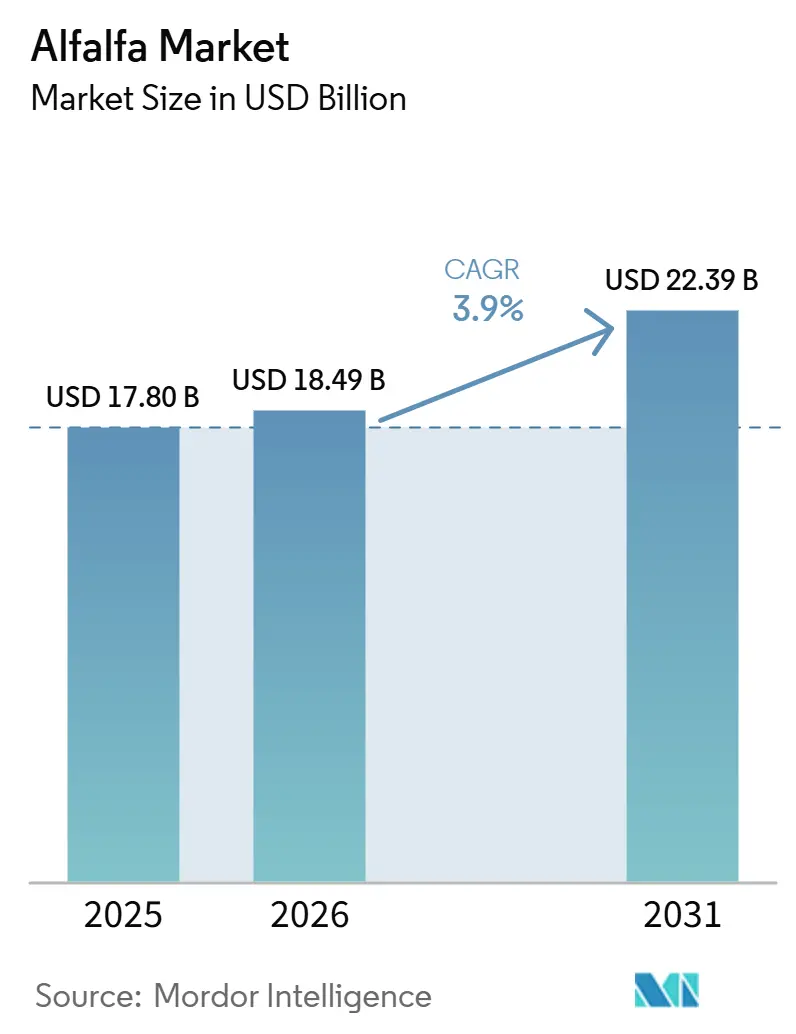
| Market Size (2026) | USD 18.49 Billion |
| Market Size (2031) | USD 22.39 Billion |
| Growth Rate (2026 - 2031) | 3.90% CAGR |
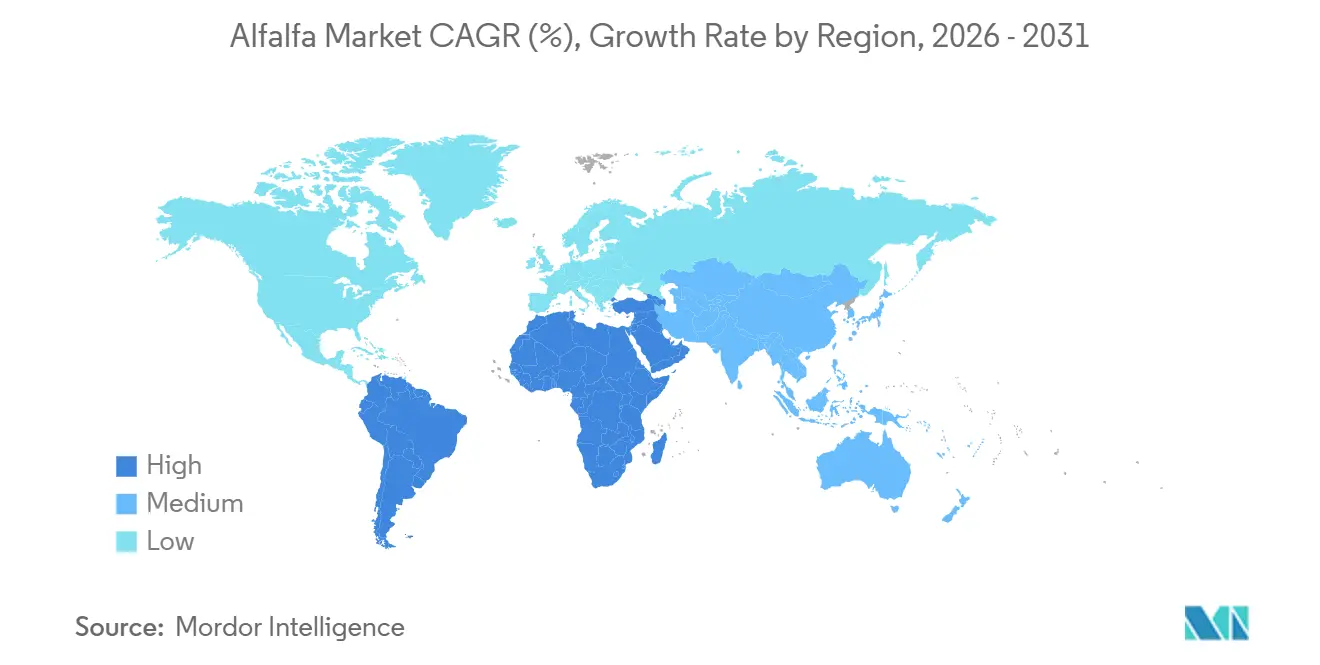
| Fastest Growing Market | Asia-Pacific |
| Largest Market | North America |
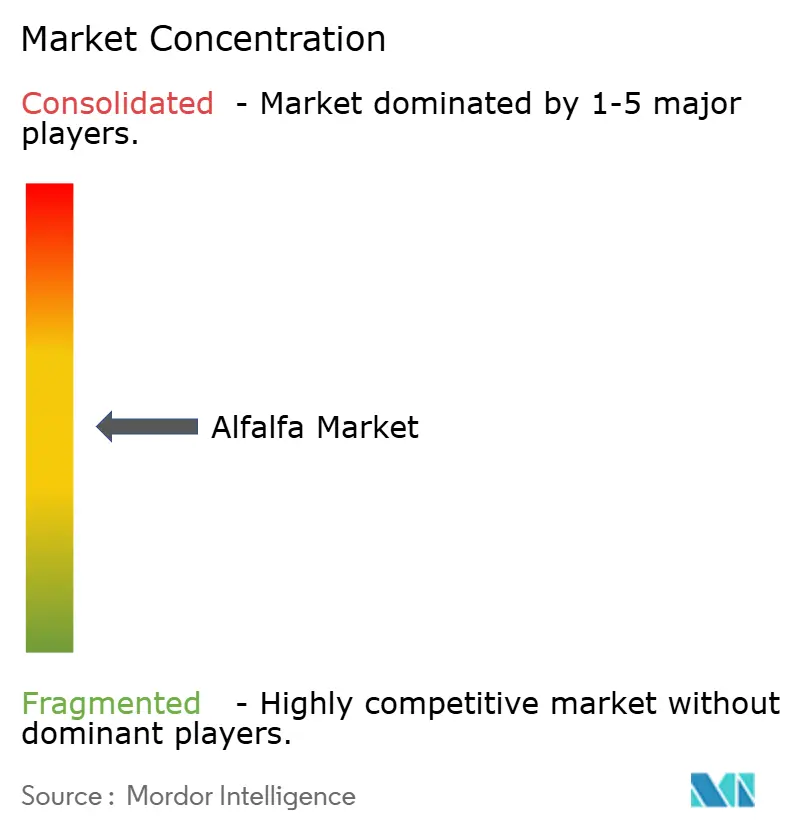
| Market Concentration | Medium |
Major Players
*Disclaimer: Major Players sorted in no particular order Image © Mordor Intelligence. Reuse requires attribution under CC BY 4.0. |
|
Alfalfa Market Analysis by Mordor Intelligence
The alfalfa market size is valued at USD 17.80 billion in 2025 and is projected to grow from USD 18.49 billion in 2026 to USD 22.39 billion by 2031, registering a CAGR of 3.90% during the forecast period (2026-2031). The market remains closely tied to steady forage demand from commercial dairy and livestock systems, where protein density and ration consistency carry greater importance than simple tonnage growth. Premium contract buying continues to support market value, as buyers pay higher prices for traceable, protein-consistent forage that meets formal feed specifications. Rotation economics also support the alfalfa market, as nitrogen fixation and soil carbon benefits improve farm returns beyond direct feed sales. The anticipated 2025 tariff shock between the United States and China is anticipated to push traders toward multi-origin sourcing, faster rerouting, and tighter export planning, increasing the value of logistics flexibility in the alfalfa market. Water policy is emerging as the clearest supply constraint. However, this pressure is also creating opportunities for growers and traders with secure water access, diversified sourcing, and premium quality control to strengthen their position in the market.
Key Report Takeaways
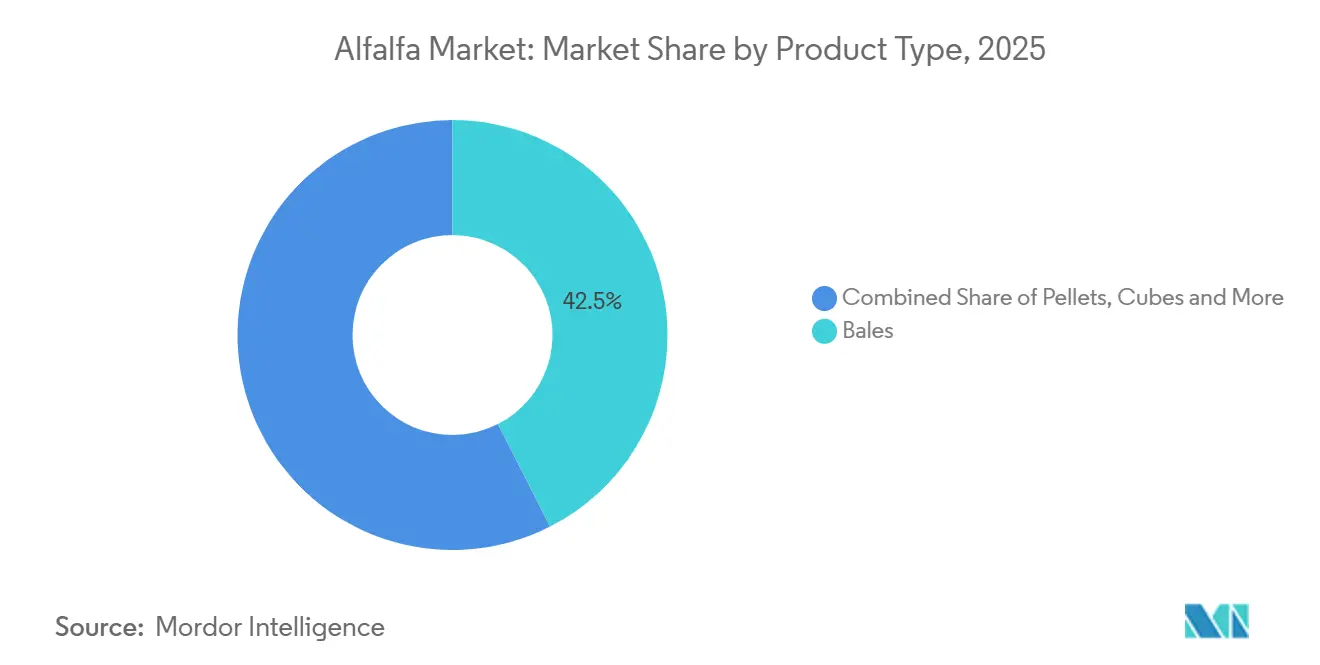
- By product type, bales accounted for 42.5% of the alfalfa market share in 2025, while pellets are projected to grow at 8.4% CAGR between 2026 and 2031.
- By application, dairy cattle feed accounted for 52.2% of the alfalfa market size in 2025, while equine feed is projected to expand at an 8.5% CAGR between 2026 and 2031.
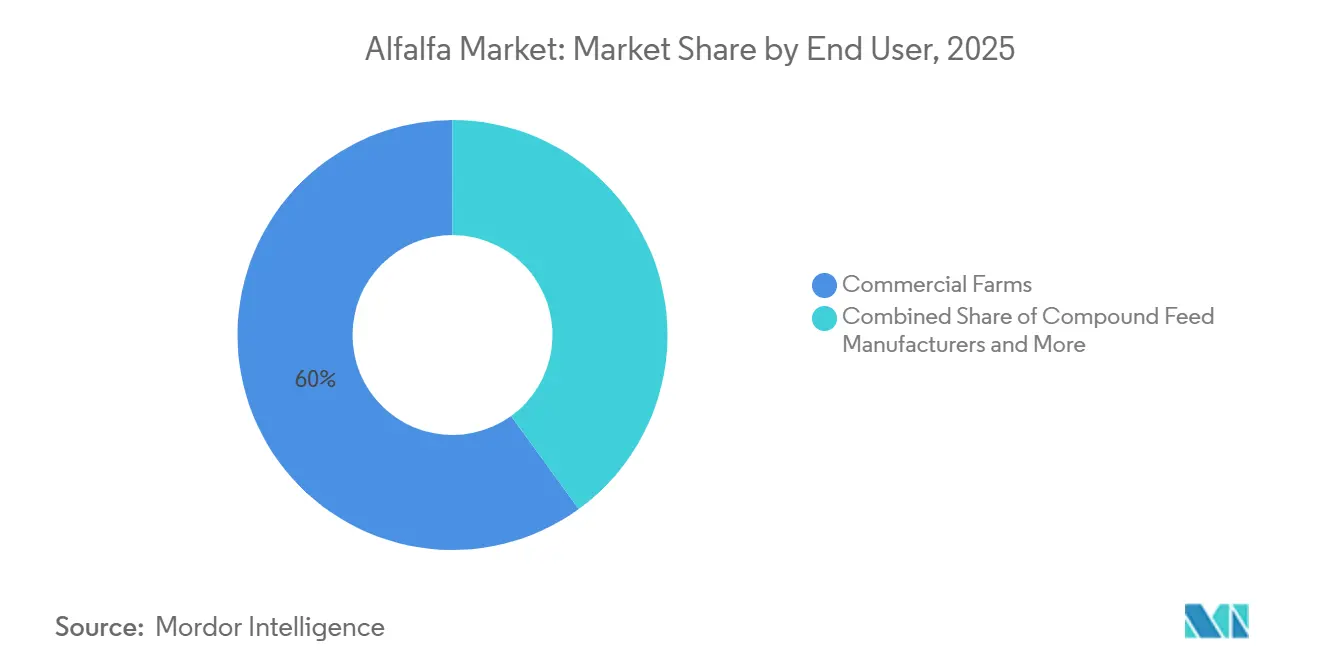
- By end use sector, commercial farms held 60% of the alfalfa market share in 2025, while pet food and specialty nutrition is projected to grow at a 9.0% CAGR between 2026 and 2031.
- By geography, North America held 36.2% of the alfalfa market share in 2025, while Asia-Pacific is forecast to record the highest CAGR of 5.1% between 2026 and 2031.
Note: Market size and forecast figures in this report are generated using Mordor Intelligence’s proprietary estimation framework, updated with the latest available data and insights as of January 2026.
Global Alfalfa Market Trends and Insights
Drivers Impact Analysis*
| Driver | (~) % Impact on CAGR Forecast | Geographic Relevance | Impact Timeline |
|---|---|---|---|
| Rising demand for high-protein dairy rations | +0.8% | Global, concentrated in Asia-Pacific and the Middle East | Short term (≤ 2 years) |
| Expanding export-oriented forage trade | +0.7% | North America and Europe as origins, Asia-Pacific and the Middle East as destinations | Medium term (2-4 years) |
| Premiumization of organic and non-GMO forage | +0.6% | North America and Europe | Medium term (2-4 years) |
| Carbon credit monetization from legume rotations | +0.4% | North America, with spillover into South America | Long term (≥ 4 years) |
| Precision drying and moisture control in post-harvest handling | +0.5% | North America and Europe, emerging in Asia-Pacific processing hubs | Medium term (2-4 years) |
| Growth in equine and specialty livestock nutrition | +0.5% | North America, Europe, and the Middle East | Medium term (2-4 years) |
| Source: Mordor Intelligence | |||
Rising Demand for High-Protein Dairy Rations
Dairy operations in major growth markets are increasingly designing feed plans around milk yield per cow, raising demand for protein-dense forage in the alfalfa market. India, Indonesia, and Vietnam are moving toward formal procurement contracts with minimum crude protein standards, making demand less exposed to short-term substitution in the alfalfa market. Domestic supply in several Asian markets still cannot fully meet premium specifications due to water and seed quality constraints, keeping import dependence embedded in regional growth. This trend is keeping premium-grade procurement central to the alfalfa market, even as broader milk pricing remains uneven.
Expanding Export-Oriented Forage Trade
Export growth in the alfalfa market now depends less on field output alone and more on exporters’ ability to redirect supply across destinations without prolonged delays. China’s 125% tariff on The United States alfalfa in early 2025, could disrupt one of the largest trade corridors in global forage. During the disruption, Chinese dairy farms serving 6 million cows may reduce daily forage intake from 3 kg to 1.5 kg, highlighting how quickly shortages can affect operating performance. Traders that redirect supply to Japan, South Korea, and the Middle East are likely to protect revenue more effectively than exporters that remain too dependent on a single route in the alfalfa market.
Premiumization of Organic and Non-GMO Forage
Organic-certified alfalfa commands a price premium over conventional product in specialty dairy and equine channels, supporting higher value realization in the alfalfa market. The lengthy certification period under the USDA National Organic Program supports this premium by limiting near-term supply growth, even as buyer demand remains strong. Organic livestock standards in the United States and Europe require forage-heavy feeding practices, which gives premium-certified alfalfa a stable buyer base that standard products cannot easily replace. Improvements in drying technology also strengthen market economics. Modeling published in Renewable Energy found that solar-assisted heat pump systems can reduce energy use by up to 33% while maintaining moisture levels within strict export limits. Lower processing costs and tighter moisture control are making certified premium output more practical for growers and processors serving the upper end of the alfalfa market.
Carbon Credit Monetization From Legume Rotations
Carbon and rotation economics support the alfalfa market, as the crop creates value beyond direct feed sales. University of Guelph extension work in 2025 stated that alfalfa can provide a nitrogen credit of 100 pounds per acre for the following corn crop, reducing fertilizer spending in rotation systems. Research published in Agriculture in the year 2025 also found that legume-based rotations can reduce greenhouse gas emission intensity by 12% compared to cereal-only systems. These benefits improve the return profile for longer stand rotations and favor large-acreage growers that can combine revenue with carbon-linked income in the alfalfa market. As a result, the market is developing a broader supply base outside traditional basins, reducing geographic concentration risk over time.
Restraints Impact Analysis*
| Restraint | (~) % Impact on CAGR Forecast | Geographic Relevance | Impact Timeline |
|---|---|---|---|
| Water scarcity and irrigation policy constraints | -0.7% | North America and the Middle East | Medium term (2-4 years) |
| Freight volatility and export logistics risk | -0.6% | Global, most acute on North America to Asia-Pacific trade routes | Short term (≤ 2 years) |
| Price competition from grass hay and silage alternatives | -0.5% | Global, especially Europe and Asia-Pacific | Medium term (2-4 years) |
| Phytosanitary and residue compliance pressure | -0.5% | Export origins in North America and Europe, import destinations in Asia-Pacific | Short term (≤ 2 years) |
| Source: Mordor Intelligence | |||
Water Scarcity and Irrigation Policy Constraints
Water policy remains the clearest supply-side restraint on the alfalfa market, particularly in the Southwestern United States. According to the Public Policy Institute of California, in Arizona, 2024 restrictions on new irrigation permits, along with a 1.04 million acre-feet reduction in Colorado River allocation, are estimated to reduce state alfalfa acreage by 85,000 acres between 2023 and 2025[1]Source: Public Policy Institute of California, "Policy Brief: The Financial Viability and Broader Benefits of SGMA-Ready Crops," ppic.org. California’s Sustainable Groundwater Management Act (SGMA) is also driving basin-level reductions in pumping, leading to 20% to 30% cuts in San Joaquin Valley irrigation deliveries according to the same source[2]Source: Public Policy Institute of California, "Policy Brief: The Financial Viability and Broader Benefits of SGMA-Ready Crops," ppic.org . Research published in the Journal of Irrigation and Drainage Engineering showed that mid-summer deficit irrigation can reduce applied water use by 30% to 49% in alfalfa. However, the practice also reduces yields, weakening farm profitability at current prices. These constraints are shifting premium supply toward states with more secure water access and increasing procurement costs for importers that depend on the alfalfa market.
Freight Volatility and Export Logistics Risk
Freight volatility remains a direct constraint on margins, as shipping can account for 30% to 45% of delivered costs in Asia-Pacific trade. Trans-Pacific container rates from the West Coast of The United States to China ranged from USD 2,800 to USD 4,200 per forty-foot equivalent unit during 2024 and 2025, making contract pricing more challenging for exporters. United States alfalfa exports to China are projected to decline to 560,000 metric tons in the first nine months of 2025 from 718,000 metric tons a year earlier, while the average CIF import price is forecasted to fall by 7.1% per metric ton. Since hay has a low value-to-weight ratio, even a USD 100 increase in container costs can significantly affect net landed economics in the alfalfa market. This dynamic gives a clear advantage to traders that own logistics capacity, operate across multiple ports, and can quickly reroute shipments when trade conditions change.
*Our forecasts treat driver/restraint impacts as directional, not additive. The impact forecasts reflect baseline growth, mix effects, and variable interactions.
Segment Analysis
By Product Type: Bales Command Scale, Dehydrated Pellets Accelerate on Logistics Efficiency
Bales accounted for 42.5% of the alfalfa market share by product type in 2025, supported by low per-ton processing costs, established handling systems, and direct compatibility with export container logistics. Large-square bales remain the preferred format for buyers in China, Japan, and the Middle East, as protein consistency and bulk delivery efficiency remain central to procurement decisions. Compressed bales continue to support major export corridors, as higher pack density improves container utilization and reduces delivered freight cost per metric ton. Cubes also retain a premium role in equine and small-ruminant feeding, as buyers value dust-free handling, stem preservation, and feeding convenience in the alfalfa market.
Pellets are projected to register an 8.4% CAGR between 2026 and 2031, making them the fastest-growing product type in the alfalfa market. Improved logistics efficiency and tighter nutritional consistency compared to field-dried formats are driving their growth. Pelletization increases load density by 30% to 40% relative to bales, helping reduce freight pressure for buyers in Asia-Pacific and the Middle East, where shipping can account for 30% to 45% of delivered cost. Feed mills and automated dairy systems are also increasing pellet use because controlled dehydration supports tighter moisture and nutrient tolerances. In addition, inline moisture prediction with R² above 0.97 improves export quality control for processors targeting premium channels.


By Application: Dairy Anchors Volume, Equine Drives Margin
Dairy cattle feed accounted for 52.2% of the alfalfa market size in 2025, maintaining its position as the leading application across the demand base. The segment remains central to the market because alfalfa serves as a high-protein roughage input in total mixed rations for commercial dairy herds. United States Department of Agriculture (USDA) reporting from Beijing in 2025 indicated that dairy herds in China receiving alfalfa-based rations with more than 18% crude protein achieved higher daily milk output and improved butterfat quality, supporting steady demand for specification-grade bales and pellets[3]Source: Foreign Agricultural Services, “Alfalfa Demand in Northern China - Market Trends Challenges and Outlook,” fas.usda.gov.Beef cattle feed and small ruminant feed continue to provide stable secondary demand, while poultry feed remains a niche application in premium egg systems that use alfalfa meal for natural yolk pigmentation.
Equine feed is projected to register an 8.5% CAGR between 2026 and 2031, making it the fastest-growing application in the alfalfa market. A large premium buyer base supports the segment, with the American Horse Council estimating 7.2 million horses in the United States in 2024 and annual alfalfa consumption of 1.8 million metric tons. Performance and show-horse owners pay more than USD 60 per metric ton above dairy-grade products for dust-extracted cubes and pellets that support respiratory health and bone density. Europe is also contributing to this shift, as cleaner stable standards encourage some buyers to move away from field-dried bales. Meanwhile, camelids and other specialty livestock sustain smaller but premium-oriented demand pockets.
By End Use Sector: Commercial Farms Lead, Specialty Nutrition Scales
Commercial farms held 60% of the alfalfa market share in 2025, making them the leading end use sector by value. These buyers typically source through multi-year contracts linked to protein, moisture, and relative feed value specifications, making supply reliability more important than spot pricing. This purchasing pattern favors suppliers with multi-origin sourcing, strong execution capabilities, and the ability to maintain deliveries during freight or weather-related disruptions in the alfalfa market. Compound feed manufacturers remain the key secondary end use sector, as they use alfalfa meal and pellets as controlled protein and fiber ingredients in processed feed systems.
Pet food and specialty nutrition are projected to grow at a 9.0% CAGR between 2026 and 2031, making this the fastest-growing end use sector in the alfalfa market. Premium small-animal nutrition brands are driving growth by offering traceable and certified products for rabbits, guinea pigs, and chinchillas, where provenance and dust content influence purchasing decisions. These brands support higher margins through certification, tamper-evident packaging, and ingredient traceability, which increases value realization above standard livestock-grade supply. As a result, barriers to entry in this segment of the market depend more on certification and retail packaging capabilities than on production scale alone.
Geography Analysis
North America accounted for 36.2% of the alfalfa market size in 2025, maintaining its position as the largest regional base for production and trade. The United States continues to benefit from mechanized harvesting, established grading systems, and access to Pacific ports, which support export scale. The United States hay production reached 122.5 million metric tons in 2024, indicating a strong physical supply base before the current forecast period begins. However, North America is forecast to grow, as Arizona’s permit restrictions and California’s SGMA-led cuts tighten water availability in major producing areas. Canadian Prairie output, including pellet capacity linked to Japanese buyers, is offsetting some of this pressure. However, the regional supply map in the alfalfa market is still shifting away from water-stressed basins toward more stable northern locations.
Asia-Pacific is forecast to expand at a 5.1% CAGR between 2026 and 2031, making it the fastest-growing geography in the alfalfa market. Growth is tied to dairy intensification, rising import dependence, and more formal feed procurement systems in China, India, Indonesia, and Vietnam. China imported 685,100 metric tons of alfalfa in the first 9 months of 2025, down 22% year over year after the tariff shock, while the average CIF import price declined by 7.1% to USD 348 per metric ton. This decline did not change Asia-Pacific’s position as the fastest-growing regional market because it reflected short-term trade disruption in China, while broader demand across the region continued to expand through dairy intensification, import dependence, and formalized feed procurement. Domestic subsidy support for forage production is expanding, but imported products continue to meet premium protein requirements that local supply does not consistently fulfill.
The Middle East, the demand is shifting toward imports, as Saudi Arabia plans to phase out domestic alfalfa cultivation by the 2027-2028 marketing year under its groundwater conservation policy. Meanwhile, the UAE continues to treat forage as a strategic food security input. South America is forecasted to grow, as Argentina and Chile build export-oriented supply. Al Dahra Holding LLC's farmland expansion plans in Brazil, Argentina, and Paraguay indicate that institutional capital sees long-term value in the region.Africa is projected to grow from a smaller base, supported by commercial dairy expansion and large irrigated farming projects, including Al Dahra Holding LLC's 2025 Kenya agreement covering up to 200,000 acres with planned investment of up to USD 800 million.
Competitive Landscape
The alfalfa market remains moderately fragmented, with the top 5 players accounting for a major share of combined revenue in 2025, leaving meaningful room for regional processors and trading houses. Scale continues to matter, but no single company controls the supply chain, as water access, land quality, export infrastructure, and customer relationships remain distributed across multiple regions. The draft identifies Anderson Hay and Grain Co., Inc. as the largest United States export-oriented supplier, with foreign sales contributing close to 80% of its revenue across more than 30 countries. Its Chapter 11 filing in December 2025 has changed the competitive landscape, reflecting pressure from weaker Asian dairy demand, Japan’s forage subsidies, a stronger United States dollar, and rising labor and fuel costs. Despite this disruption, the company is anticipated to continue procurement and shipment activities into the 2026 harvest cycle under court supervision, underscoring the importance of operational continuity in the alfalfa market.
A clear strategic pattern in the alfalfa market is the rise of the multi-origin trader. Al Dahra Holding LLC fits this model through its sourcing and production links across Spain, Romania, Egypt, Australia, and Argentina, which allow it to redirect supply quickly during disruptions such as the 2025 United States-China tariff shock. Another key model is the branded premium processor, represented by companies such as Standlee Premium Products, which serve equine and specialty animal channels with organic cubes and pellets that command strong shelf premiums. These two models are shaping competition differently, one competes on global supply resilience, while the other competes on product quality, retail positioning, and certification depth in the alfalfa market.
Post-harvest technology is becoming a practical entry barrier in the alfalfa market, as premium buyers increasingly focus on moisture, cleanliness, and compliance control. Moisture-prediction systems with accuracy above R² 0.97 can reduce export rejection risk and improve lot consistency, giving processors with stronger sensing infrastructure a clear commercial advantage. Access rules also influence competition. As a result, competitive gains in the alfalfa market increasingly come from logistics resilience, premium-format capability, and traceability systems rather than field acreage alone.
Competitive gains in the alfalfa market are increasingly tied to how well companies manage sourcing, processing, and market access. For Anderson Hay and Grain Co., Inc., the key issue is maintaining procurement and shipment continuity during restructuring. For Al Dahra Holding LLC, the advantage comes from its multi-origin sourcing network, which allows it to shift supply across regions when trade routes are disrupted. For Standlee Premium Products, competitive strength lies in premium-format capability, certification depth, and its position in equine and specialty animal channels. As a result, competition is being shaped less by field acreage alone and more by logistics resilience, traceability systems, and the ability to serve higher-value product segments.
Alfalfa Industry Leaders
-
Standlee Premium Products, LLC
-
Alfalfa Monegros, S.L.
-
Border Valley Trading, Inc.
-
Al Dahra Holding LLC (Al Dahra ACX Global Inc.)
-
Anderson Hay Enterprise, Inc.(Anderson Hay and Grain Co., Inc.)
- *Disclaimer: Major Players sorted in no particular order

Recent Industry Developments
- June 2025: Al Dahra announced a plan to expand its global farmland footprint from 150,000 hectares to 500,000 hectares, with acquisitions targeted in Brazil, Argentina, and Paraguay, alongside continued processing expansion in Romania, Spain, and Africa. This strategy supports the alfalfa market by widening supply optionality across regions and strengthening multi-origin sourcing for global forage trade.
- April 2025: DLF's North American business established specialized Product Knowledge Centers in Philomath, Oregon, and Port Hope, Ontario, to display its alfalfa breeding and seed modification technology portfolio, targeting commercial forage buyers seeking yield-optimized and drought-tolerant cultivars for evolving production geographies.
- November 2024: Al Dahra Agriculture Egypt confirmed plans to invest USD 30 million over 3 years to expand land reclamation at Toshka, raise sorting and packing capacity at Al Salehiya to 60 metric tons per hour, and modernize its equipment fleet. This move strengthens Egypt’s position in the alfalfa market by improving its ability to serve as a reliable alternative forage supply source for Gulf and Asian buyers.


Research Methodology Framework and Report Scope
Market Definitions and Key Coverage
Our study defines the alfalfa market as the total value of raw or processed alfalfa (hay bales, cubes and pellets) that flows through farmgate sales, domestic trading channels and formal cross-border exports for livestock and specialty feed use worldwide.
Scope exclusion: pet-food additives derived from alfalfa leaf meal are kept outside this valuation.
Segmentation Overview
-
By Product Type
- Bales
- Pellets
- Cubes
- Compressed Bales
-
By Application
- Dairy Cattle Feed
- Beef Cattle Feed
- Poultry Feed
- Equine Feed
- Small Ruminant Feed
- Camelids and Other Livestock Feed
-
By End Use Sector
- Commercial Farms
- Compound Feed Manufacturers
- Household and Hobby Animal Owners
- Pet Food and Specialty Nutrition
-
By Geography
-
North America
- United States
- Canada
- Mexico
- Rest of North America
-
Europe
- Germany
- United Kingdom
- France
- Spain
- Italy
- Russia
- Rest of Europe
-
Asia-Pacific
- China
- Japan
- India
- Australia
- New Zealand
- South Korea
- Rest of Asia-Pacific
-
South America
- Brazil
- Argentina
- Chile
- Rest of South America
-
Middle East
- Saudi Arabia
- United Arab Emirates
- Turkey
- Rest of Middle East
-
Africa
- South Africa
- Egypt
- Kenya
- Rest of Africa
-
North America
Detailed Research Methodology and Data Validation
Primary Research
Mordor analysts interviewed growers, hay processors, feed mill nutritionists and livestock veterinarians across North America, Europe, the Gulf and East Asia. Discussions confirmed local feed ration trends, realistic dry-matter losses, typical contracted prices and the adoption pace of sun-cured versus dehydrated pellets, helping us bridge gaps left by public data.
Desk Research
We began by pulling multi-year acreage, yield and production series from open databases such as FAOSTAT, USDA-NASS, Eurostat Crop Statistics and China's MARA bulletins. We then tracked export-import shifts through UN Comtrade and ITC Trade Map. Price benchmarks and grade differentials were gathered from the USDA AMS hay terminal reports, Australia's ABARES fodder dashboards and Spain's MAPA market bulletins, which provided the baseline spreads between Supreme, Premium and Good RFV grades. Our team also reviewed peer-reviewed journals on forage nutritive value, recent patent filings on low-lignin cultivars via Questel, and annual reports of listed dairy integrators to understand demand pull. These sources underpin the supply, trade and pricing blocks of the model; however, many other secondary references were consulted for validation and context.
Market-Sizing & Forecasting
A top-down reconstruction converts harvested acreage and average yield into available tonnage, adjusts for field and storage losses, and multiplies by grade-weighted average selling prices to reach the market value. Supplier roll-ups of major processing plants and sampled ASP × volume checks act as a selective bottom-up sense-check before totals are frozen. Key variables, such as dairy cow inventories, compound-feed penetration rates, export parity prices, water-use regulations, and adoption of drought-tolerant cultivars, feed a multivariate regression that drives our outlook. Where country-level bottom-ups were incomplete, regional trade weights and surveyed utilization ratios filled the gaps.
Data Validation & Update Cycle
Outputs pass anomaly filters, variance checks versus historic price bands and a two-step peer review. We refresh the model annually, and an interim update is triggered when extreme weather, trade-policy shifts or material currency swings alter any core variable. Before release, an analyst performs a final reality check.
Why Mordor's Alfalfa Market Baseline Commands Reliability
Published numbers diverge because firms pick differing product sets, grade mixes, currency years and refresh cadences.
Key gap drivers include rival scopes that fold in low-value grass mixes, reliance on static price assumptions or conversions from volume without freight adjustments, and less frequent model refreshes that miss drought-led acreage swings.
Benchmark comparison
| Market Size | Anonymized source | Primary gap driver |
|---|---|---|
| USD 20.40 B | Mordor Intelligence | - |
| USD 29.27 B | Global Consultancy A | Includes vitamin-enriched derivatives and uses 2024 FX rates without 2025 revisions |
| USD 24.14 B (2024) | Trade Journal B | Converts 2023 farm-gate prices to 2024 value, no grade split adjustment |
| USD 88.10 B (2024) | Industry Association C | Aggregates alfalfa with mixed legume hays and reports retail feed-store prices |
The comparison shows that once scope creep and price assumptions are stripped out, Mordor's disciplined acreage-to-value chain delivers a balanced, transparent baseline that decision-makers can trace back to clear variables and repeatable steps.


Key Questions Answered in the Report
Wat is the projected value of the alfalfa market by 2031?
The alfalfa market is projected to reach USD 22.39 billion by 2031 from USD 18.49 billion in 2026, with growth supported by dairy feed demand, premium forage trade, and specialty nutrition applications.
What is driving demand for alfalfa in dairy feed?
Demand is tied to protein-dense rations that support higher milk yield and better butterfat quality, especially in import-dependent Asian dairy systems using formal feed specifications.
Which region is growing fastest for alfalfa demand?
Asia-Pacific is the fastest-growing region with a 5.1% CAGR through 2031, driven by dairy intensification, import dependence, and structured feed procurement.
Which application is expanding fastest through 2031?
Equine feed is the fastest-growing application at 8.5% CAGR, supported by strong spending on dust-free cubes and pellets for performance and show horses.
Why are water policies important for alfalfa supply?
Water rules in Arizona and California are tightening acreage and irrigation access, which is shifting production to more water-stable regions and raising procurement costs for importers.
How concentrated is competition among leading suppliers?
The top 5 players held a major share of revenue in 2025, which indicates a fragmented structure where regional specialists and multi-origin traders still have room to gain share.
Page last updated on:


