
Peas Market Analysis by Mordor Intelligence
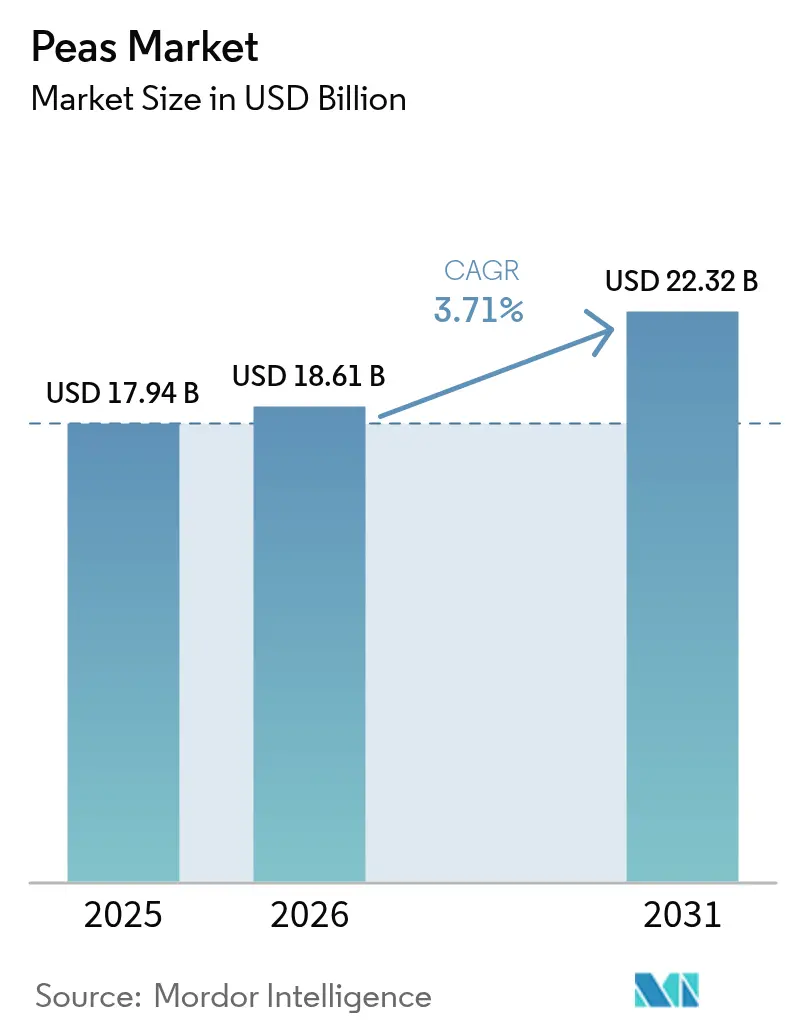
The peas market size is projected to expand from USD 17.94 billion in 2025 and USD 18.61 billion in 2026 to USD 22.32 billion by 2031, registering a CAGR of 3.71% between 2026 to 2031. Field-pea volumes previously routed through commodity feed channels are increasingly being redirected to plant-protein processors, which offer higher margins. In North America and Europe, direct hectare subsidies are supporting the recovery of domestic protein-crop acreage, reversing a two-decade decline. Trade dynamics are also undergoing significant changes. Russia has captured a substantial share of China’s 2024 pea imports, displacing Canada as the dominant supplier. This shift has led exporters to prioritize identity-preserved, non-GMO supply contracts. Additionally, on-farm artificial intelligence (AI) systems aimed at reducing harvest losses are contributing to measurable yield improvements, tightening supply-demand balances in deficit regions, thereby reducing the market's vulnerability to weather-related disruptions.
Key Report Takeaways
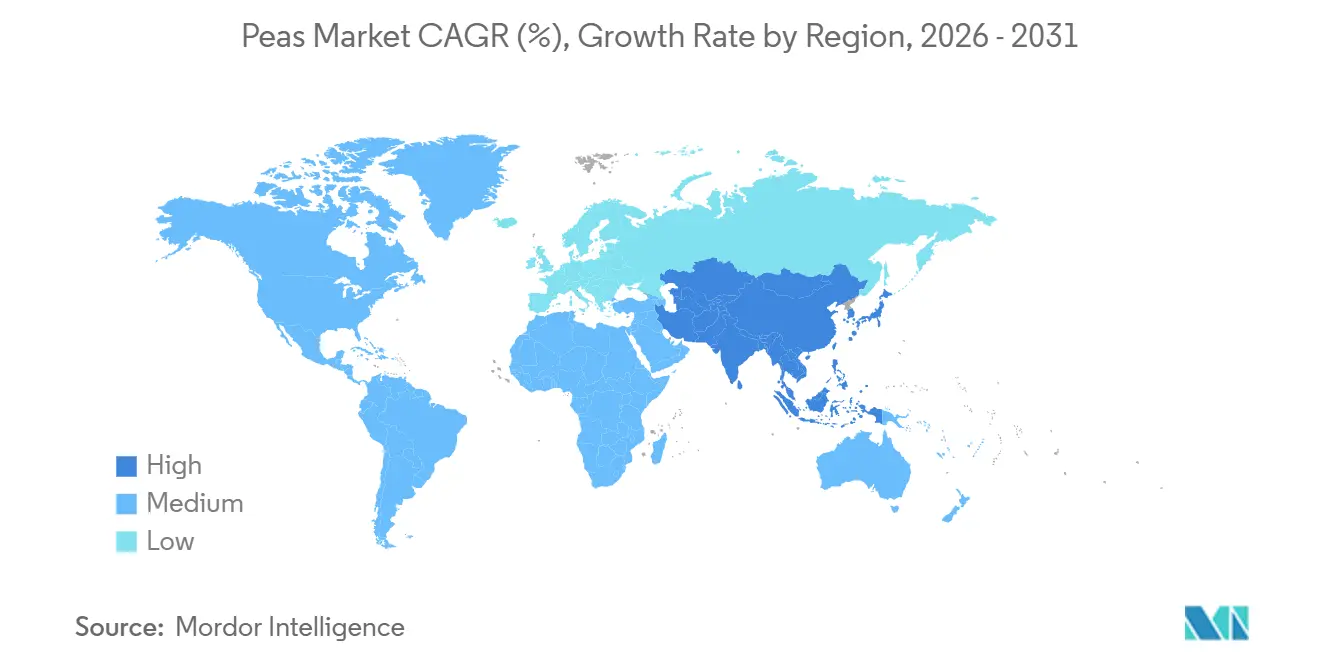
- By geography, North America held 31.7% of the peas market share in 2025, and Asia-Pacific is forecast to expand at a 7.4% CAGR through 2031.
Note: Market size and forecast figures in this report are generated using Mordor Intelligence’s proprietary estimation framework, updated with the latest available data and insights as of 2026.
Market Trends and Insights
Drivers Impact Analysis of Peas Market*
| Driver | (~) % Impact on CAGR Forecast | Geographic Relevance | Impact Timeline |
|---|---|---|---|
| Rising demand from plant-based protein processors | +1.2% | North America and Europe | Medium term (2-4 years) |
| Feed industry reformulations favoring field peas | +0.8% | Asia-Pacific spillover to North America | Long term (≥ 4 years) |
| Government support programs for pulse crops | +1.0% | North America, Europe, and India | Short term (≤ 2 years) |
| Soil-health benefits driving crop-rotation adoption | +0.9% | Europe, North America, and Australia | Long term (≥ 4 years) |
| Emergence of certified traceable pea supply chains | +0.7% | Global, led by North America and Europe | Medium term (2-4 years) |
| On-farm AI vision systems reducing harvest losses | +0.9% | North America, Asia-Pacific, and Africa | Medium term (2-4 years) |
| Source: Mordor Intelligence | |||
Rising Demand from Plant-Based Protein Processors
Pea-protein isolate capacity is expanding faster than field-pea output, underpinning sustained premiums in the peas market. In November 2021, Roquette invested over CAD 600 million (approximately USD 450–600 million) to establish the world's largest pea protein plant in Portage la Prairie, Manitoba, Canada. The facility has the capacity to process 125,000 metric tons of yellow peas annually[1]. The United States International Trade Commission's ruling insulating domestic processors from offshore isolates has funneled Canadian yellow peas into value-added channels, lifting spot prices in 2025. Collectively, these moves keep farm-gate prices upward and reinforce the growth trajectory of the peas market.
Feed Industry Reformulations Favoring Field Peas
Aquaculture and pet-food companies are displacing soybean meal with field peas to align with non-genetically modified labeling mandates. Salmon diets now include pea concentrate without compromising growth, cutting phosphorus discharge in Norway and Chile, where effluent caps tightened in 2024[2]. Grain-free pet food formulas continue to drive steady demand for pea starch, even following regulatory clarifications by the Food and Drug Administration. These formulas are particularly popular among pet owners seeking alternatives to traditional grain-based diets, further bolstering the market for pea starch. In the European Union, livestock integrators incorporate peas to meet protein-autonomy targets, supporting stable returns for Canadian and French growers, despite a reduction in acreage between 2021 and 2023. This reformulation trend redirects pea production into premium feed, strengthening the demand base for the peas market. Additionally, the use of peas in premium feed aligns with the growing focus on sustainable, high-quality livestock nutrition, thereby contributing to the long-term stability of the market.
Government Support Programs for Pulse Crops
Direct hectare payments and margin-insurance schemes are reversing two decades of pulse-acreage decline in North America and Europe, injecting predictability into a crop historically plagued by volatile returns. Canada's AgriStability program compensates producers for 70% of margin shortfalls when reference prices fall below five-year averages, a safety net that insulated growers when yellow-pea prices dropped in 2024-25. India's National Food Security Mission for Pulses extends subsidies for certified seed, bio-fertilizers, and micro-irrigation systems, targeting a 15% increase in domestic pea production by 2027 to reduce import dependency. Together, these incentives underpin the peas market’s projected growth.
Soil-Health Benefits Driving Crop-Rotation Adoption
Biological nitrogen fixation and carbon sequestration delivered by field peas are quantifiable enough to influence rotation economics even in the absence of direct subsidies, particularly where fertilizer costs remain elevated. Peas fix 40 to 80 kilograms of nitrogen per hectare annually through symbiotic rhizobia, reducing synthetic-nitrogen applications by 30% to 50% in subsequent cereal crops and lowering input costs by USD 60 to USD 100 per hectare. Carbon sequestration of 0.5 to 1.5 metric tons of CO₂ equivalent per hectare per season positions peas as a compliance tool for growers participating in voluntary carbon markets, where credits trade at USD 15 to USD 30 per metric ton.
Restraints Impact Analysis of Peas Market*
| Restraint | (~) % Impact on CAGR Forecast | Geographic Relevance | Impact Timeline |
|---|---|---|---|
| Pest and disease pressure | −0.8 % | North America and Europe | Short term (≤ 2 years) |
| High farm-gate price volatility | −0.6 % | Canada and Australia | Medium term (2–4 years) |
| Tightening herbicide residue limits in key import markets | −0.4 % | Europe and China, spillover to exporters | Medium term (2–4 years) |
| Limited cold-chain capacity for value-added pea products in emerging economies | −0.3 % | Sub-Saharan Africa and South Asia | Long term (≥ 4 years) |
| Source: Mordor Intelligence | |||
Pest and Disease Pressure
Ascochyta blight slashed Saskatchewan yields by 18% in 2024 despite two fungicide passes, while aphanomyces root rot can persist for 10–15 years in infested soils[3]. Pea weevil infestations can reduce germination rates by up to 40% and may void export contracts requiring zero-tolerance thresholds. These infestations pose significant challenges for pea producers, impacting both domestic and international trade. Implementing eight-year rotation intervals and using resistant cultivars help mitigate these risks but increase opportunity costs, limiting short-term acreage expansion in the pea market. Additionally, adopting these measures requires careful planning and resource allocation, further influencing market dynamics.
High Farm-Gate Price Volatility
Canadian yellow pea prices declined by 12% between the 2023-24 and 2024-25 marketing years to an average of USD 405 per metric ton, primarily due to Russia's record harvest and its expanded market share in China. This decline reflects the competitive pressures from Russia's production and its ability to capture a larger share of the Chinese market. In 2024, Australian field pea prices fluctuated between AUD 450 (USD 292.5) and AUD 500 (USD 325) per metric ton, influenced by domestic supply conditions and global demand trends. Additionally, North American acreage is forward-contracted, leaving the majority of growers vulnerable to spot-market volatility. This exposure to price swings has hindered the growth of the peas market, as growers face challenges in managing financial risks and ensuring profitability.
*Our forecasts treat driver/restraint impacts as directional, not additive. The impact forecasts reflect baseline growth, mix effects, and variable interactions.
Geography Analysis
North America Peas Market
In 2025, North America accounted for 31.7% of the pea market share, driven by Canada's position as the world's second-largest exporter and the United States' increasing focus on domestic pea-protein processing. The construction of pea-protein facilities by Louis Dreyfus Company in Yorkton, Saskatchewan, and Portage la Prairie, Manitoba, during 2024-2025 highlights a strategic move toward value-added processing within production regions rather than exporting raw commodities. This development challenges Canada's traditional dominance and shifts trade flows toward Black Sea ports. Exporters face higher compliance costs due to maximum residue limits, which require discontinuing glyphosate pre-harvest desiccation. However, this also strengthens the premium positioning of traceable supply chains. The region's growth has been constrained by crop diseases such as ascochyta blight and aphanomyces root rot, which negatively impacted yields in Saskatchewan in 2024.
APAC and South America Peas Market
Asia-Pacific is the fastest-growing geography, with a 7.4% CAGR through 2031, propelled by aquaculture feed reformulation in China and India's drive to rebuild domestic pulse production. South America plays a modest role in global trade flows. In Brazil, farmers in Rio Grande do Sul are incorporating peas into wheat rotations but face challenges due to limited access to certified seeds. The integration of peas into crop rotations aims to improve soil health and diversify agricultural production. Argentina exports small volumes to the Middle East but experiences production losses due to inefficiencies in post-harvest handling, including inadequate storage facilities and outdated processing techniques.
EMEA Peas Market
Europe held a moderate share in the pea market. The Middle East and Africa remain net importers. United Arab Emirates and Saudi Arabia trans-ship Canadian and Australian peas to South Asia and East Africa. South Africa’s stable production feeds domestic processors, while Ethiopia and Kenya suffer post-harvest losses due to cold-chain deficits. Accelerated investment in logistics is critical for unlocking the potential of the peas market across these deficit regions. Additionally, the lack of refrigerated transport reduces processing incentives, hindering the growth of the regional peas market and limiting its competitiveness in international markets.
Regulatory Landscape
Regulation in the peas market is shaped by food safety and quality standards, and by trade-defense measures affecting pea-derived ingredients. Codex Alimentarius standards, including CXS 171-1989 for certain pulses and CXS 041-1981 for quick frozen peas, act as common reference points across national systems. Country and regional requirements such as China’s GB/T 10460-2008 (quality and classification for peas) and the East African Community’s EAS 759:2011 (dry whole peas) also support harmonized specifications in commercial trade.
Trade measures have become a pricing and compliance variable for exporters. In December 2025, the European Union adopted Commission Implementing Regulation (EU) 2025/2581 to register imports of high-protein pea protein (above 65% protein) from China, increasing scrutiny on cross-border ingredient flows. In India, the import policy for yellow peas maintained a 30% tariff through March 31, 2027, keeping landed-cost sensitivity high for global suppliers and tying trade volumes to domestic crop outcomes and policy settings.
Value Chain Analysis
The value chain spans input suppliers (seed, crop protection, inoculants), growers, local aggregators and grain handlers, cleaning and storage, processors (splitting, milling, starch and protein fractionation), and downstream users across food manufacturing, feed (aquaculture and pet food), and ingredient channels. Integrated processors and merchandisers, including AGT Food and Ingredients, Roquette, and Cosucra, alongside North American contracting models used by companies such as PURIS and Ingredion, link farmgate supply to identity-preserved and non-GMO specifications demanded by food and ingredient customers.
Operational bottlenecks are concentrated at segregation, compliance, and logistics nodes, particularly where food-grade collection and testing infrastructure is limited and where residue limits restrict common practices (including discontinuing glyphosate pre-harvest desiccation for shipments into tighter markets). The chain is also sensitive to bilateral tariff moves and rerouted trade flows, reflecting Russia’s expanded presence in China’s import mix and the parallel push for traceable, contract-based supply. As field-pea volumes shift away from commodity feed channels toward protein processing, availability tightens for traditional buyers and raises the importance of storage, quality assurance, and processor-adjacent origination in major exporting regions.
Competitive Landscape
The peas market comprises companies such as AGT Food and Ingredients, Roquette, and Ingredion. These firms operate integrated fractionation facilities and maintain contracts with growers across various regions, ensuring a consistent supply of peas for diverse applications. Roquette's invested to establish the pea protein plant in Portage la Prairie, Manitoba, Canada. The facility has the capacity to process 125,000 metric tons of yellow peas annually. PURIS and Ingredion pursue backward integration through contracted acreage, securing non-genetically modified supply while absorbing agronomic risk previously borne by commodity traders.
Technological advancements are leading to a divided supply base. For instance, John Deere’s AI-enabled systems and Trimble’s precision-harvesting technologies enhance operational efficiency for large-scale farms in regions such as Saskatchewan, North Dakota, and Western Australia. However, these technologies remain financially inaccessible for farmers managing sub-five-hectare plots in India and Africa. Additionally, the United States' anti-dumping ruling has redirected Chinese isolate exports toward Southeast Asia and the Middle East, increasing competition in these emerging markets. Processors capable of adhering to varying residue standards, ranging from the European Union's 10 milligrams per kilogram glyphosate limit to unregulated thresholds in North America, are positioned to gain a competitive advantage.
Opportunities exist in Africa and South Asia, where significant gaps in cold-chain infrastructure result in high post-harvest losses, thereby impacting the overall efficiency and profitability of agricultural supply chains. Addressing these gaps by developing robust cold-chain systems and adopting value-added processing technologies could significantly reduce losses, improve product quality, and enable producers to capture higher margins. Furthermore, Bioceres' rhizobia inoculants offer sustainable solutions to enhance soil fertility and crop yields, while Farmers Edge's blockchain traceability platforms provide transparency and traceability across the supply chain. These innovations position emerging players to compete effectively with established incumbents by leveraging sustainability credentials, improving operational efficiency, and meeting the growing demand for traceable and sustainably produced goods.
Market Opportunities and Future Outlook
Value-added processing continues to be the key growth opportunity, as pea-protein and starch fractionation expands faster than field-pea output in major producing regions. Completed and underway investments provide specific anchors for this pull-through dynamic. Roquette’s Portage la Prairie facility (125,000 metric tons per year of yellow peas processing capacity) and Louis Dreyfus Company’s Yorkton, Saskatchewan pea protein commissioning activity strengthen processor demand for identity-preserved, contract-grown peas that meet residue and non-GMO requirements. In parallel, product-level changes that improve taste and functionality, such as neutral-tasting isolates, support higher inclusion rates in plant-based dairy and meat formulations, expanding the addressable base beyond commodity channels.
On-farm and agronomy innovation is another actionable focus area, given the market’s exposure to pest pressure and weather volatility. 2026 agronomic research points to sowing-time optimization and targeted nutrition or biostimulant programs that better match processor needs for consistent protein and functional profiles, not only yield. In emerging deficit regions, cold-chain and post-harvest handling gaps keep losses high for value-added pea products, so investment in storage, cleaning, and distribution infrastructure supports local processing and gives importers and trans-shippers in the Middle East and Africa more room to move from bulk trade into higher-margin formats.
Recent Industry Developments in Peas Market
- July 2026: Agroenergy Group announced a USD 24.2 million investment to build a deep processing plant for yellow peas in the Kyiv region of Ukraine, with a stated annual processing capacity of 35,000 tons. The project adds processing capacity closer to Black Sea-linked grain corridors and supports a shift from bulk exports toward ingredient and higher-value channels.
- March 2026: Louis Dreyfus Company began commissioning its new pea protein isolate production facility at Yorkton, Saskatchewan, Canada. Commissioning marks the transition from construction to operational ramp-up, reinforcing North America’s move toward processor-led demand and contracted, specification-driven pea sourcing.
- November 2024: Ingredion and Lantmannen announced a strategic partnership to accelerate development of plant-based protein ingredients, including solutions using pea protein. The collaboration links an ingredients major with a farmer-owned cooperative platform, expanding routes to market for pea-derived proteins in food and beverage formulations.
Peas Market Report Scope and Research Methodology
Market Definition and Coverage
For this study, the peas market is defined as the value of peas traded and consumed across key supply chains, covering both value (USD) and volume (metric tons) tracking, with country and regional aggregation to a global total.
Scope exclusions: We do not count adjacent pulses or blended plant-protein ingredients unless they are explicitly reported as pea-derived volumes or pea trade values.
Segments Covered in This Report
- By Geography
- North America
- United States
- Production Analysis (Area Harvested, Yield, and Production Volume)
- Consumption Analysis (Consumption Value and Volume)
- Import Market Analysis (Import Value, Volume, and Key Supplying Markets)
- Export Market Analysis (Export Value, Volume, and Key Destination Markets)
- Wholesale Price Trend Analysis and Forecast
- Regulatory Framework
- List of Key Players
- Logistics and Infrastructure
- Seasonality Analysis
- Canada
- Production Analysis (Area Harvested, Yield, and Production Volume)
- Consumption Analysis (Consumption Value and Volume)
- Import Market Analysis (Import Value, Volume, and Key Supplying Markets)
- Export Market Analysis (Export Value, Volume, and Key Destination Markets)
- Wholesale Price Trend Analysis and Forecast
- Regulatory Framework
- List of Key Players
- Logistics and Infrastructure
- Seasonality Analysis
- Mexico
- Production Analysis (Area Harvested, Yield, and Production Volume)
- Consumption Analysis (Consumption Value and Volume)
- Import Market Analysis (Import Value, Volume, and Key Supplying Markets)
- Export Market Analysis (Export Value, Volume, and Key Destination Markets)
- Wholesale Price Trend Analysis and Forecast
- Regulatory Framework
- List of Key Players
- Logistics and Infrastructure
- Seasonality Analysis
- United States
- Europe
- United Kingdom
- Production Analysis (Area Harvested, Yield, and Production Volume)
- Consumption Analysis (Consumption Value and Volume)
- Import Market Analysis (Import Value, Volume, and Key Supplying Markets)
- Export Market Analysis (Export Value, Volume, and Key Destination Markets)
- Wholesale Price Trend Analysis and Forecast
- Regulatory Framework
- List of Key Players
- Logistics and Infrastructure
- Seasonality Analysis
- France
- Production Analysis (Area Harvested, Yield, and Production Volume)
- Consumption Analysis (Consumption Value and Volume)
- Import Market Analysis (Import Value, Volume, and Key Supplying Markets)
- Export Market Analysis (Export Value, Volume, and Key Destination Markets)
- Wholesale Price Trend Analysis and Forecast
- Regulatory Framework
- List of Key Players
- Logistics and Infrastructure
- Seasonality Analysis
- Germany
- Production Analysis (Area Harvested, Yield, and Production Volume)
- Consumption Analysis (Consumption Value and Volume)
- Import Market Analysis (Import Value, Volume, and Key Supplying Markets)
- Export Market Analysis (Export Value, Volume, and Key Destination Markets)
- Wholesale Price Trend Analysis and Forecast
- Regulatory Framework
- List of Key Players
- Logistics and Infrastructure
- Seasonality Analysis
- Russia
- Production Analysis (Area Harvested, Yield, and Production Volume)
- Consumption Analysis (Consumption Value and Volume)
- Import Market Analysis (Import Value, Volume, and Key Supplying Markets)
- Export Market Analysis (Export Value, Volume, and Key Destination Markets)
- Wholesale Price Trend Analysis and Forecast
- Regulatory Framework
- List of Key Players
- Logistics and Infrastructure
- Seasonality Analysis
- Ukraine
- Production Analysis (Area Harvested, Yield, and Production Volume)
- Consumption Analysis (Consumption Value and Volume)
- Import Market Analysis (Import Value, Volume, and Key Supplying Markets)
- Export Market Analysis (Export Value, Volume, and Key Destination Markets)
- Wholesale Price Trend Analysis and Forecast
- Regulatory Framework
- List of Key Players
- Logistics and Infrastructure
- Seasonality Analysis
- United Kingdom
- Asia-Pacific
- China
- Production Analysis (Area Harvested, Yield, and Production Volume)
- Consumption Analysis (Consumption Value and Volume)
- Import Market Analysis (Import Value, Volume, and Key Supplying Markets)
- Export Market Analysis (Export Value, Volume, and Key Destination Markets)
- Wholesale Price Trend Analysis and Forecast
- Regulatory Framework
- List of Key Players
- Logistics and Infrastructure
- Seasonality Analysis
- India
- Production Analysis (Area Harvested, Yield, and Production Volume)
- Consumption Analysis (Consumption Value and Volume)
- Import Market Analysis (Import Value, Volume, and Key Supplying Markets)
- Export Market Analysis (Export Value, Volume, and Key Destination Markets)
- Wholesale Price Trend Analysis and Forecast
- Regulatory Framework
- List of Key Players
- Logistics and Infrastructure
- Seasonality Analysis
- Australia
- Production Analysis (Area Harvested, Yield, and Production Volume)
- Consumption Analysis (Consumption Value and Volume)
- Import Market Analysis (Import Value, Volume, and Key Supplying Markets)
- Export Market Analysis (Export Value, Volume, and Key Destination Markets)
- Wholesale Price Trend Analysis and Forecast
- Regulatory Framework
- List of Key Players
- Logistics and Infrastructure
- Seasonality Analysis
- China
- South America
- Brazil
- Production Analysis (Area Harvested, Yield, and Production Volume)
- Consumption Analysis (Consumption Value and Volume)
- Import Market Analysis (Import Value, Volume, and Key Supplying Markets)
- Export Market Analysis (Export Value, Volume, and Key Destination Markets)
- Wholesale Price Trend Analysis and Forecast
- Regulatory Framework
- List of Key Players
- Logistics and Infrastructure
- Seasonality Analysis
- Argentina
- Production Analysis (Area Harvested, Yield, and Production Volume)
- Consumption Analysis (Consumption Value and Volume)
- Import Market Analysis (Import Value, Volume, and Key Supplying Markets)
- Export Market Analysis (Export Value, Volume, and Key Destination Markets)
- Wholesale Price Trend Analysis and Forecast
- Regulatory Framework
- List of Key Players
- Logistics and Infrastructure
- Seasonality Analysis
- Brazil
- Middle East
- United Arab Emirates
- Production Analysis (Area Harvested, Yield, and Production Volume)
- Consumption Analysis (Consumption Value and Volume)
- Import Market Analysis (Import Value, Volume, and Key Supplying Markets)
- Export Market Analysis (Export Value, Volume, and Key Destination Markets)
- Wholesale Price Trend Analysis and Forecast
- Regulatory Framework
- List of Key Players
- Logistics and Infrastructure
- Seasonality Analysis
- Saudi Arabia
- Production Analysis (Area Harvested, Yield, and Production Volume)
- Consumption Analysis (Consumption Value and Volume)
- Import Market Analysis (Import Value, Volume, and Key Supplying Markets)
- Export Market Analysis (Export Value, Volume, and Key Destination Markets)
- Wholesale Price Trend Analysis and Forecast
- Regulatory Framework
- List of Key Players
- Logistics and Infrastructure
- Seasonality Analysis
- United Arab Emirates
- Africa
- South Africa
- Production Analysis (Area Harvested, Yield, and Production Volume)
- Consumption Analysis (Consumption Value and Volume)
- Import Market Analysis (Import Value, Volume, and Key Supplying Markets)
- Export Market Analysis (Export Value, Volume, and Key Destination Markets)
- Wholesale Price Trend Analysis and Forecast
- Regulatory Framework
- List of Key Players
- Logistics and Infrastructure
- Seasonality Analysis
- Tanzania
- Production Analysis (Area Harvested, Yield, and Production Volume)
- Consumption Analysis (Consumption Value and Volume)
- Import Market Analysis (Import Value, Volume, and Key Supplying Markets)
- Export Market Analysis (Export Value, Volume, and Key Destination Markets)
- Wholesale Price Trend Analysis and Forecast
- Regulatory Framework
- List of Key Players
- Logistics and Infrastructure
- Seasonality Analysis
- Ethiopia
- Production Analysis (Area Harvested, Yield, and Production Volume)
- Consumption Analysis (Consumption Value and Volume)
- Import Market Analysis (Import Value, Volume, and Key Supplying Markets)
- Export Market Analysis (Export Value, Volume, and Key Destination Markets)
- Wholesale Price Trend Analysis and Forecast
- Regulatory Framework
- List of Key Players
- Logistics and Infrastructure
- Seasonality Analysis
- Kenya
- Production Analysis (Area Harvested, Yield, and Production Volume)
- Consumption Analysis (Consumption Value and Volume)
- Import Market Analysis (Import Value, Volume, and Key Supplying Markets)
- Export Market Analysis (Export Value, Volume, and Key Destination Markets)
- Wholesale Price Trend Analysis and Forecast
- Regulatory Framework
- List of Key Players
- Logistics and Infrastructure
- Seasonality Analysis
- South Africa
- North America
Data Sources, Market Sizing, and Validation
Desk Research
Desk research was used to build the first structure of the market and to anchor the model to measurable farm, trade, and price signals. We leaned on public agriculture and trade statistics to understand how pea production, harvested area, yields, import and export flows, and stock movements are behaving over time.
Sources we referred to include official datasets and publications such as FAOSTAT, USDA market outlook and crop reports, UN Comtrade trade statistics, World Bank macro indicators, and OECD-FAO agricultural outlook tables. In parallel, we reviewed company filings, investor presentations, association websites, and reputable agriculture press for season events, planting shifts, and price direction. We also used paid databases for company financials and patent lookups where it helped validate participation and product activity. These examples are illustrative only, and many additional sources were used for data collection, validation, and clarification during the work.
Primary Interviews and Surveys
Primary work was used to confirm what the desk signals could not fully explain, especially how pricing, trade substitutions, and end-use pull-through affect value realization in different regions. We spoke with a mix of growers, processors, traders, distributors, and downstream buyers, and respondent input was used to pressure-test assumptions like typical quality premiums, contract versus spot behavior, and seasonality impacts across major producing and importing regions.
Distribution of primary research fieldwork respondents
| Company type | Respondent position | Region |
|---|---|---|
| Top tier: 39% | CXOs: 14% | APAC: 52% |
| Mid tier: 40% | Functional/Unit leaders: 36% | EMEA: 30% |
| Smaller Players: 21% | Managers: 50% | Americas: 18% |
Market-Sizing & Forecasting
The market was sized using a top-down build where production and trade data were used to reconstruct apparent consumption, which was then translated into value using wholesale price trends and region-level price normalization. Once the global and regional totals were formed, we corroborated them with selective bottom-up approximations such as sampled export unit values, processor capacity utilization cues where available in public disclosures, and channel checks on typical price bands to adjust any unrealistic totals.
Key inputs that shaped the model included harvested area and yield movements, production volumes by major origins, import and export balances by destination, observed wholesale price direction, and changes in demand signals tied to food use and ingredient pull from processing. For forecasting, scenario analysis was applied around the most sensitive levers (weather-linked yield swings, trade policy friction, and price pass-through timing), and the final path was then aligned to what primary respondents considered a realistic base case. Where country-level data gaps appeared, we used proxy ratios from nearby comparable markets and then reconciled them back to regional totals so the roll-up stayed consistent.
Data Validation & Update Cycle
Model outputs were checked against independent signals like trade unit values, regional production shares, and price trend direction so the value trajectory stayed consistent with physical movement. When a variance showed up, the assumptions were revisited, followed by a second-pass review by another analyst before sign-off.
The report is refreshed annually, and interim updates are made when material events occur such as sharp price shocks, major policy changes, or abnormal production seasons. Before delivery, we run a final review pass to confirm the latest public statistics and the most recent primary feedback are reflected in the numbers.
Mordor Intelligence's Peas Market Size Compared With Other Published Estimates
Published peas market numbers can differ even when they look like they are talking about the same crop, mainly because the boundary of what is counted is not always the same. Differences also show up when value is built from farmgate versus wholesale pricing, or when trade is treated as a pass-through versus a value-added signal.
By tracking wholesale price trend analysis and validating regional trade-to-consumption consistency, Mordor Intelligence keeps the pea value model tied to observable production and cross-border movement, which reduces over-counting when processed pea ingredients or non-pea pulses are mixed into the definition.
Benchmark comparison
| Source | Market Size | Gaps in Research Methodology |
|---|---|---|
| Mordor Intelligence | USD 17.94 B (2025) | |
| Industry Publisher A | USD 11.20 B (2025) | Uses a broader packaged and processed product lens, then applies mixed form-level assumptions (fresh, frozen, canned, dried) that can understate wholesale trade value in high-volume producing regions. |
| Trade Data Publisher B | USD 5.92 B (2025) | Limits scope to dried peas at factory-gate value, which excludes fresh and frozen flows and also changes the price basis from wholesale crop value to manufacturer-level realization. |
The spread across the three numbers is largely explained by scope boundaries and the price point used to convert volume into value. When the definition is kept consistent with crop production, trade movement, and wholesale pricing, the resulting total is easier to trace, repeat, and update with each new season.
Key Questions Answered in the Report
How large is the peas market in monetary terms?
The peas market size is estimated at USD 18.61 billion in 2026 and projected to reach USD 22.32 billion by 2031.
What is the projected growth rate for peas demand?
Global demand is forecast to rise at a 3.71% CAGR from 2026 to 2031, buoyed by plant-based protein and feed reformulation trends.
Which region currently leads in peas revenue?
North America held 31.7% of peas market share in 2025, driven by Canada's export scale and United States processing investments.
Which geography is expanding fastest?
Asia-Pacific is forecast to grow at 7.4% CAGR through 2031, supported by Chinese aquaculture feed demand and India's production incentives.
How are residue regulations affecting exporters?
The European Union's 10 milligrams per kilogram glyphosate ceiling is pushing exporters to adopt non-chemical desiccation, adding USD 15-25 per metric ton in compliance costs.
Who are the top pea-protein processors?
Roquette, Yantai Shuangta, PURIS, Ingredion, and AGT Food and Ingredients collectively control the global ingredient-grade capacity.