Policy Management In Telecom Market Size and Share
Market Overview
| Study Period | 2020 - 2031 |
|---|---|
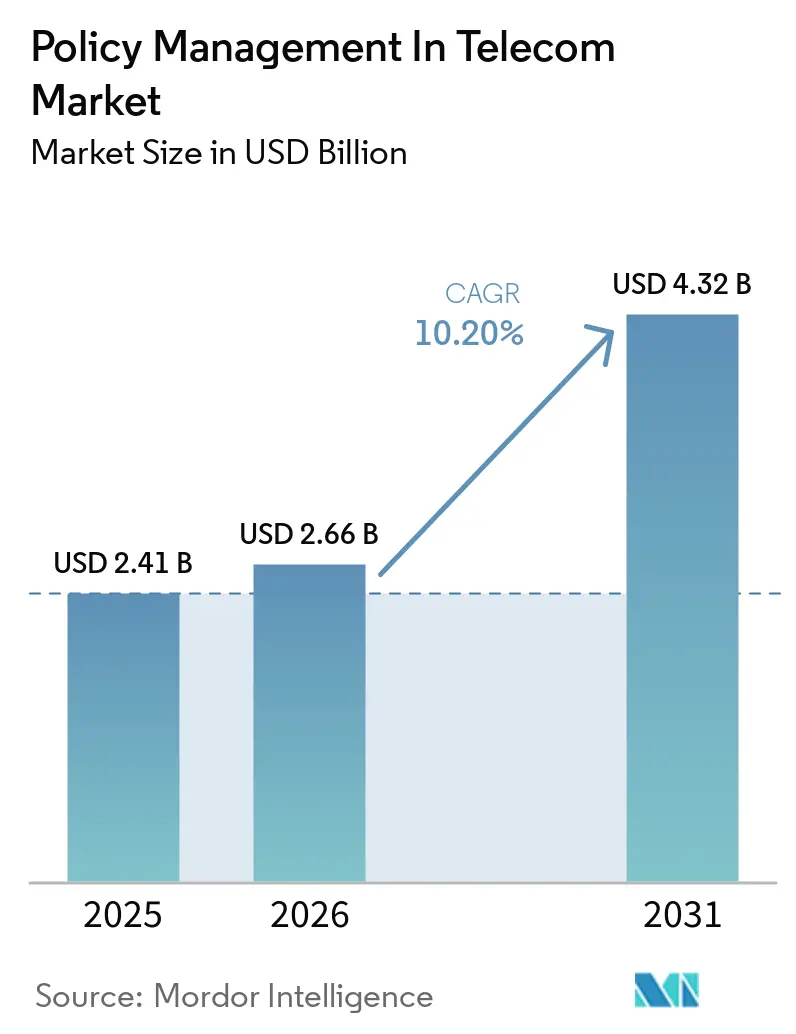
| Market Size (2026) | USD 2.66 Billion |
| Market Size (2031) | USD 4.32 Billion |
| Growth Rate (2026 - 2031) | 10.20% CAGR |
| Fastest Growing Market | Asia Pacific |
| Largest Market | North America |
| Market Concentration | Medium |
Major Players *Disclaimer: Major Players sorted in no particular order Image © Mordor Intelligence. Reuse requires attribution under CC BY 4.0. | |
Policy Management In Telecom Market Analysis by Mordor Intelligence
The policy management in the telecom industry market size is projected to expand from USD 2.41 billion in 2025 and USD 2.66 billion in 2026 to USD 4.32 billion by 2031, registering a CAGR of 10.20% between 2026 and 2031. Structural change is underway as communication service providers replace legacy policy and charging rules function appliances with cloud-native policy control function micro-services built for 5G standalone cores. Hyperscaler alliances lower capital intensity and accelerate time-to-market for private networks while artificial intelligence lets operators automate congestion management, real-time roaming alerts, and slice-level quality guarantees. Consolidation is reshaping the competitive field, illustrated by Amdocs’ January 2026 purchase of MATRIXX, as vendors seek scale to fund service-based architecture roadmaps. Demand is also buoyed by national programs that tie spectrum releases and industrial policy to measurable 5G-Advanced and 6G milestones.
Key Report Takeaways
- By deployment model, cloud-based implementations accounted for 71.20% of the policy management in the telecom industry market share in 2025 and are forecast to grow at a 14.80% CAGR to 2031.
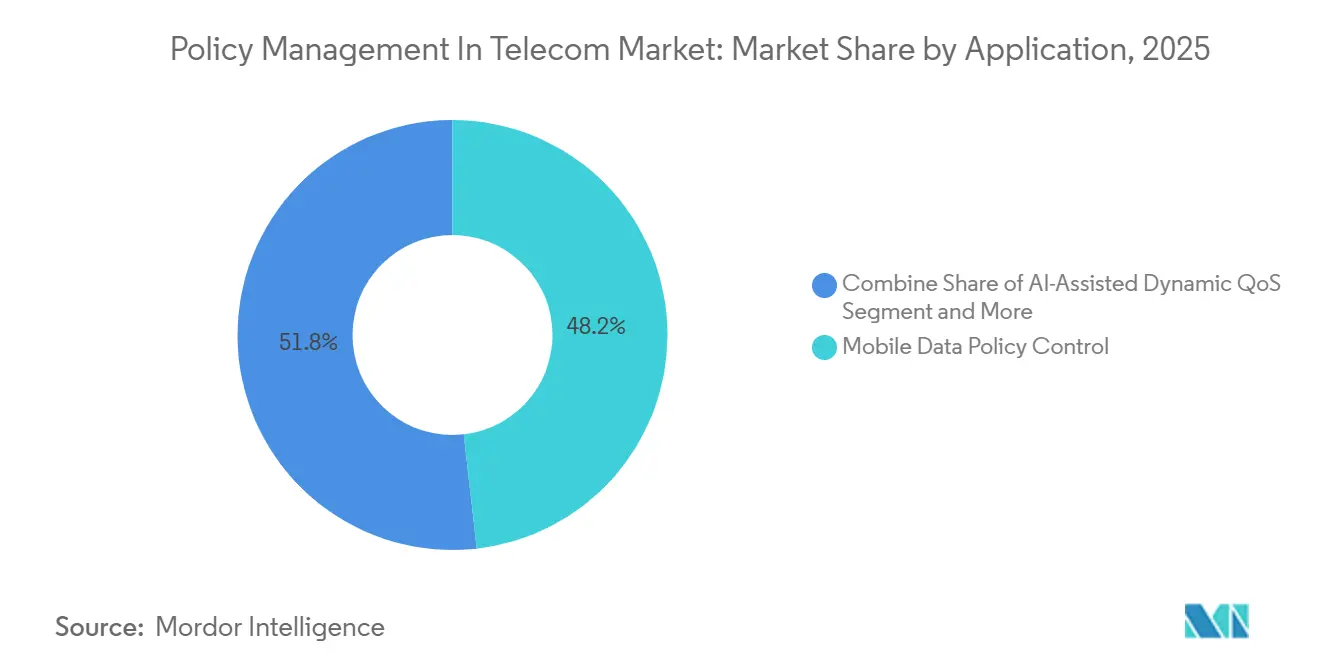
- By application, artificial-intelligence-assisted dynamic quality-of-service policies are projected to post the fastest CAGR at 15.30% through 2031, while mobile data policy control retained a 48.20% share of the policy management in the telecom industry market size in 2025.
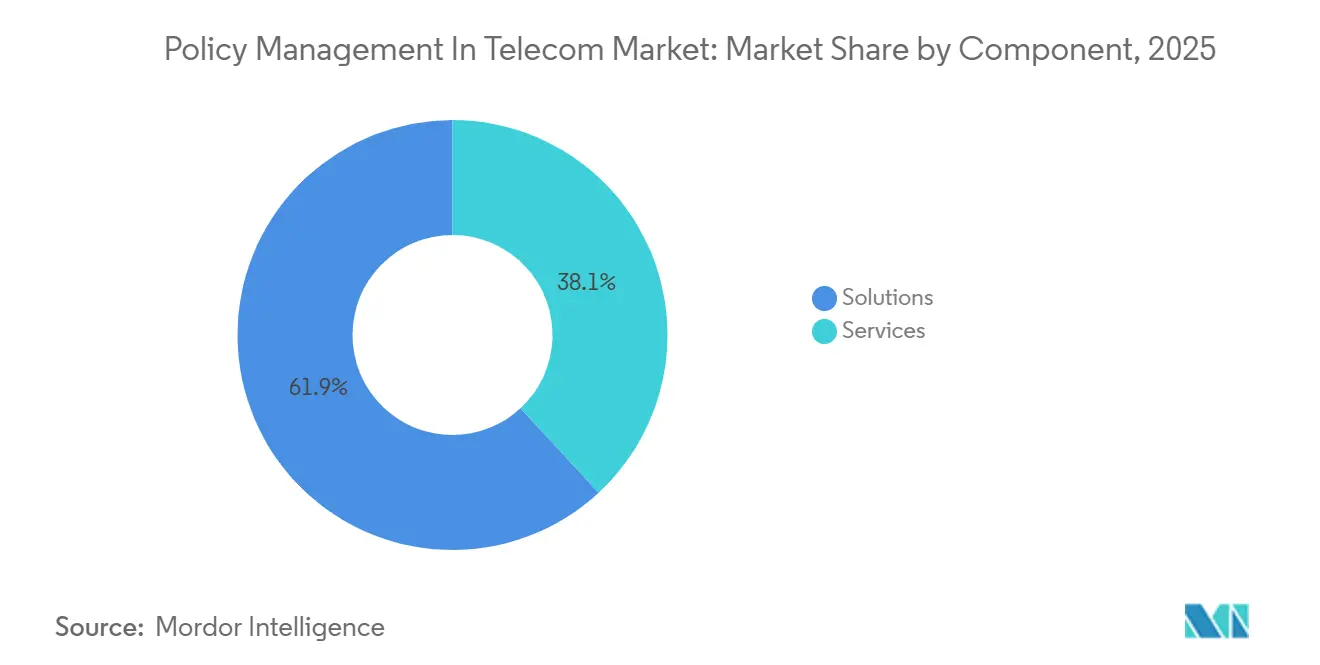
- By component, solutions led with 61.90% revenue of the policy management in the telecom industry market in 2025, whereas services are poised to advance at a 12.40% CAGR during the outlook period.
- By operator type, mobile network operators represented 55.90% of the policy management in the telecom industry market in 2025, and mobile virtual network operators are expanding at 12.60% per year.
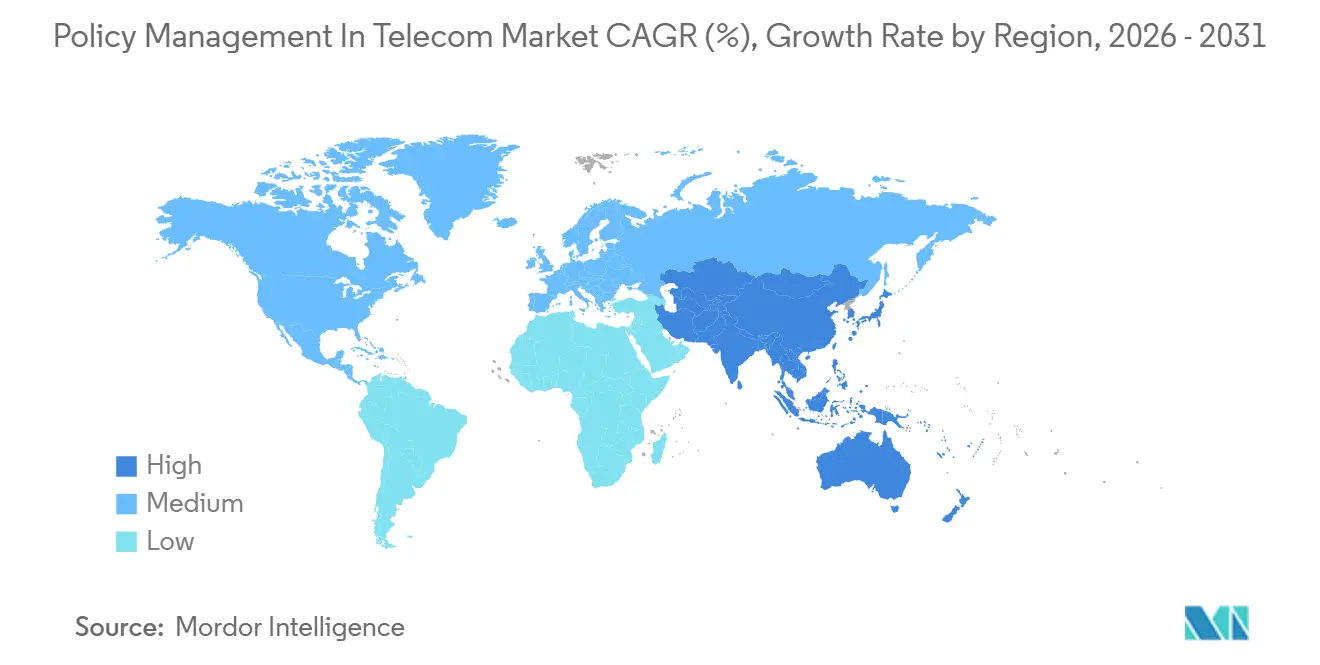
- By geography, North America generated 28.20% of the policy management in the telecom industry market in 2025 revenue, and Asia-Pacific is forecast to register the fastest regional CAGR at 15.80% through 2031.
Note: Market size and forecast figures in this report are generated using Mordor Intelligence’s proprietary estimation framework, updated with the latest available data and insights as of January 2026.
Global Policy Management In Telecom Market Trends and Insights
Drivers Impact Analysis*
| Driver | (~) % Impact on CAGR Forecast | Geographic Relevance | Impact Timeline |
|---|---|---|---|
| Rising Mobile-Data Traffic and Fair-Usage Enforcement | +2.8% | Global with peak demand in Asia-Pacific and Middle East | Medium term (2-4 years) |
| CSP Transition to Cloud-Native 5G-Core Architectures | +3.2% | North America and Europe early adopters, Asia-Pacific and Middle East following | Long term (≥ 4 years) |
| Regulatory Push for Real-Time Roaming Bill-Shock Prevention | +1.5% | Europe and Asia-Pacific, selective adoption in Middle East and Africa | Short term (≤ 2 years) |
| Monetisation Needs for Network Slicing and Enterprise SLAs | +2.1% | Global, concentrated in North America, Europe, and Gulf Cooperation Council | Medium term (2-4 years) |
| AI-Assisted Dynamic QoS and Intent-Based Policies | +1.9% | North America and Europe pioneers, gradual diffusion to Asia-Pacific | Long term (≥ 4 years) |
| Private-Network PCC Demand from Industry 4.0 Campuses | +1.4% | Europe and North America manufacturing hubs, emerging in Asia-Pacific | Medium term (2-4 years) |
| Source: Mordor Intelligence | |||
Rising Mobile-Data Traffic And Fair-Usage Enforcement
Video streaming, cloud gaming, and augmented reality push data volumes upward, compelling operators to refine fair-usage rules that preserve customer experience while curbing congestion. Sub-100-millisecond decision cycles enabled by cloud-native policy engines let networks throttle or reprioritize flows the instant a cell reaches capacity. Operators in high-growth markets are therefore automating rule execution instead of relying on manual policy updates that once took hours. Upgrades to 400 Gbps internet-exchange backbones show the investment scale needed to match data growth, and the practice illustrates why real-time congestion mitigation now sits at the heart of every strategic roadmap.[1]e and UAE, “Emirates Internet Exchange Upgraded to 400Gbps,” eand.com
CSP Transition To Cloud-Native 5G-Core Architectures
Containerized policy control function micro-services conforming to 3GPP Release 15 and Release 16 specifications replace monolithic appliances, unlocking continuous integration pipelines and elastic scaling. Operators migrating to these architectures trim upfront hardware spending by nearly 40% and roll out new rules in hours rather than weeks.[2]Nokia, “Nokia Deploys 5G Core as a Service on AWS for Citymesh,” nokia.com Hybrid deployments keep latency-sensitive transactions on premises to meet data residency laws, while non-critical analytics move to public clouds, balancing compliance with cost. Markets that solve integration pain points first gain earlier access to service-based monetization models such as network slicing.
Regulatory Push For Real-Time Roaming Bill-Shock Prevention
Updated roaming guidelines force carriers to send usage alerts inside 60 seconds, making rapid policy lookup and enforcement a legal obligation rather than a customer-service perk. Compliance demands policy engines that federate charging data across visited and home networks with near-real-time synchronization. Automation therefore extends beyond congestion control into roaming spend governance, increasing the relevance of cloud-native platforms that centralize rule logic while still honoring region-specific privacy statutes.
Monetisation Needs For Network Slicing And Enterprise SLAs
Enterprises pay multiples of consumer pricing for latency and reliability assurances, but revenue materializes only if policy engines can map service-level agreements to slice-specific quality parameters. Operators monetizing connected-vehicle and industrial-automation slices use policy control to guarantee sub-20-millisecond round-trip times and generate real-time proof points for billing audits.[3]T-Mobile, “Commercial Network Slicing for Connected Vehicles,” t-mobile.com The requirement elevates convergent charging plus policy orchestration stacks that couple per-slice billing with automated performance tracking, turning network slicing from a cost center into a premium growth engine.
Restraints Impact Analysis*
| Restraint | (~) % Impact on CAGR Forecast | Geographic Relevance | Impact Timeline |
|---|---|---|---|
| Legacy PCRF and BSS Integration Complexity | -1.8% | Global, acute in Europe and North America with entrenched systems | Medium term (2 – 4 years) |
| Operator CAPEX Constraints in Low-ARPU Markets | -2.1% | Sub-Saharan Africa, South America, and parts of Asia-Pacific | Long term (≥ 4 years) |
| Security Concerns Around Multi-Vendor Cloud Deployments | -0.9% | Europe and North America, selective impact in Middle East | Short term (≤ 2 years) |
| Edge-Cloud Orchestration Immaturity | -1.2% | Global, concentrated in markets pursuing distributed policy enforcement | Medium term (2 – 4 years) |
| Source: Mordor Intelligence | |||
Legacy PCRF And BSS Integration Complexity
Operators running proprietary interfaces between older billing platforms and legacy policy engines often face multi-year cutovers, which significantly impact operational efficiency. During this transition, parallel operations are required, effectively doubling overhead costs until the decommissioning process is complete. This prolonged migration not only stretches budgets but also diverts critical engineering talent that could be utilized to develop and refine monetization use cases. Additionally, the reliance on custom mediation layers further extends payback periods, delaying the realization of returns on investment. These challenges also hinder the timely deployment of advanced service-based architecture features, limiting the ability to offer innovative services to customers. As a result, operators face significant delays in modernizing their infrastructure and achieving operational agility.
Operator CAPEX Constraints In Low-ARPU Markets
Where average revenue per user falls below USD 5 monthly, economic logic strongly favors expanding radio-access networks over modernizing policy frameworks. This is primarily because the cost of upgrading policy platforms often outweighs the potential revenue gains in such low-margin markets.[4]Anatel, “5G Core Deployment Updates Brazil,” anatel.gov.br Additionally, currency volatility exacerbates the situation by inflating software license costs, which are typically denominated in U.S. dollars. As a result, return-on-investment horizons for these upgrades extend to seven years or longer, making them less attractive. Consequently, many carriers in price-sensitive regions continue to rely on legacy assets well beyond their normal life cycles, further delaying the adoption of cloud-native policy platforms.
*Our forecasts treat driver/restraint impacts as directional, not additive. The impact forecasts reflect baseline growth, mix effects, and variable interactions.
Segment Analysis
By Component: Solutions Lead, Services Accelerate
Solutions held 61.90% of 2025 revenue within the policy management in telecom industry market size, underscoring the importance of license-driven software elements such as policy control function instances and convergent charging engines. These solutions are critical for enabling telecom operators to manage network policies effectively while ensuring seamless customer experiences. Managed services are growing at a 12.40% CAGR as carriers increasingly shift operational risks to external specialists to focus on core business functions. The convergence of charging, policy orchestration, and revenue assurance within outcome-based contracts is becoming a preferred approach for operators. This trend is driven by the need for predictable operating expenses over periodic capital expenditure spikes, which can strain budgets. Additionally, the growing complexity of telecom networks further emphasizes the importance of robust policy management solutions.
Skills shortages in the telecom industry are also driving demand for service providers who offer comprehensive solutions. These providers often bundle migration consulting, slice lifecycle management, and artificial-intelligence-driven assurance into multi-year agreements, addressing the operational challenges faced by carriers. As more telecom operators transition to cloud-native cores, the demand for managed services is expected to grow significantly. Service revenue is likely to close the gap with solutions revenue, as ongoing optimization and compliance validation require continuous external support. This shift highlights the increasing reliance on external expertise to manage the complexities of modern telecom networks. Furthermore, the adoption of advanced technologies and regulatory compliance needs are expected to sustain the growth of managed services in the forecast period.


By Deployment Model: Cloud Dominance With Hybrid Nuance
Cloud variants commanded 71.20% market share in 2025, establishing the cloud as the primary platform for new policy deployments. Public clouds cater to small and mid-size operators that lack the resources to maintain large-scale data centers. In contrast, private and sovereign clouds are preferred by tier-one operators that must adhere to stringent data residency and security regulations. Hybrid models are gaining traction, combining on-premises real-time enforcement with analytics offloaded to hyperscaler regions. This approach allows operators to balance compliance requirements with the scalability and flexibility offered by cloud solutions. As a result, the cloud continues to dominate as the preferred choice for policy management in the telecom industry.
On-premises systems are experiencing a decline in market share but remain relevant in regions with limited public-cloud infrastructure or strict national-security restrictions. These systems are often the only viable option in jurisdictions where public-cloud adoption is hindered by regulatory or technological barriers. However, hybrid cloud models are gradually bridging this gap by demonstrating successful use cases that combine the benefits of both on-premises and cloud-based solutions. Over time, these hybrid deployments are expected to reduce resistance to cloud adoption and encourage a shift toward multi-tenant infrastructure. This transition is anticipated to further solidify the cloud’s role as a critical driver of growth in telecom policy management.
By Application: Security Policies Lead, Roaming Accelerates
Mobile data policy control still accounted for 48.20% of 2025 revenue, yet AI-assisted quality-of-service policies are expanding fastest at a 15.30% CAGR. This growth is driven by advancements in deep reinforcement learning, enabling operators to predict network congestion and adjust rules proactively, thereby improving user experience. These technologies have reduced decision latency by more than one-third, making them highly efficient. Voice over LTE, IP Multimedia Subsystem, and roaming use cases continue to play a significant role, especially in regions where regulatory bodies enforce sub-minute spending alerts.
Security, parental control, and content filtering represent a smaller but steadily growing segment as governments worldwide implement stricter regulations on digital services. These solutions are gaining traction as consumers and enterprises prioritize safer online environments. The broader trend is shifting toward intent-based orchestration, where operators define desired outcomes, and AI-driven engines automatically translate these intents into thousands of granular rules. This approach simplifies network management while improving efficiency and scalability. Furthermore, the integration of AI into policy management systems is enabling operators to address complex compliance requirements more effectively. As a result, the role of artificial intelligence in shaping the future of policy management continues to expand significantly.

By Operator Type: MVNO Momentum Builds
Mobile network operators are projected to generate 55.90% of the demand in 2025, highlighting the significant capital investment driving nationwide 5G rollouts. These operators are leveraging their financial resources to establish extensive 5G infrastructure, ensuring widespread coverage and enhanced connectivity. In contrast, mobile virtual network operators (MVNOs) are experiencing a robust annual growth rate of 12.60%. MVNOs rely on asset-light models, which utilize cloud-based policy stacks to quickly launch new brands or sub-brands without requiring substantial core investments. Meanwhile, fixed and broadband providers are adopting similar policy frameworks as they roll out 5G fixed wireless access solutions. This convergence is increasingly blurring the distinction between mobile and home broadband services, creating a more integrated connectivity landscape.
The success of MVNOs depends on several critical factors, including ready-made policy templates, user-friendly self-service portals, and seamless integration with host network policy engines. These elements enable MVNOs to efficiently manage operations and deliver high-quality services to their customers. The reliance on cloud micro-services further enhances their operational agility, allowing for rapid scalability and innovation. This trend also presents a secondary growth opportunity for vendors aiming to diversify their offerings beyond tier-one mobile incumbents. By catering to the specific needs of MVNOs, vendors can tap into a growing market segment and expand their presence in the evolving telecommunications ecosystem.
Geography Analysis
North America delivered 28.20% of 2025 revenue for the policy management in telecom industry market thanks to early 5G standalone deployments, robust hyperscaler ecosystems, and enterprise appetite for private networks. Operators leverage Citizens Broadband Radio Service rules to embed policy control inside on-premises enterprise networks, broadening addressable demand beyond traditional consumer bases. Artificial-intelligence-powered orchestration sees rapid pilot-to-production cycles, buttressing growth.
Asia-Pacific is forecast to record a 15.80% CAGR through 2031, the fastest globally, as massive 5G subscriber additions in China and policy-linked government programs in India fuel new rollouts. Standalone core expansion to hundreds of thousands of base stations generates unprecedented volumes of policy transactions, forcing carriers to adopt elastic, cloud-native control planes. Early adoption of intent-based networking in Japan and South Korea further solidifies the region’s forward momentum.
Europe shows measured progress, paced by mandates for real-time roaming alerts and strong data privacy regimes that skew architecture toward hybrid clouds. Middle Eastern operators invest aggressively in 6G research and spectrum harmonization, positioning the Gulf Cooperation Council as a test bed for next-generation policy architectures. Sub-Saharan Africa and South America remain constrained by capital budgets, yet managed service models, tied to revenue share rather than heavy upfront fees, carve a sustainable pathway to modernization.

Competitive Landscape
Six suppliers controlled roughly 68% of global charging-product revenue in 2025, highlighting the increasing market concentration in this segment. The 2026 acquisition of MATRIXX by Amdocs further intensified this trend, consolidating the competitive landscape. Vendors are prioritizing the integration of artificial intelligence into policy orchestration to enhance operational efficiency. They are also focusing on automating slice lifecycle management and ensuring their solutions comply with evolving 3GPP releases. Hyperscaler alliances have become a critical component of go-to-market strategies, enabling vendors to deliver pre-integrated policy stacks through cloud marketplaces and accelerate proofs of concept.
Disruptors that initially targeted MVNO niches are now facing the need to scale their operations to remain competitive. Many are opting for mergers or acquisitions to secure the resources required for compliance with service-based architecture standards. Meanwhile, incumbents are strengthening their portfolios by incorporating composable modules that align with TM Forum standards. This approach allows operators to integrate best-of-breed components without the need for a complete overhaul of their existing systems. The shift towards modularity is reshaping the competitive dynamics of the market, offering flexibility and innovation opportunities.
With the introduction of Release 17, the scope of policy frameworks has expanded to include non-terrestrial networks and RedCap devices. This development has increased the demand for engineering expertise and standardization capabilities, which are now critical for maintaining a competitive edge. Larger players with established resources and influence in standardization processes are better positioned to capitalize on these changes. As a result, entry barriers for smaller challengers have risen, making it more difficult for them to compete effectively. The evolving landscape underscores the importance of adaptability and innovation in navigating the complexities of the market.
Policy Management In Telecom Industry Leaders
Amdocs Ltd.
Telefonaktiebolaget LM Ericsson
Huawei Technologies Co., Ltd.
Oracle Corporation
Nokia Corporation
- *Disclaimer: Major Players sorted in no particular order

Recent Industry Developments
- April 2026: Nokia deployed 5G Core as a service on Amazon Web Services for Citymesh, enabling private network provisioning without dedicated hardware.
- April 2026: Netcracker extended its revenue management partnership with Netia, adding automated network slicing lifecycle management under a multi-year managed services contract.
- January 2026: Amdocs acquired MATRIXX Software for USD 200 million, creating an end-to-end portfolio that spans policy, charging, and revenue assurance.
- January 2026: e and UAE upgraded Emirates Internet Exchange to 400 Gbps, expanding capacity for fair-usage enforcement during peak periods.


Global Policy Management In Telecom Market Report Scope
The Policy Management in Telecom Market refers to solutions and platforms used by telecom operators to define, control, and enforce network policies governing data traffic, user access, service quality, and billing rules. These systems, often centered around policy control functions (PCF/PCRF), enable real-time decision-making to manage bandwidth allocation, prioritize services, and ensure compliance with service-level agreements (SLAs).
The Policy Management in Telecom Industry Report is Segmented by Component (Solutions and Services), Deployment Model (On-Premises and Cloud-Based), Application (Mobile Data Policy Control, Voice/VoLTE and IMS Policy, Roaming and Interconnect Policy, and Security/Parental-Control and Content Policy), Operator Type (Mobile Network Operators, Fixed/Broadband Operators, and Mobile Virtual Network Operators), and Geography (North America, Europe, Asia-Pacific, Middle East, Africa, and South America). The Market Forecasts are Provided in Terms of Value (USD).
| Solutions |
| Services |
| On-Premises |
| Cloud-Based (Public, Private, Hybrid) |
| Mobile Data Policy Control |
| Voice/VoLTE and IMS Policy |
| Roaming and Interconnect Policy |
| Security/Parental-Control and Content Policy |
| Mobile Network Operators (MNO) |
| Fixed/Broadband Operators |
| Mobile Virtual Network Operators (MVNO) |
| North America | United States |
| Canada | |
| Mexico | |
| Europe | Germany |
| United Kingdom | |
| France | |
| Italy | |
| Spain | |
| Netherlands | |
| Russia | |
| Rest of Europe | |
| Asia-Pacific | China |
| Japan | |
| India | |
| South Korea | |
| Australia and New Zealand | |
| ASEAN | |
| Rest of Asia-Pacific | |
| Middle East | Saudi Arabia |
| United Arab Emirates | |
| Turkey | |
| Rest of Middle East | |
| Africa | South Africa |
| Nigeria | |
| Egypt | |
| Rest of Africa | |
| South America | Brazil |
| Argentina | |
| Rest of South America |
| By Component | Solutions | |
| Services | ||
| By Deployment Model | On-Premises | |
| Cloud-Based (Public, Private, Hybrid) | ||
| By Application | Mobile Data Policy Control | |
| Voice/VoLTE and IMS Policy | ||
| Roaming and Interconnect Policy | ||
| Security/Parental-Control and Content Policy | ||
| By Operator Type | Mobile Network Operators (MNO) | |
| Fixed/Broadband Operators | ||
| Mobile Virtual Network Operators (MVNO) | ||
| By Geography | North America | United States |
| Canada | ||
| Mexico | ||
| Europe | Germany | |
| United Kingdom | ||
| France | ||
| Italy | ||
| Spain | ||
| Netherlands | ||
| Russia | ||
| Rest of Europe | ||
| Asia-Pacific | China | |
| Japan | ||
| India | ||
| South Korea | ||
| Australia and New Zealand | ||
| ASEAN | ||
| Rest of Asia-Pacific | ||
| Middle East | Saudi Arabia | |
| United Arab Emirates | ||
| Turkey | ||
| Rest of Middle East | ||
| Africa | South Africa | |
| Nigeria | ||
| Egypt | ||
| Rest of Africa | ||
| South America | Brazil | |
| Argentina | ||
| Rest of South America | ||


Key Questions Answered in the Report
What is the current value of the policy management in telecom industry market?
The policy management in telecom industry market size stood at USD 2.66 billion in 2026 and is set to reach USD 4.32 billion by 2031, according to Mordor Intelligence.
How fast will cloud-based deployments grow within this space?
Cloud implementations are projected to expand at a 14.80% CAGR between 2026 and 2031 as operators pursue elastic scaling and capital efficiency.
Which application area is advancing the quickest?
Artificial-intelligence-assisted dynamic quality-of-service policies are forecast to grow at 15.30% annually, the fastest among application segments.
Why are MVNOs important to future growth?
Mobile virtual network operators are scaling at 12.60% a year because cloud policy stacks let them launch offers rapidly without heavy core-network investments.
Which region offers the highest growth potential?
Asia-Pacific is expected to record the fastest regional CAGR at 15.80% through 2031, propelled by large-scale 5G rollouts and supportive industrial policy.
Who are the leading market players after recent consolidation?
Huawei, Amdocs, Ericsson, Netcracker, Nokia, and the newly integrated MATRIXX unit collectively account for about 70% of global revenue, based on Mordor Intelligence research.
Page last updated on:


