
Poland Hyperscale Data Center Market Size and Share
Market Overview
| Study Period | 2020 - 2031 |
|---|---|
| Forecast Data Period | 2026 - 2031 |
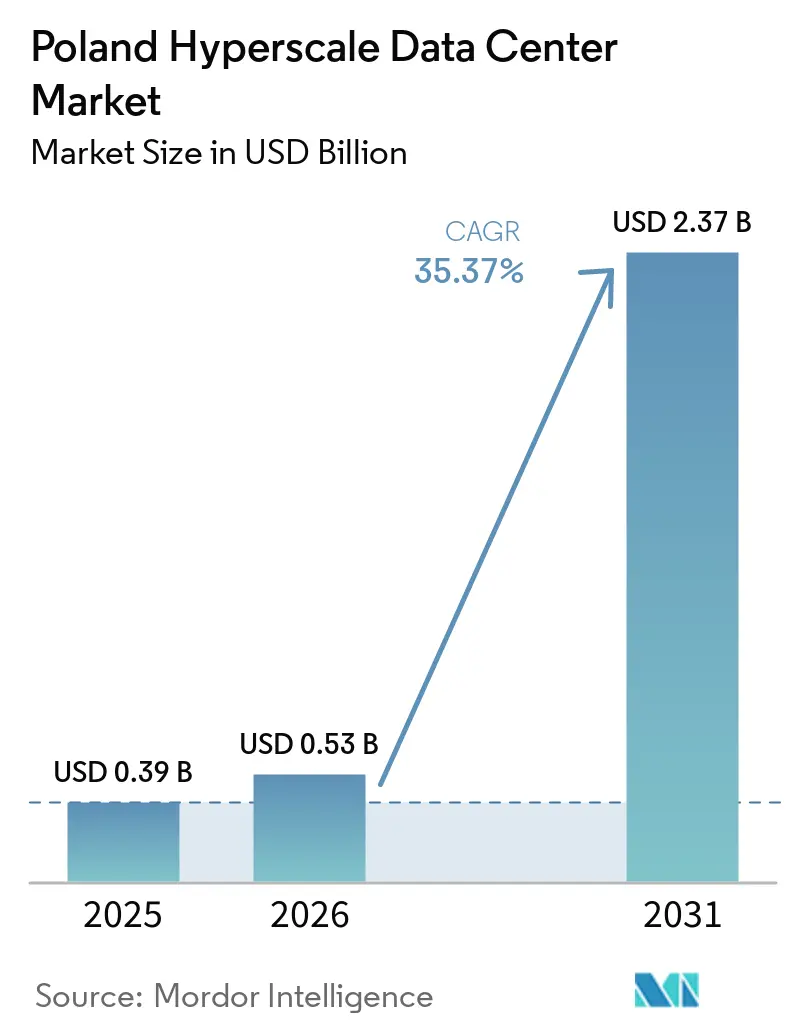
| Base Year Market Size (2025) | USD 0.39 Billion |
| Market Size (2026) | USD 0.53 Billion |
| Market Size (2031) | USD 2.37 Billion |
| Growth Rate (2026 - 2031) | 35.37 % |
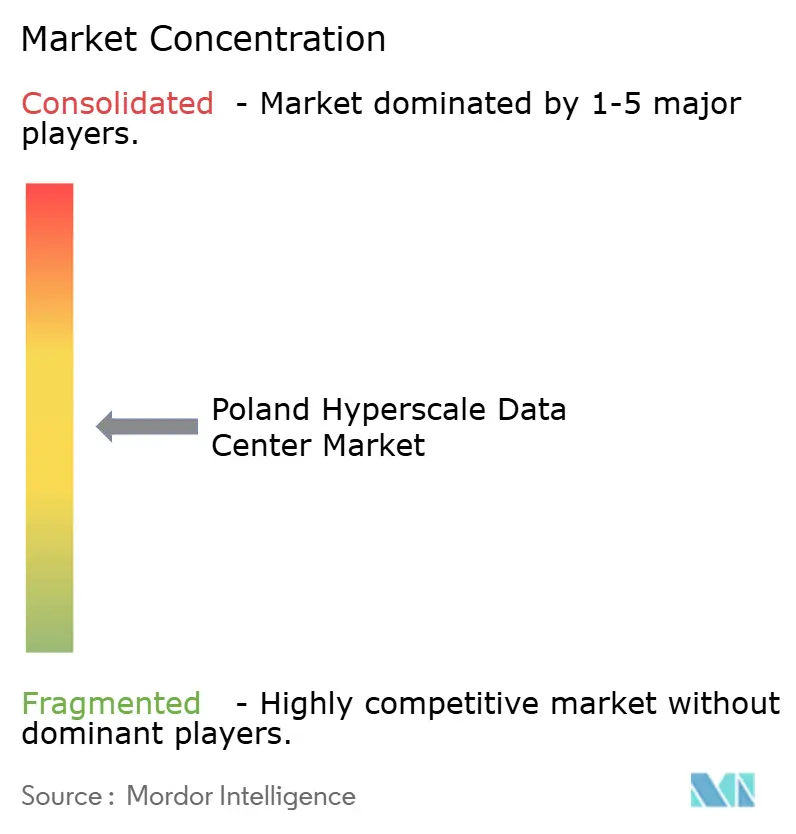
| Market Concentration | Medium |
Major Players *Disclaimer: Major Players sorted in no particular order Image © Mordor Intelligence. Reuse requires attribution under CC BY 4.0. | |
Poland Hyperscale Data Center Market Analysis by Mordor Intelligence
The Poland Hyperscale Data Center Market size was valued at USD 0.39 billion in 2025 and is estimated to grow from USD 0.53 billion in 2026 to reach USD 2.37 billion by 2031, at a CAGR of 35.37% during the forecast period (2026-2031). In terms of production volume, the market was valued at 0.35 thousand megawatt in 2025 and is expected to grow from 0.38 thousand megawatt in 2026 to 3.10 thousand megawatt by 2031, at a CAGR of 52.08% during the forecast period (2026-2031).
Rising sovereign-cloud mandates, billion-dollar hyperscaler commitments and Poland’s relatively low operating-cost base have combined to create a decisive pull for new deployments. Operators are prioritizing renewable power purchase agreements (PPAs), liquid-cooling retrofits, and advanced data center infrastructure management (DCIM) suites to balance escalating power densities with sustainability targets. The colocation segment remains dominant, yet hyperscaler self-builds are accelerating the fastest as Microsoft, Google, and AWS race to establish regional sovereign cloud zones. Elevated capacity-market fees and high-voltage talent shortages temper the outlook but have not slowed near-term site acquisition, particularly around Warsaw, Kraków, and Poznań. Pricing power is shifting toward AI-ready facilities, a trend underscored by Beyond.pl’s 100 MW sovereign AI factory designed for liquid-cooled GPU clusters.
Key Report Takeaways
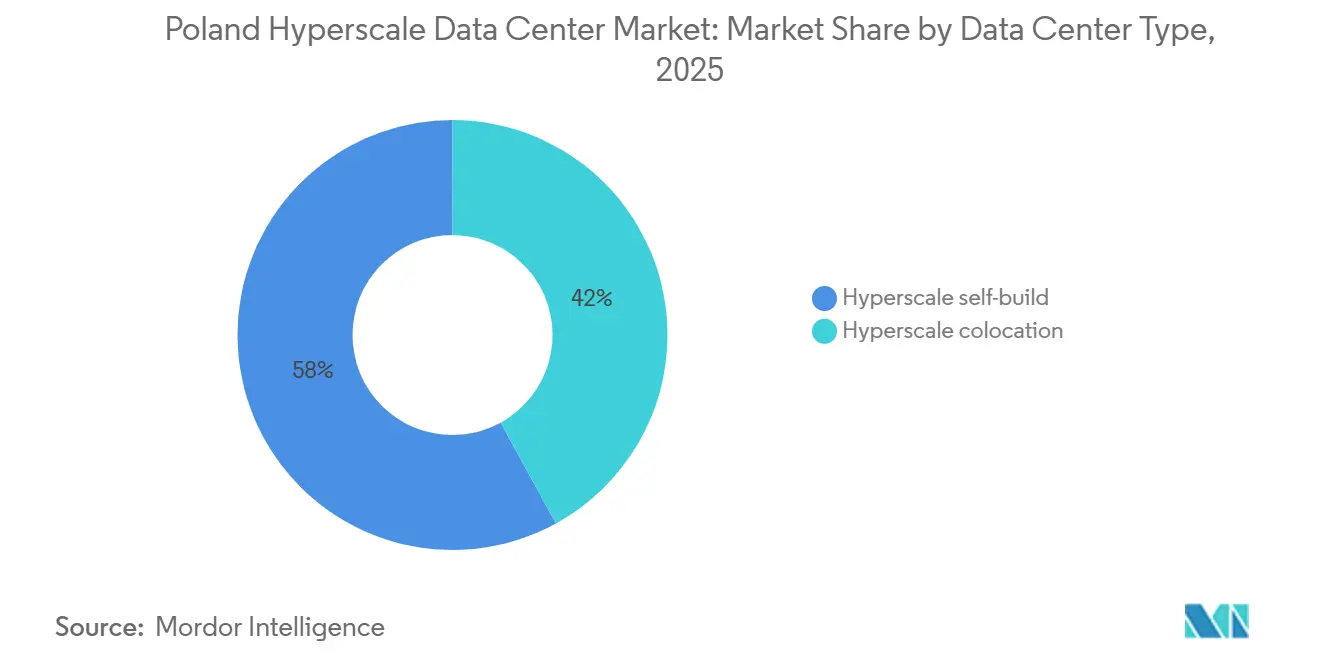
- By data center type, hyperscale colocation accounted for 58% of the Poland hyperscale data center market share in 2025, whereas hyperscaler self-build facilities are projected to grow at an 18.40% CAGR through 2031.
- By component, IT infrastructure accounted for 42% of the Poland hyperscale data center market size in 2025, while cooling systems are forecast to expand at a 22.70% CAGR through 2031.
- By tier standard, Tier III sites accounted for 71% of capacity in 2025; Tier IV facilities are predicted to rise at a 19.10% CAGR through 2031.
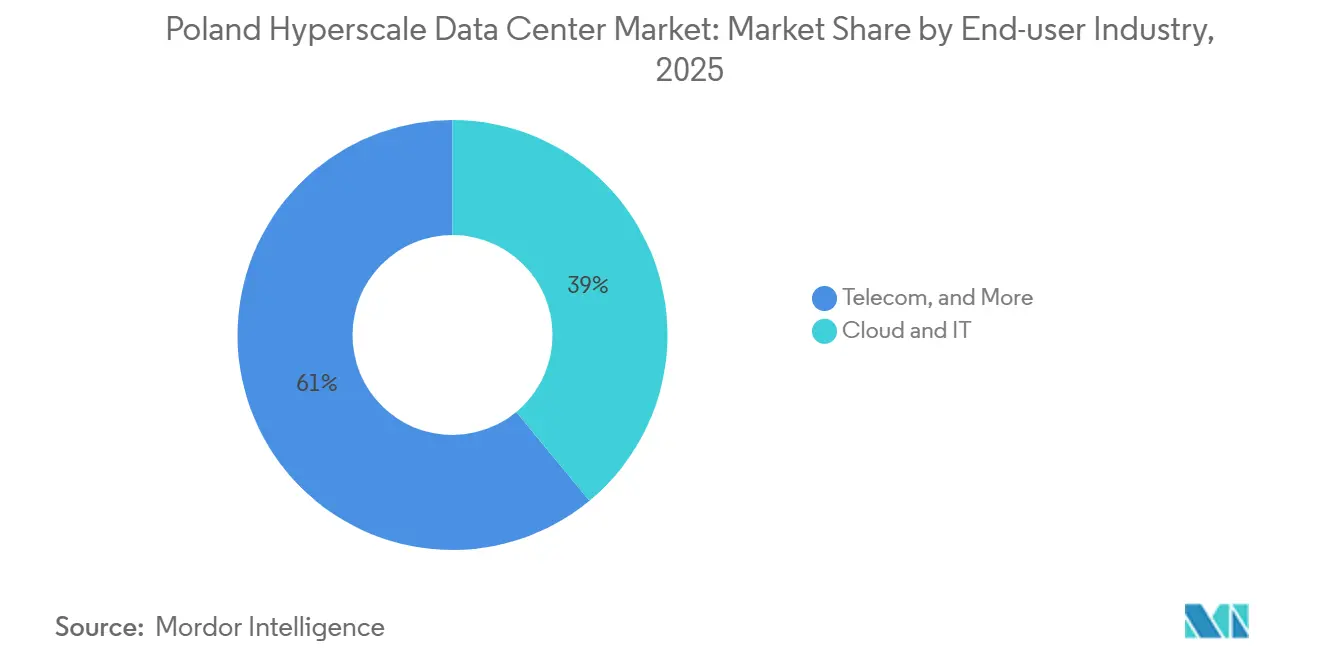
- By end-user industry, cloud and IT captured 39% revenue share in 2025 and are set to post a 24.30% CAGR to 2031.
- By data center size, massive-scale deployments (greater than 25 MW and less than or equal to 60 MW) controlled 46% of the Poland hyperscale data center market size in 2025, whereas mega (greater than 60 MW) scale builds should advance at a 20.80% CAGR between 2026–2031.
Poland Hyperscale Data Center Market Trends and Insights
Drivers Impact Analysis*
| Driver | (~) % Impact on CAGR Forecast | Geographic Relevance | Impact Timeline |
|---|---|---|---|
| Cloud-region roll-outs by hyperscalers | +8.20% | National; Warsaw, Kraków, Poznań corridors | Medium term (2-4 years) |
| Sovereign-cloud mandates and GDPR edge zones | +6.80% | EU-wide with Poland as strategic hub | Short term (≤ 2 years) |
| Renewable PPAs tapping Poland’s solar-PV boom | +4.10% | National; strongest in southern voivodeships | Long term (≥ 4 years) |
| DCIM/AI automation cuts opex and outage risks | +3.70% | Global trend with local adoption | Medium term (2-4 years) |
| Liquid-cooling for LLM/GPU clusters | +5.90% | National; AI-ready campuses | Short term (≤ 2 years) |
| SMR-based on-site micro-nuclear pilots | +2.10% | Pilot projects in industrial zones | Long term (≥ 4 years) |
| Source: Mordor Intelligence | |||
Cloud-Region Roll-Outs by Hyperscalers
Microsoft’s PLN 2.8 billion (USD 705 million) commitment made in February 2025 marks the single largest hyperscaler project ever announced in Poland, encompassing cloud, AI and cyber-security capabilities [1]. Similar multibillion-zloty programs by Google place Kraków and Poznań on the hyperscale map, reflecting a strategy to diversify workloads beyond Warsaw’s congested grid. Amazon’s broader European sovereign-cloud blueprint further elevates the Poland hyperscale data center market as a secondary but critical node for workload spill-over from FLAP-D hubs. Together, these roll-outs sharpen competition, accelerate land-banking and intensify demand for 100 MW-class greenfield campuses.
Sovereign-Cloud Mandates and GDPR Edge Zones
European data-sovereignty rules are forcing workloads to remain inside EU jurisdiction; Poland’s dual EU-NATO membership and favorable cost profile make it an ideal sovereign-cloud anchor. Microsoft’s collaboration with the Polish government on cyber-security showcases the regulatory pull for compliant in-country infrastructure. Beyond.pl’s “Sovereign AI Factory” keeps training datasets within Polish borders while still addressing EU-wide demand, illustrating how local operators monetize compliance.
Renewable PPAs Tapping Poland’s Solar-PV Boom
PPA volumes are surging as data-center operators lock in multi-decade agreements with solar developers like BayWa r.e., whose subsidy-free 64.6 MWp Witnica array set a precedent for zero-subsidy corporate PPAs [2]. A project pipeline exceeding 1 GW positions hyperscale campuses to meet Net-Zero targets and hedge against volatile grid-power prices. Early movers secure favorable tariffs before industrial demand tightens PPA pricing, preserving long-term margin upside.
Liquid-Cooling for LLM/GPU Clusters
AI workloads have lifted rack power densities well beyond 50 kW, making liquid cooling indispensable. CoreWeave’s Polish build-outs center on direct-to-chip coolant loops that dissipate heat at lower PUE than comparable air-cooled systems. Containerized solutions from Grando host 2,240 GPUs per module, enabling rapid swing capacity for model-training bursts. Operators with engineering depth gain a durable advantage as cooling complexity deters new entrants.
Restraints Impact Analysis*
| Restraint | (~) % Impact on CAGR Forecast | Geographic Relevance | Impact Timeline |
|---|---|---|---|
| Grid congestion and rising capacity-market fees | –4.3% | National; acute in Warsaw metro | Short term (≤ 2 years) |
| Scarcity of HV/MV talent and escalating wages | –2.8% | Major cities country-wide | Medium term (2-4 years) |
| Water-use restrictions in drought-prone areas | –1.9% | Southern and central voivodeships | Long term (≥ 4 years) |
| EU chip-act-driven GPU export skew | –2.1% | EU-wide, Poland secondary | Medium term (2-4 years) |
| Source: Mordor Intelligence | |||
Grid Congestion and Rising Capacity-Market Fees
Warsaw’s transmission queue has outstripped available capacity, prompting the PSE grid operator to impose advance payment rules and higher non-refundable fees, extending connection lead-times beyond 36 months [3]. Parallel reforms in Germany hint at a regional trend that challenges metro-centric build strategies. Developers are now scouting secondary cities, yet transmission upgrades lag demand, tempering the Poland hyperscale data center market growth curve.
Scarcity of HV/MV Talent and Escalating Wages
Only 8.33% of Polish manufacturers have implemented Industry 4.0 solutions, signaling upcoming competition for the same high-voltage engineers required by data centers. Wage inflation for senior electrical-design roles exceeded 12% in 2024, squeezing smaller colocation providers that cannot match hyperscaler salary grids. Flex’s decision to double its Polish power-infrastructure output adds pressure by diverting talent to equipment manufacturing
*Our forecasts treat driver/restraint impacts as directional, not additive. The impact forecasts reflect baseline growth, mix effects, and variable interactions.
Segment Analysis
By Data Center Type: Self-Build Momentum Accelerates
The segment generated the largest uplift in the Polish hyperscale data center market in 2025, as hyperscalers' self-builds targeted AI-centric campuses. Value climbed at an 18.40% CAGR, despite colocation maintaining a 58% stake in 2025. Microsoft customizes rack-level power topologies to feed GPU clusters, while Google splits its footprint between self-built fabrication in Kraków and leased halls in Poznań for latency-sensitive edge nodes.
Colocation remains relevant for enterprise lift-and-shift workloads needing sovereign hosting without capex exposure. Beyond.pl aligns with this niche by bundling AI accelerators into colocation service-level agreements, effectively hybridizing the model. Over the forecast horizon, the Polish hyperscale data center market is likely to bifurcate: deep-pocketed hyperscalers will own strategic AI zones, whereas colocation specialists will pivot to mid-density enterprise tenants needing GDPR-compliant footprints across multiple Polish metros.
By Component: Cooling Systems Drive Infrastructure Evolution
Cooling products captured the fastest revenue growth rate, topping 22.70% CAGR, even as IT infrastructure locked in a 42% value share in 2025. The Poland hyperscale data center market size for cooling alone is projected to more than triple by 2031 because every new GPU rack pushes facility PUE targets below 1.2. Operators are phasing in rear-door heat exchangers before migrating to direct-to-chip cold-plate loops, thereby future-proofing for 100 kW-per-cabinet densities.
Electrical gear, UPS, switchgear, and busways follow suit, upgraded to 415 V and 800 V topologies to reduce current while supporting megawatt-scale GPUs. Mechanical floor space is expanded to accommodate larger pumps and redundant coolant manifolds. Grando’s containerized liquid-cooled modules allow operators to test-bed two-phase immersion before committing capital to full-scale retrofits. Consequently, the Polish hyperscale data center market increasingly values engineering integration services as much as hardware spend, accelerating vendor consolidation.
By Tier Standard: Tier IV Growth Reflects AI Reliability Requirements
Tier III held 71% share yet the Poland hyperscale data center market size for Tier IV sites is set to outpace at 19.10% CAGR. AI training failures triggered by power events can waste millions of GPU-hours, making 2N+1 redundancy a rational cost. Beyond.pl’s sovereign campus and Atman’s WAW 3 project both integrate independent utility feeds and looped chilled-water circuits to achieve 99.995% availability.
Meanwhile, Tier III remains optimal for latency-balanced edge nodes and content delivery clusters where horizontal redundancy mitigates risk. The two-tier stratification boosts design-build firms specializing in concurrently maintainable Tier III shells that include optional Tier IV equipment galleries, offering tenants a step-up path without new greenfield builds.
By End-User Industry: Cloud and IT Dominance Intensifies
Cloud and IT workloads accounted for 39% of revenue and are forecast to grow at a 24.30% CAGR, making them the largest component of the Poland hyperscale data center market. Bank and fintech migration to SaaS-style core systems adds peak loads; Alior Bank shifted analytics to Azure-native VantageCloud in 2024, spurring further hyperscaler wins.
Telecom operators sustain traffic-engineering density via fiber joint ventures. Orange’s PLN 2.75 billion FiberCo raised 2.4 million last-mile links, reinforcing edge interconnectivity. Industry 4.0 and e-commerce segments lag in absolute MW terms, but sprint in relative growth as machine-vision quality control and real-time inventory dashboards become mainstream across Poland’s resilient manufacturing base.

By Data Center Size: Mega-Scale Facilities Capture AI Demand
Massive-scale (greater than 25 MW and less than or equal to 60 MW) halls accounted for 46% of Poland's hyperscale data center market size in 2025 and remain the core pattern for multi-regional cloud availability zones. However, mega-scale builds will leap ahead at a 20.80% CAGR, driven by single-tenant AI laboratories that require contiguous power blocks. Beyond.pl’s 100 MW sovereign campus and Switch Datacenters’ 30 MW Warsaw design illustrate a broader swing to larger greenfield parcels near suburban substations.
Large facilities still fit latency-constrained metro plots but face diminishing economies of scale as liquid cooling inflates mechanical footprints. The next cycle will likely feature modular, megascale clusters connected by dedicated 110 kV feeders, enhancing leverage in grid-capacity negotiations while enabling staged capital deployment.
Geography Analysis
Warsaw anchors the Poland hyperscale data center market with the most sovereign-cloud on-ramps, underscored by Microsoft’s USD 705 million campus and Switch Datacenters’ high-density site. Kraków and Poznań have emerged as satellite growth rings where land is cheaper and renewable PPAs are plentiful, as evidenced by Google’s AI supercomputer initiative. Secondary metros provide relief from Warsaw’s gridlock while tapping into the country’s pool of 400,000+ IT specialists concentrated in academic hubs.
Southern voivodeships such as Lubusz and Silesia combine solar irradiance with industrial loads; BayWa r.e.’s Witnica plant offers an illustrative PPA template that data-center operators can replicate to achieve scope-2 emissions reductions. Longitudinal drought studies in the Lusatian Neisse basin alert operators to future water-use restrictions and spotlight immersion-cooling designs that reduce evaporative consumption.
EU structural funds earmarked for grid resilience and a national plan to steer 5% of GDP toward transformation by 2035 ensure ongoing infrastructure build-outs, yet connection moratoria in the Warsaw metro push area developers toward greenfield industrial parks with faster interconnection timelines, resulting in dispersion that enhances edge-computing coverage for Industry 4.0 clusters leveraging Poland’s manufacturing ascendancy.
Competitive Landscape
The Poland hyperscale data center industry displays moderate concentration. Microsoft and Google head the field through sovereign-cloud privileges and large cap-ex commitments, while AWS leverages broader EU initiatives for spill-over capacity. Local champion Atman secured USD 344 million in ESG-linked financing to triple Warsaw capacity, signalling confidence in premium AI-ready colocation. Beyond.pl differentiates via a sovereign AI campus and partnership-driven liquid-cooling expertise that attracts both government and regulated-enterprise workloads.
Market entry barriers tighten as liquid-cooling, higher-tier designs and renewable PPAs inflate up-front capital. Equipment makers such as Flex deepen the local supply chain, shortening lead times for switchgear and busways and thus strengthening home-grown cluster resilience. Emerging modular-nuclear pilots led by KGHM-NuScale offer future-proof baseload power, a potential game-changer for GPU farms thirsting for long-duration carbon-free electricity. The broader theme is specialization: operators that master regulatory nuance, AI-grade engineering and renewable-energy arbitrage will capture disproportionate value as the Poland hyperscale data center market matures.
Poland Hyperscale Data Center Industry Leaders
-
Amazon Web Services Inc.
-
Google LLC
-
Meta Platforms, Inc.
-
Equinix, Inc.
-
Vantage Data Centers
- *Disclaimer: Major Players sorted in no particular order
Recent Industry Developments
- May 2025: Microsoft announced a PLN 2.8 billion (approximately USD 700 million) investment in cloud and AI technologies in Poland, significantly expanding its data center footprint to support growing demand for digital transformation services and establish the country as a regional AI hub.
- March 2025: Vantage Data Centers announced plans for a 64 MW campus in Warsaw, designed to support hyperscale requirements with advanced cooling technologies and renewable energy integration, reinforcing Warsaw's position as a magnet for international data center investments.
- January 2025: Polcom announced plans to build two new data centers near Krakow, expanding the company's capacity to serve both domestic and international clients while contributing to the development of Poland's secondary data center markets beyond Warsaw.
- February 2025: Amazon began operations at the Miłkowice Solar Farm, securing 140 MW of clean power for local facilities
Research Methodology Framework and Report Scope
Market Definitions and Key Coverage
Our study defines the Poland hyperscale data center market as all greenfield or major-expansion facilities located in Poland whose designed IT load exceeds 4 MW per hall and where ownership or long-term lease rests with global cloud platforms or single-tenant digital businesses. Revenues span the initial infrastructure build cost booked in the year it goes live and the recurring service income associated with the hyperscale footprint.
Scope exclusion: Enterprise, edge, and retail colocation halls below 4 MW, plus minor retrofit or equipment-refresh projects, sit outside this baseline.
Segmentation Overview
- By Data Center Type
- Hyperscale Self-Build
- Hyperscale Colocation
- By Component
- IT Infrastructure
- Server Infrastructure
- Storage Infrastructure
- Network Infrastructure
- Electrical Infrastructure
- Power Distribution Unit
- Transfer Switches and Switchgears
- UPS Systems
- Generators
- Other Electrical Infrastructure
- Mechanical Infrastructure
- Cooling Systems
- Racks
- Other Mechanical Infrastructure
- General Construction
- Core and Shell Development
- Installation and Commisioning Services
- Design Engineering
- Fire Detection, Suppression and Physical Security
- DCIM/BMS Solutions
- IT Infrastructure
- By Tier Standard
- Tier III
- Tier IV
- By End-User Industry
- Cloud and IT
- Telecom
- Media and Entertainment
- Government
- BFSI
- Manufacturing
- E-Commerce
- Other End Users
- By Data Center Size
- Large (Less than equal to 25 MW)
- Massive (Greater than 25 MW and less than equal to 60 MW)
- Mega (Greater than 60 MW)
Detailed Research Methodology and Data Validation
Primary Research
Mordor analysts held structured interviews with design-build contractors, colocation executives, utility planners, and cloud-region leads across Warsaw, Poznań, and Wrocław. Conversations clarified live versus permitted MW, average price per deployed MW, and contract utilization ramps, letting us bridge gaps that public data alone leaves.
Desk Research
We began by extracting foundation data from open sources such as Statistics Poland on fixed-broadband penetration, the Office of Electronic Communications on IP traffic growth, PSE grid connection releases, Eurostat power-price indices, and policy papers from the Polish Data Centre Association. Company filings, press releases, and investor decks added timing and size of build commitments. Our team also screened D&B Hoovers for hyperscaler subsidiary financials, Dow Jones Factiva for project newsflow, and Volza shipment logs for rack and cooling imports. These sources anchor the demand pool and cost curves; many additional references were consulted and are available on file.
Market-Sizing & Forecasting
A top-down model converts Poland's committed hyperscale pipeline into annual market value by rolling each campus's MW schedule through benchmark cost per MW, then layering service revenue captured from negotiated lease rates. Results are cross-checked through selective bottom-up proxies, supplier rack shipments and sampled ASP × volume estimates, for plausibility before adjustment. Key variables include installed IT load, hyperscaler capex announcements, average power usage effectiveness, cloud-adoption growth, energy tariff trends, and PLN-USD movements. Forecasts rely on multivariate regression blended with scenario analysis to capture swings in energy policy or supply-chain lead times. Where bottom-up gaps remain, conservative interpolation guided by primary respondent consensus is applied.
Data Validation & Update Cycle
Outputs pass anomaly checks against independent capacity trackers, then a senior analyst reviews every assumption. We refresh the model each year and trigger interim updates when megawatt releases, policy shifts, or major M&A would materially move the base.
Why Mordor's Poland Hyperscale Data Center Baseline Commands Reliability
Published estimates differ because firms pick dissimilar scopes, metrics, and refresh cadences.
Exchange-rate choices and whether they count announced capex or realized revenue further widen gaps.
Benchmark comparison
| Market Size | Anonymized source | Primary gap driver |
|---|---|---|
| USD 385.87 million (2025) | Mordor Intelligence | - |
| USD 810 million (2023) | Global Consultancy A | Blends hyperscale with large colocation, relies on desktop extrapolation, limited expert validation |
| USD 1.15 billion (2024) | Regional Consultancy B | Reports investment outlays for all data-center types rather than booked revenue, omits pipeline attrition factors |
In sum, Mordor's disciplined scope, dual-sourced variables, and annual refresh give decision-makers a traceable, balanced baseline they can confidently plug into budgeting and location strategy.
Key Questions Answered in the Report
How fast is Poland adding new hyperscale data-center capacity?
Installed IT load is set to climb from 0.35 MW in 2025 to 3.10 MW by 2031, an 52.08% CAGR that underpins sustained infrastructure build-outs.
What is driving hyperscaler interest in Poland?
Sovereign-cloud mandates, GDPR enforcement, renewable-energy PPAs and lower land-power costs relative to FLAP-D cities attract Microsoft, Google and AWS.
Are liquid-cooling solutions becoming standard in Polish facilities?
Yes; AI-training racks exceeding 50 kW make liquid cooling essential, propelling the cooling-systems segment at a 22.70% CAGR.
Which Polish city offers the greatest hyperscale growth runway beyond Warsaw?
Kraków is emerging as a prime secondary hub, benefiting from Google’s AI supercomputer investment and less-congested grid interconnection queues.
How significant are renewable PPAs for data-center operators in Poland?
Solar contracts such as BayWa r.e.’s Witnica PPA provide long-term price stability and help operators line up with hyperscaler Net-Zero goals.
What tier standard best fits AI workloads in Poland?
Tier IV facilities, growing at 19.10% CAGR, deliver 2N+1 redundancy that minimizes expensive GPU-training interruptions.
- Data Center Construction Market Construction across the global market, covering tier, facility size and facility type.
- Artificial Intelligence (AI) Data Center Market AI facilities across all regions, split by facility type, component and tier.
- Data Center Server Market Global servers demand, split by tier, facility size and facility type.
- Poland Data Center Networking Market Poland networking, split by component, end-user and data-center type.
- Poland Data Center Power Market Poland power systems, split by component, facility type and facility size.
- Middle East and Africa Data Center GPU Market The Middle East and Africa GPUs, split by deployment type, gpu type and interconnect.
- Data Center Logical Security Market Global network security demand, split by solution, service and end user.
- Poland Data Center Rack Market Racks demand across Poland, covering rack size, rack type and tier.
- Spain Data Center Power Market Spain power systems, split by component, facility type and facility size.