Norway Hyperscale Data Center Market Size and Share
Market Overview
| Study Period | 2019 - 2031 |
|---|---|
| Forecast Data Period | 2025 - 2031 |
| Historical Data Period | 2019 - 2023 |
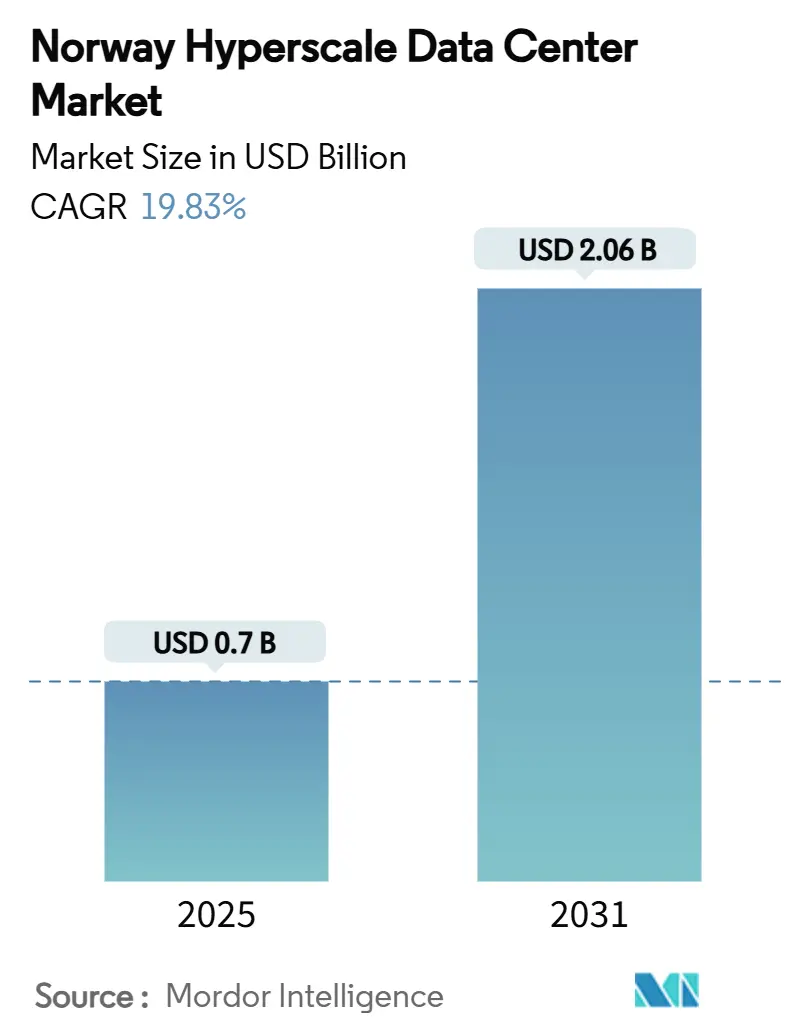
| Market Size (2025) | USD 0.7 Billion |
| Market Size (2031) | USD 2.06 Billion |
| Growth Rate (2025 - 2031) | 19.83% CAGR |
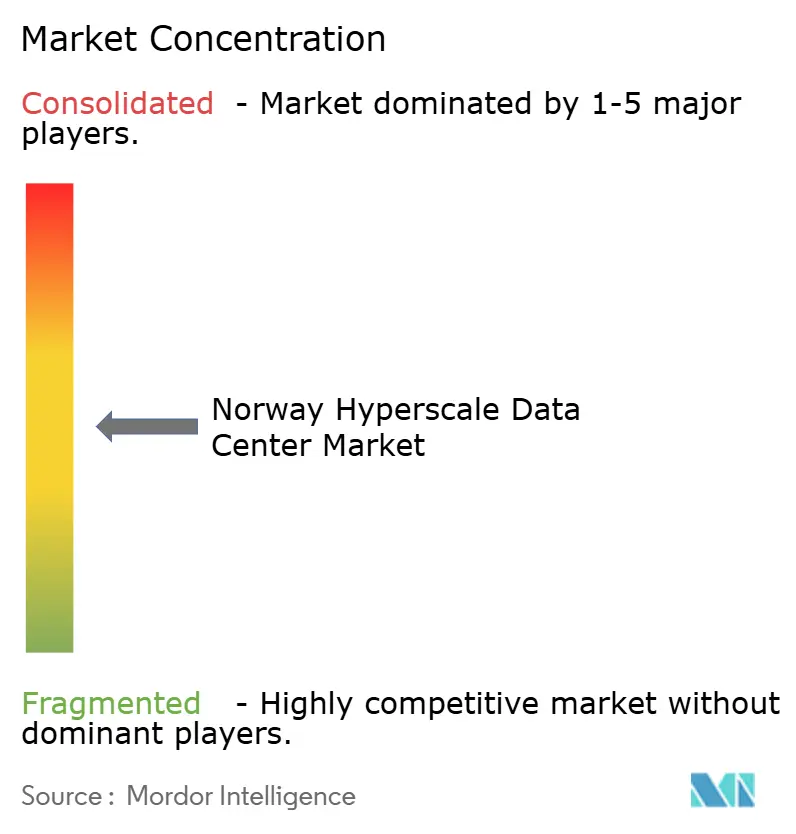
| Market Concentration | Medium |
Major Players *Disclaimer: Major Players sorted in no particular order Image © Mordor Intelligence. Reuse requires attribution under CC BY 4.0. | |
Norway Hyperscale Data Center Market Analysis by Mordor Intelligence
The Norway hyperscale data center market size reached USD 696.89 million in 2025 and is forecast to advance to USD 2,063.71 million by 2031, reflecting a robust 19.83% CAGR. Rising demand for sovereign-cloud services, low-carbon AI workloads, and multi-megawatt renewable-energy contracts underpin this expansion. Operators benefit from wholesale electricity prices below EUR 0.05/kWh, Arctic-grade free-air cooling, and a policy framework that favors local and allied infrastructure providers. Competitive momentum is reinforced by hyperscaler self-build strategies, a swift shift toward liquid-cooled GPU clusters, and material cost pressures that encourage modular construction. As a result, the Norway hyperscale data center market stands out as a preferred European node for energy-intensive cloud and AI deployments, while the sector’s moderate consolidation creates scope for specialist entrants targeting niche workloads
Key Report Takeaways
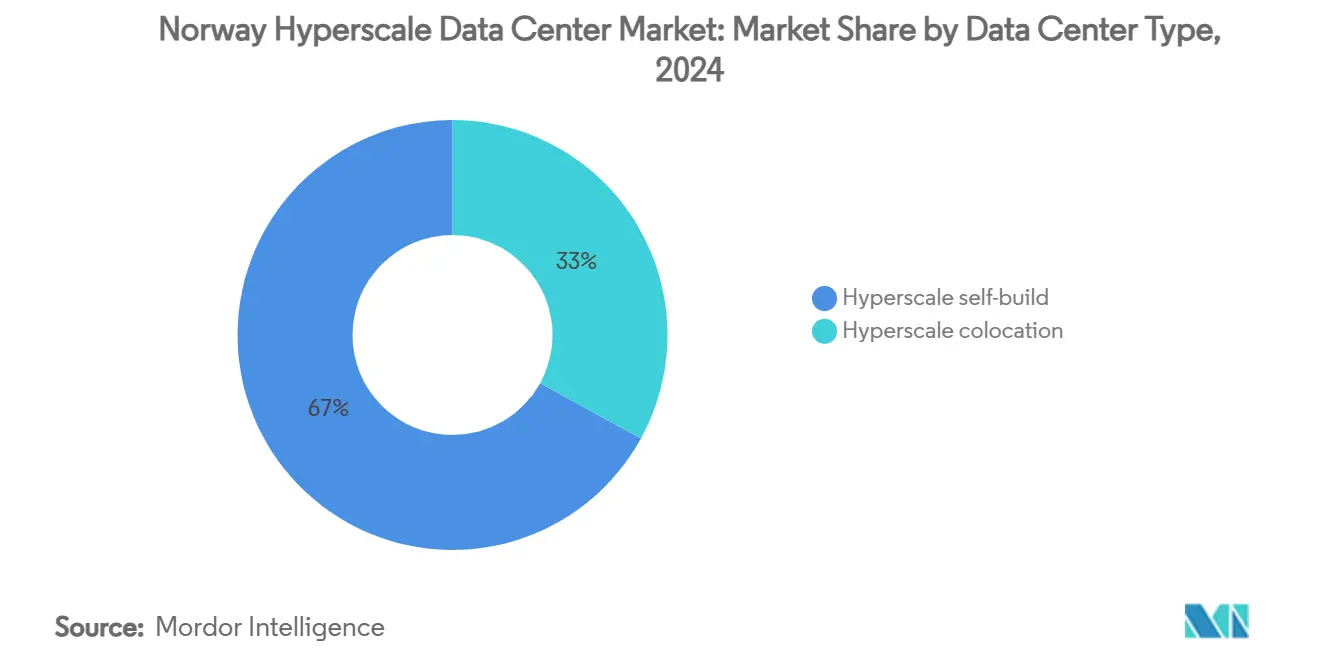
- By data center type, self-build facilities held 67% of the Norway hyperscale data center market share in 2024, while hyperscale colocation recorded the fastest projected 12.4% CAGR through 2031.
- By component, IT infrastructure commanded 41% of the Norway hyperscale data center market size in 2024; mechanical infrastructure, chiefly advanced cooling, is projected to expand at a 14.8% CAGR to 2031.
- By tier standard, Tier III facilities captured 78% revenue share in 2024, whereas Tier IV is forecast to rise at an 11.6% CAGR through 2031.
- By end-user industry, cloud and IT services led with 52% share in 2024, and the segment is set to grow at a 12.5% CAGR.
- By data center size, massive sites represented 39.5% share in 2024; mega sites show the fastest 11.5% CAGR outlook.
Norway holds a defined position within a broader international distribution. The hyperscale data center market share data by Mordor Intelligence maps that allocation across all contributing countries and regions, globally.
Norway Hyperscale Data Center Market Trends and Insights
Drivers Impact Analysis*
| Driver | (~) % Impact on CAGR Forecast | Geographic Relevance | Impact Timeline |
|---|---|---|---|
| Sovereign-cloud mandates | +3.2% | National, Eastern Norway focus | Medium term (2-4 years) |
| Sub-400 ms EU latency thresholds | +2.8% | National, Nordic spillover | Long term (≥ 4 years) |
| Renewable-hydro PPAs less than EUR 0.05/kWh | +4.1% | National, strongest in North and West | Long term (≥ 4 years) |
| Heat-reuse subsidies | +1.9% | National, urban concentration | Medium term (2-4 years) |
| GenAI clusters less than 45 gCO₂/kWh | +3.7% | National, Northern advantage | Short term (≤ 2 years) |
| Digital-twin and HPC projects | +2.1% | National, research hubs | Medium term (2-4 years) |
| Source: Mordor Intelligence | |||
Surge in sovereign-cloud mandates for critical public-sector workloads
Government policy now requires sensitive services to reside on domestically controlled infrastructure that meets strict data-sovereignty criteria. Partnerships such as Telenor–AWS are structured around Norwegian legal entities, local key-management, and in-country operations, prompting hyperscalers to build dedicated campuses that align with these rules [1].Norwegian Ministry of Digitalisation and Public Governance, “The Digital Norway of the Future – National Digitalisation Strategy 2024–2030,” regjeringen.no Sovereign requirements therefore accelerate direct investment and favor local players able to certify compliance.
Sub-400 ms EU latency thresholds favoring Nordics as edge-of-core hubs
Norwegian routes deliver sub-400 millisecond round-trip times to more than half of European enterprises, making the country attractive for edge-adjacent workloads that still need substantial processing power. OS-IX’s aggregation of 60+ networks and new submarine cables shrink latency to Frankfurt and London, leading financial-trading, IoT, and mixed-reality providers to expand capacity in and around Oslo.
300 MW-plus renewable-hydro PPAs priced below EUR 0.05/kWh
Long-term hydroelectric contracts fix power costs at levels most Western European markets cannot match, cutting operating expenses by up to 60% for AI-training clusters. Google’s multi-phase Skien campus illustrates the magnitude of cost advantage, with plans to quadruple capacity once initial economics are proven.
GenAI GPU clusters seeking less than 45 gCO₂/kWh locations
Corporate net-zero commitments require low-carbon electricity for multi-petaflop GPU farms. Norway’s grid averages 45 gCO₂/kWh owing to hydropower dominance, satisfying digital-sustainability disclosures under the EU Corporate Sustainability Reporting Directive. Early-mover projects such as Telenor’s NVIDIA-powered AI factory capture a premium from enterprises wishing to train or fine-tune models without offset credits.
Restraints Impact Analysis*
| Restraint | (~) % Impact on CAGR Forecast | Geographic Relevance | Impact Timeline |
|---|---|---|---|
| Scarcity of 132 kV grid slots near Oslo | –2.3% | Eastern Norway | Short term (≤ 2 years) |
| Escalating data-hall property taxes | –1.7% | National | Medium term (2-4 years) |
| Stricter noise regulations | –0.9% | National urban | Medium term (2-4 years) |
| GPU/optic lead-times > 52 weeks | –1.4% | National | Short term (≤ 2 years) |
| Source: Mordor Intelligence | |||
Scarcity of 132 kV grid-connection slots near Oslo
Transmission-operator Statnett received 3,300 MW worth of data-center requests that exceed current metropolitan capacity. Projects now face five-to-ten-year wait-times for high-voltage feeds, delaying new supply and nudging operators toward Northern Norway or modular on-site generation [2].
Escalating property-tax proposals on data halls
Municipalities debate levies that could triple effective local-tax rates for large server farms, citing low head-count-to-capital ratios. Uncertainty over assessments and grandfathering rules complicates site-selection models, potentially reducing near-term economics for new entrants [3].
*Our forecasts treat driver/restraint impacts as directional, not additive. The impact forecasts reflect baseline growth, mix effects, and variable interactions.
Segment Analysis
By Data Center Type: Sovereign self-build dominance with rapid colocation catch-up
Hyperscale self-build campuses maintained 67% of the Norway hyperscale data center market in 2024, as cloud majors deploy bespoke designs to meet sovereign-cloud certifications and integrate AI-specific cooling networks. The segment’s scale enables direct PPAs and on-site substation deployment, anchoring long-duration investment horizons. Hyperscale colocation, although smaller, is projected to grow at 12.4% CAGR as regulated industries seek compliant capacity without owning facilities.
Tenant-led demand ensures a pipeline of multi-tenant halls designed for 30-50 kW/rack densities, prompting specialist Nordic operators to bundle sovereign-kernel services, in-rack liquid cooling, and heat-reuse links to district-energy grids. This flexible model supports enterprises onboarding GPU-rich clusters while retaining the regulatory shield of local ownership.


By Component: Cooling surges ahead of compute spend
IT infrastructure preserved the largest 41% share of the Norway hyperscale data center market size in 2024, reflecting GPU procurement cycles and custom server rollouts. Yet mechanical systems—chiefly direct-to-chip and immersion cooling are set to deliver a 14.8% CAGR as processors exceed 1,000 W per socket, forcing radical heat-extraction approaches.
Operators now specify dual-loop cold-plate cooling, dielectric immersion tanks, and rack-rear door heat exchangers to keep PUE below 1.3 in dense AI halls. Government heat-reuse grants further incentivize investment, with several Oslo and Stavanger sites connecting waste heat to district networks for up to 90% energy-recycling rates.
By Tier Standard: Mainstream Tier III with selective Tier IV build-outs
Tier III sites covered 78% of deployed capacity in 2024, balancing cost and maintainability under Norway’s stable grid and low seismic exposure. Tier IV, while niche, is rising at 11.6% CAGR as banking, defense, and medical-records workloads mandate dual-powered infrastructure and fault-tolerant pathways.
Notably, the underground Lefdal Mine facility delivers natural shielding against electromagnetic disturbance, offering a Tier IV profile for highly sensitive compute clusters that cannot accommodate planned downtime, even with application-level redundancy.
By End-User Industry: Cloud services remain dominant
Cloud and IT services constituted 52% in 2024 share and continue to expand at 12.5% CAGR as Norwegian enterprises move ERP, analytics, and GenAI pipelines to low-carbon hyperscale zones. Telecom operators pivot toward network-cloud convergence, leveraging edge nodes inside data centers to support 5G standalone cores. BFSI and government agencies continue to procure capacity under sovereign mandates, boosting demand for advanced key-management and audit logging.
Manufacturing, media, and e-commerce sectors are smaller yet fast-growing users, relying on burstable GPU clusters for digital-twin simulations, real-time rendering, and seasonal retail peaks. Such diversity anchors steady utilization of both CPU-centric and GPU-rich halls.


By Data Center Size: Mega-scale enters spotlight
Massive-scale campuses represented 39.5% of installed power in 2024, but mega-scale projects show the fastest 11.5% CAGR as AI workloads drive single-site concentrations of more than 10,000 accelerators. Economies of scale allow on-site 300 MW substations, closed-loop cooling plants, and private-fiber ring builds, shrinking marginal MW costs. Large-scale (<25 MW) sites remain essential for edge caching, disaster-recovery, and compliance pockets requiring geographic diversification.
Geography Analysis
Eastern Norway retained 63% share in 2024 thanks to OS-IX peering density, skilled labor, and near-continent latency. Northern Norway, aided by sub-EUR 0.05/kWh hydro and near-free cooling, is projected to grow at 13.9% CAGR, turning former industrial hubs into AI-training zones. Western and Central clusters complement these poles with wind-powered capacity and geographic redundancy.
Eastern Norway’s data-center corridor around Oslo hosts the bulk of carrier hotels, enterprise interconnects, and cloud on-ramps. Its proximity to Frankfurt and London enables financial-trading workloads that cannot tolerate round-trip delays above 20 ms. Despite grid-feed scarcity, top players accept longer permitting cycles to secure connectivity advantages.
Northern Norway’s hydropower surplus underpins substantial investment in AI and HPC clusters that favor the region’s 6-month natural-cooling window. Facilities in Narvik, Bodø, and Glomfjord consistently reach PUE below 1.15, translating to operating-cost savings that drive take-up among model-training start-ups and research consortiums.
Western and Central corridors blend multiple energy sources—run-of-river hydro, onshore wind, and emerging offshore wind—to support clients seeking balanced latency and carbon footprints. These zones offer district-heat off-take schemes that monetize waste thermal energy, further improving sustainability metrics.
Mordor Intelligence delivers a comprehensive view of the hyperscale data center market across all major regions such as Europe, Asia, and North America, alongside country-level analysis for Poland, Italy, Philippines, Canada, Taiwan, and Saudi Arabia, each offering a view of the local market realities.
Competitive Landscape
Global cloud hyperscalers—AWS, Microsoft, Google—anchor the Norway hyperscale data center market with direct self-builds that embed proprietary hardware stacks and bespoke security controls. Nordic specialists such as Bulk Infrastructure, Lefdal Mine, and Green Mountain differentiate through renewable-energy PPAs, underground designs, and district-heat reuse. Their combined strategies keep market concentration moderate and leave room for energy firms like Statkraft and Equinor to enter via vertically integrated power-plus-compute offerings.
Strategic moves emphasize sustainability. Google’s Skien expansion positions the campus among Europe’s lowest-carbon GenAI hubs. Bulk Infrastructure lifted contracted recurring revenue 160% year-on-year on the back of GPU-ready colocation suites. Green Mountain’s submerged-cooling deployments cut cooling power by up to 90%, bolstering operator margins and ESG credentials.
Patent activity underscores competitive intensity in thermal-management research. Inventec now ranks fourth worldwide in liquid-cooling intellectual property, signaling supply-chain maturation that will filter into Nordic builds.
Norway Hyperscale Data Center Industry Leaders
Amazon Web Services Inc.
Microsoft Corporation
Google LLC
Meta Platforms Inc.
Bulk Infrastructure Group AS
- *Disclaimer: Major Players sorted in no particular order

Recent Industry Developments
- February 2025: Telenor launched Norway’s first AI factory with NVIDIA, targeting sovereign AI processing.
- February 2025: Google confirmed a EUR 600 million (USD 678 million) data-center investment in Skien, initially 240 MW.
- January 2025: Microsoft accelerated its Nordic cloud expansion, citing Norway’s renewable energy base.
- December 2024: Hydro inked a long-term renewable-power deal with Å Energi, supporting future data-center loads.
- October 2024: Bulk Infrastructure posted 160% YoY growth in recurring data-center revenue, expanding its N01 campus.


Research Methodology Framework and Report Scope
Market Definitions and Key Coverage
Our study defines Norway's hyperscale data center market as the yearly spending tied to self-built or colocation facilities that support single-tenant IT loads above 4 MW and are operated by cloud, social media, or AI platform owners inside Norwegian borders. We also count recurring infrastructure charges booked by operators once the hall is energized.
Scope exclusion: Edge pods below 1 MW, retail colocation rooms, managed hosting, and any foreign capacity leased by Norwegian firms are not included.
Segmentation Overview
- By Data Center Type
- Hyperscale self-build
- Hyperscale colocation
- By Component
- IT Infrastructure
- Server Infratsructure
- Storage Infrastructure
- Network Infrastructure
- Electrical Infrastructure
- Power Distribution Units
- Transfer Switches and Switchgears
- UPS Systems
- Generators
- Other Electrical Infrastructure
- Mechanical Infrastructure
- Cooling Systems
- Racks
- Other Mechanical Infrastructure
- General Construction
- Core and Shell Development
- Installation and Commisioning Services
- Design Engineering
- Fire Detection, Suppression and Physical Security
- DCIM/BMS Solutions
- IT Infrastructure
- By Tier Standard
- Tier III
- Tier IV
- By End-User Industry
- Cloud and IT
- Telecom
- Media and Entertainment
- Government
- BFSI
- Manufacturing
- E-Commerce
- Other End Users
- By Data Center Size
- Large (Less than equal to 25 MW)
- Massive (Greater than 25 MW and less than equal to 60 MW)
- Mega (Greater than 60 MW)
Detailed Research Methodology and Data Validation
Primary Research
Mordor analysts interviewed facility developers, grid planners, HVAC integrators, and hyperscale procurement leads across Oslo, Vestland, and Nordland. These discussions validated usable power per rack, average build-to-commission cycles, and future GPU cluster density, letting us tighten every conversion factor embedded in the model.
Desk Research
We began by harvesting public datasets from Statnett's grid-connection register, NVE's energy-consumption bulletins, the Norwegian Data Center Industry association dashboards, Eurostat trade files, and customs shipment codes that reveal inbound servers and cooling gear. Company filings and tender notices were pulled through D&B Hoovers and Dow Jones Factiva to map current and planned megawatt footprints. Questel patent analytics then helped us benchmark the pace of liquid-cooling adoption.
Further context came from academic work on free-air cooling, government tax white papers, and credible press interviews that detail PPA pricing and build timelines. The sources above illustrate our approach and are not an exhaustive list.
Market-Sizing & Forecasting
A top-down reconstruction starts with Statnett-approved megawatt queues and historical commissioning rates, which are then valued through a blended NOK per deployed MW curve that we adjust for inflation. Select bottom-up checks, such as supplier rack roll-ups and sampled average selling price times shipped units, fine-tune the totals. Key variables tracked include grid-approved MW, average PUE, NOK-USD exchange, hyperscaler share of new permits, rack density shifts, and prevailing renewable PPA tariffs. A multivariate regression projects each driver to 2031 before scenario bands are applied for grid-delay or tax-change risks. Gaps left by incomplete facility disclosures are bridged with cautiously scaled analogs from comparable Nordic builds.
Data Validation & Update Cycle
Outputs run through variance screens against independent capacity counts and energy-use signals. Senior reviewers probe anomalies and then sign off. Reports refresh every twelve months, and we trigger interim updates when new 50 MW-plus deals, power-tariff shocks, or policy changes surface. A last-mile sense check is completed before client delivery.
Why Our Norway Hyperscale Data Center Baseline Commands Reliability
Published estimates often differ because firms do not track the same facilities, use varying MW-to-value multipliers, or refresh numbers on different cadences.
Key gap drivers in rival work include mixing retail and edge halls into totals, valuing projects at headline capex rather than capital actually deployed, and applying European ASP averages without a NOK conversion that reflects hydro-linked power discounts. Mordor's figure is grounded in facility-level build data and yearly PPA-indexed cost curves, giving decision-makers a stable starting point.
Benchmark comparison
| Market Size | Anonymized source | Primary gap driver |
|---|---|---|
| USD 696.9 M (2025) | Mordor Intelligence | - |
| USD 3.19 B (2024) | Global Consultancy A | Blends enterprise, edge, and hyperscale; uses global ASP without Norway power adjustment |
| USD 1.55 B (2024) | Industry Databook B | Measures investment outlays, not realized revenue; counts multi-year capex at signing |
| USD 398.6 M (2024) | Regional Advisory C | Focuses on colocation rent only and omits self-build hyperscale halls |
In short, our disciplined scoping, variable selection, and annual refresh cadence create a balanced and transparent baseline that clients can trace back to clear Norwegian energy, capacity, and pricing inputs.


Key Questions Answered in the Report
What is the current value of the Norway hyperscale data center market?
The market stands at USD 696.89 million in 2025 and is projected to reach USD 2,063.71 million by 2031.
Which segment holds the largest share by data-center type?
Self-build hyperscaler campuses controlled 67% of 2024 revenue.
Why are operators choosing Northern Norway for new campuses?
Abundant renewable-hydro power priced below EUR 0.05/kWh and Arctic cooling drive lower operating costs.
How fast is the mechanical-infrastructure segment growing?
Cooling and related mechanical systems are forecast to expand at a 14.8% CAGR through 2031.
What grid-connection challenge affects Eastern Norway?
Scarcity of 132 kV transmission slots near Oslo imposes five-to-ten-year wait times for new large connections.
Page last updated on:


