Netherlands Hyperscale Data Center Market Size and Share
Market Overview
| Study Period | 2020 - 2032 |
|---|---|
| Forecast Data Period | 2026 - 2032 |
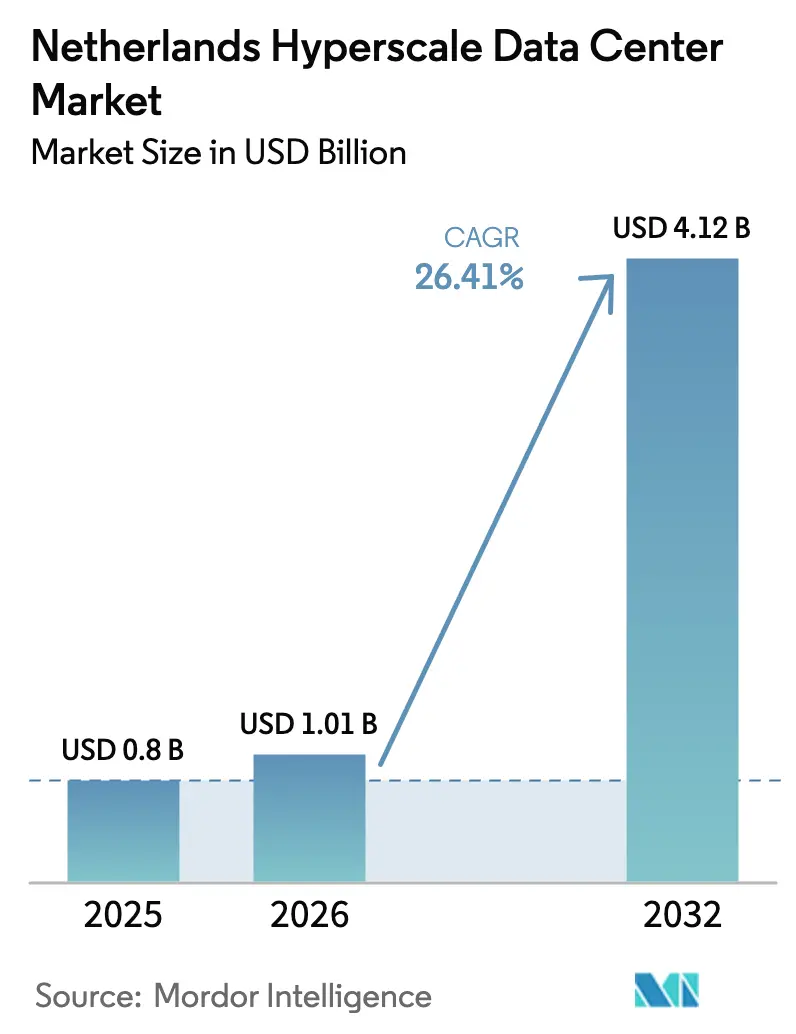
| Base Year Market Size (2025) | USD 0.800 Billion |
| Market Size (2026) | USD 1.01 Billion |
| Market Size (2032) | USD 4.12 Billion |
| Growth Rate (2026 - 2032) | 26.41% CAGR |
| Market Concentration | Medium |
Major Players *Disclaimer: Major Players sorted in no particular order Image © Mordor Intelligence. Reuse requires attribution under CC BY 4.0. | |
Netherlands Hyperscale Data Center Market Analysis by Mordor Intelligence
The Netherlands hyperscale data center market size in 2026 is estimated at USD 1.01 billion, growing from 2025 value of USD 0.800 billion with 2032 projections showing USD 4.12 billion, growing at 26.41% CAGR over 2026-2032. Value growth is propelled by AI-ready facilities that command premium pricing, rapid enterprise cloud migration, and sovereign-cloud mandates that favor locally operated infrastructure. Intensifying grid constraints in North Holland are reshaping site selection, pushing hyperscalers toward Flevoland and other provinces with available power and land. Liquid cooling adoption, GPU-centric rack densities above 50 kW, and rising interest in small modular reactors (SMRs) underline a shift toward energy-efficient, high-density designs. Competitive intensity has climbed after Oracle’s USD 1 billion commitment and continued self-build programs by major cloud providers, prompting colocation firms to differentiate through sustainability and connectivity offerings
Key Report Takeaways
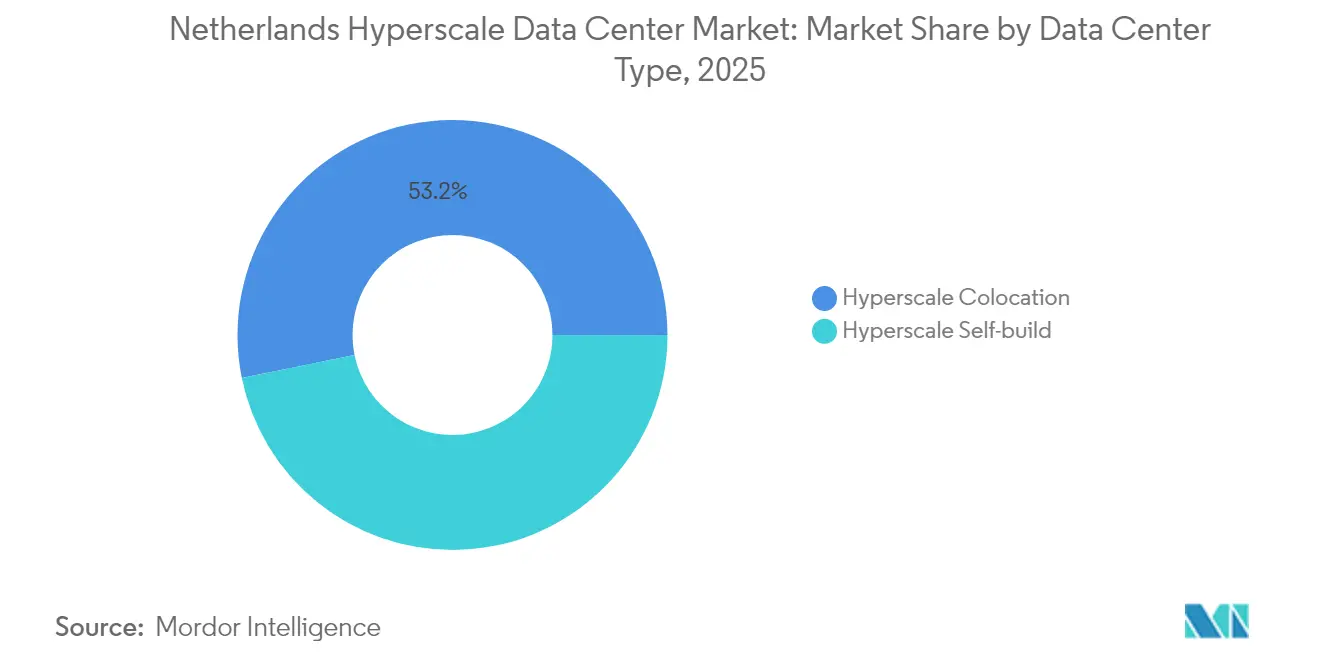
- By data center type, Hyperscale Colocation held 53.20% of the Netherlands hyperscale data center market share in 2025, while Hyperscaler Self-build posted the fastest 12.05% CAGR through 2032.
- By component, IT Infrastructure commanded 46.05% share of the Netherlands hyperscale data center market size in 2025, whereas Liquid-cooling Systems advanced at an 17.35% CAGR to 2032.
- By tier standard, Tier III captured 66.40% share in 2025; Tier IV recorded the highest 9.35% CAGR for 2026-2032.
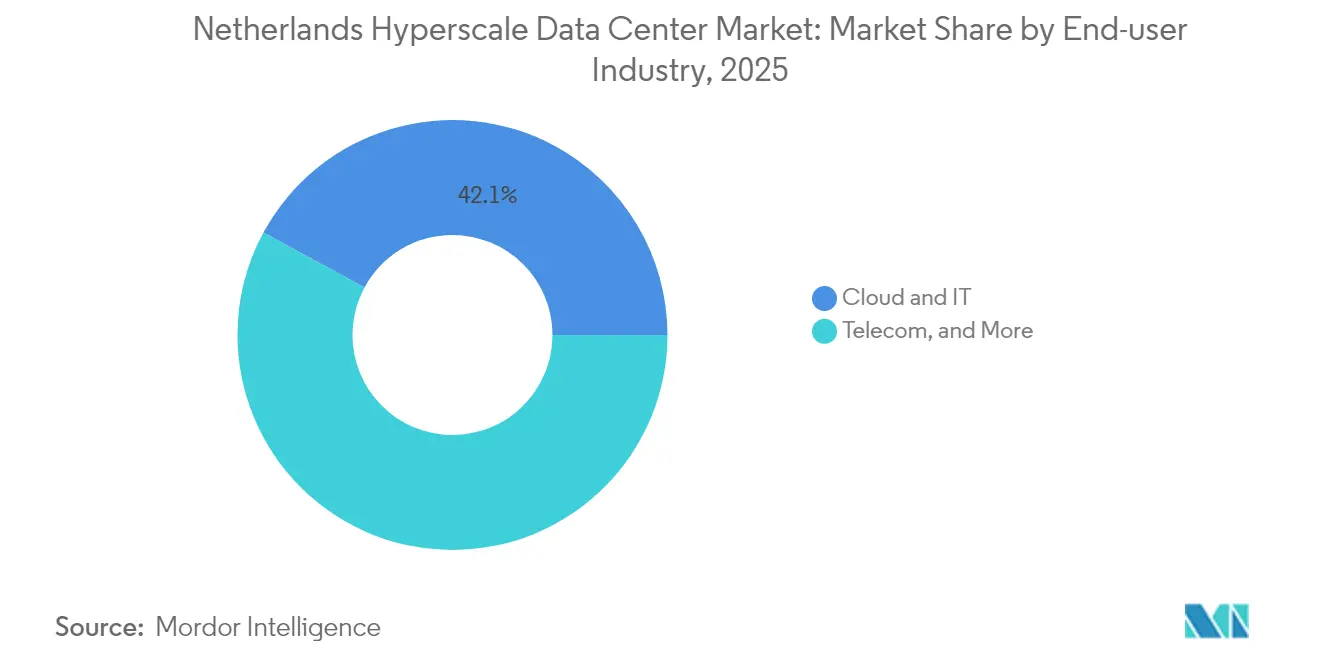
- By end-user industry, Cloud and IT represented 42.10% share in 2025, and is growing at 14.4% CAGR to 2032.
- By data center size, Massive (Greater than 25 MW and less than equal to 60 MW) facilities held 49.20% share in 2025; Mega (Greater than 60 MW) are expanding at a 15.45% CAGR.
Note: Market size and forecast figures in this report are generated using Mordor Intelligence’s proprietary estimation framework, updated with the latest available data and insights as of 2026.
Netherlands operates as part of an interconnected international environment rather than as a self-contained country level unit. The hyperscale data center market research by Mordor Intelligence places together all major developments across the globe within that wider frame.
Netherlands Hyperscale Data Center Market Trends and Insights
Drivers Impact Analysis*
| Driver | (~) % Impact on CAGR Forecast | Geographic Relevance | Impact Timeline |
|---|---|---|---|
| GPU-centric AI/ML demand for >50 kW racks | +8.50% | Amsterdam and Flevoland | Medium term (2-4 years) |
| Surging cloud-migration of Dutch enterprises | +6.20% | Nationwide (North and South Holland early gains) | Short term (≤ 2 years) |
| Amsterdam’s dense IX/peering ecosystem | +4.80% | Amsterdam metro, adjacent provinces | Long term (≥ 4 years) |
| EU-GDPR and digital-sovereignty compliance | +3.70% | EU-wide; NL as gateway hub | Medium term (2-4 years) |
| SMR-powered campus pilots in Eemshaven | +2.10% | Northern Netherlands | Long term (≥ 4 years) |
| District heat-reuse subsidies in North Holland | +1.90% | North Holland, expanding | Medium term (2-4 years) |
| Source: Mordor Intelligence | |||
GPU-centric AI/ML demand for greater than 50 kW racks
Rising machine-learning workloads are normalizing rack densities above 50 kW, prompting wholesale deployment of liquid cooling that cuts energy use by up to 40% compared with air systems [1].Liu, Coco, “Data Centers Cut Energy Use by Submerging Servers in Liquid,” Bloomberg, bloomberg.comOracle’s USD 1 billion expansion explicitly targets AI infrastructure, underscoring intensifying hyperscaler appetite for purpose-built capacity. Government-backed projects such as the EUR 200 million (USD 234.01 million) Groningen AI factory further validate sustained demand. The resulting premium pricing helps the Netherlands hyperscale data center market outpace capacity additions in value terms. Thermal-management vendors are accelerating R and D, while operators retrofit existing halls with rear-door heat exchangers to remain competitive. Power-delivery architectures are being overhauled for 2+N redundancy at 1.2 PUE targets, elevating capital intensity across new builds.
Surging cloud-migration of Dutch enterprises
Post-pandemic digitization has nudged Dutch corporates toward hybrid and multi-cloud footprints, leveraging AMS-IX’s 12.724 Tb/s peak to reduce latency across Europe [2].AMS-IX, “AMS-IX Amsterdam,” ams-ix.net Microsoft’s 2025 European digital commitments reassure enterprises on data sovereignty, stimulating demand for compliant colocation suites. Subsidized renewable-energy programs under the EUR 8 billion (USD 9.36 billion) SDE++ budget encourage firms to meet ESG goals while relocating workloads. In parallel, Digital Realty’s integration of Interxion augments the interconnection fabric, simplifying hybrid deployments. As cloud spend reallocates internal IT budgets, the Netherlands hyperscale data center market gains resilient enterprise demand in finance, manufacturing, and life sciences.
Amsterdam’s dense IX/peering ecosystem
AMS-IX and NL-IX create Europe’s most concentrated exchange environment, enabling operators to monetize cross-connect services and low-latency routes. Digital Realty operates 13 interconnected sites, anchoring hyperscaler and enterprise nodes. However, municipal grid restrictions cap new permits, shifting green-field projects toward proximate provinces that still tether back to Amsterdam’s fiber network. Operators are investing in diverse metro rings to mitigate single-point risk, and switch vendors are embedding automation to manage burgeoning port counts. Despite regulatory friction, network effects continue to attract foreign capital, reinforcing Amsterdam’s gateway status within the Netherlands hyperscale data center market.
EU-GDPR and digital-sovereignty compliance needs
Stringent data-residency mandates across the EU elevate demand for in-country hyperscale capacity that carries ISO 27001, PCI-DSS, and EN 50600 certifications. Dutch ministries earmark funds for AI, cloud, and 6G in the 2025 budget, positioning the nation as a sovereign-cloud hub. AWS’s EUR 7.8 billion (USD 9.13 billion) European Sovereign Cloud plan signals hyperscaler alignment with these requirements. Financial-services regulators impose strict localization for client data, prompting banks to pre-book compliant capacity through 2031. Operators that secure BREEAM Excellent ratings gain pricing power by bundling sustainability and compliance assurances, deepening stickiness among regulated tenants.
Restraints Impact Analysis*
| Restraints | (~) % Impact on CAGR Forecast | Geographic Relevance | Impact Timeline |
|---|---|---|---|
| Grid-capacity moratorium in Amsterdam metro | −4.3% | Amsterdam metropolitan area; secondary effects nationwide | Short term (≤ 2 years) |
| Rising heat-tax and carbon levies (national) | −2.8% | Nationwide; provincial variations in implementation | Medium term (2-4 years) |
| Public opposition to large-scale data-center projects | −2.0% | Flevoland and select municipalities in North and South Holland | Medium term (2-4 years) |
| Stringent energy-efficiency mandates and compliance reporting | −1.6% | Nationwide | Medium term (2-4 years) |
| Source: Mordor Intelligence | |||
Grid-capacity moratorium in Amsterdam metro
TenneT and Liander have frozen new large-consumer connections through at least 2034, placing over 12,000 applicants on hold and forcing operators to secure provisional land in adjacent provinces [3].Taylor Wessing, “Dutch Hydrogen Developments,” taylorwessing.comPermitting now requires demonstrable societal benefits and zero net load increase, adding planning risk. Developers absorb higher capex for redundant transmission routes, elongating ROI timelines. The moratorium also accelerates land-price inflation in North Holland, lifting entry barriers for emerging providers and heightening consolidation within the Netherlands hyperscale data center market.
Rising heat-tax and carbon levies (national)
Dutch policy mandates 27 °C supply-air set-points and periodic proof of 12 energy-efficiency measures, with non-compliance fines linked to facility GHG intensity. Carbon levies climbed to EUR 41/ton in January 2025 and escalate annually, pressuring operators running legacy mechanical chillers. Budgeting for carbon-capture retrofits or direct-air-cooling upgrades intensifies near-term cash burn. Yet, compliance also accelerates adoption of liquid cooling, fuel cells, and onsite solar, advancing long-term sustainability positioning.
*Our forecasts treat driver/restraint impacts as directional, not additive. The impact forecasts reflect baseline growth, mix effects, and variable interactions.
Geography Analysis
North Holland retained 38.10% share of the Netherlands hyperscale data center market in 2025, leveraging AMS-IX’s dense peering fabric and entrenched hyperscale campuses AMS-IX. TenneT’s decade-long grid freeze limits near-term expansion, inflating lease rates and prompting capacity rationing. Operators invest in micro-grid batteries, heat-reuse schemes, and rooftop PV arrays to unlock incremental power envelopes. Municipal scrutiny now mandates societal benefit statements, elongating planning cycles yet preserving the province’s premium positioning within the Netherlands hyperscale data center market.
Flevoland posts the fastest 11.25% CAGR, capitalizing on available land, lower property costs, and dark-fiber links to Amsterdam that keep latency below 2 ms. Meta’s canceled Zeewolde project reflects local activism; still, regional authorities signal openness to scaled-down campuses that align with energy-saving benchmarks. Provincial incentives on renewable integration and district-heat connections attract new entrants seeking grid headroom and pro-business permitting frameworks.
Groningen gains momentum via the government-supported AI factory slated for 2026, anchoring an emerging digital cluster in the north. The port of Eemshaven’s subsea-cable landings bolster trans-Atlantic redundancy and make the province a candidate for SMR pilots. North Brabant and South Holland see steady infill as edge computing and industrial IoT nodes proliferate. Collectively, these diversification trends de-risk capacity growth and elevate the Netherlands hyperscale data center market’s national resilience.
The hyperscale data center market is assessed by Mordor Intelligence through a multi-layered geographic lens, covering other regions such as Europe, Middle East, and Africa, along with detailed country-level analysis for Norway, Sweden, Israel, South Africa, Poland, and Australia.
Segment Analysis
By Data Center Type: Self-Build Acceleration Amid Sovereignty Demands
Hyperscale Colocation maintained 53.20% share of the Netherlands hyperscale data center market in 2025, benefiting from established campus ecosystems that ease enterprises’ transition to hybrid cloud. These multitenant facilities exploit shared cooling and ancillary services to deliver cost-efficient footprints. Despite that dominance, the Netherlands hyperscale data center market size allocated to Self-build projects is rising at a 12.05% CAGR as cloud majors chase bespoke security postures and sovereign-cloud certifications.
Oracle’s Westpoort campus exemplifies hyperscaler preference for direct control of power design, liquid-immersion suites, and AI inference clusters. Google’s fourth Dutch build follows suit, embedding renewable PPAs and proprietary airflow-containment. Colocation providers are countering with build-to-suit modules linked to meet-me rooms, pitching reduced time-to-market. Over 2026-2032, colocation is expected to retain scale advantages, yet self-build penetration will widen as regulatory complexity amplifies the strategic value of vertical integration within the Netherlands hyperscale data center market.


By Component: Liquid Cooling Revolution Drives Infrastructure Evolution
In 2025, IT Infrastructure servers, storage, and networking—captured 46.05% of spend, underlining compute-centric investment priorities. However, Liquid-cooling Systems are forecast to deliver an 17.35% CAGR, the highest across components, as AI GPUs exceed 700 W thermal-design power. Electrical Infrastructure grows steadily as operators transition to 2N UPS topologies and 48 VDC busways to support high-density racks.
Mechanical add-ons such as closed-loop dry coolers, composite piping, and leak-detection sensors are redesigned to integrate dielectric fluids. General construction budgets increase to accommodate taller halls and raised-floor zones purpose-built for liquid distribution manifolds. The component mix shift reinforces supplier opportunities in pumps, cold-plates, and facility management software that optimize temperature set-points, strengthening overall competitiveness in the Netherlands hyperscale data center market.
By Tier Standard: Tier IV Growth Reflects Mission-Critical AI Demands
Tier III sites led deployment with 66.40% share in 2025 thanks to balanced cost and 99.982% uptime sufficing for most SaaS and enterprise workloads. Operators favor modular Tier III builds for rapid scaling across provinces where municipal approvals prioritize energy-efficient designs. The Netherlands hyperscale data center market size attached to Tier IV, however, records a 9.35% CAGR through 2032 as AI developers and financial institutions demand 2N+1 redundancy.
Oracle integrates fault-tolerant power paths and trip-redundant cooling loops to secure contracts from banking clients bound by regulatory RTO thresholds. Premium pricing dynamics offset higher capex, sustaining ROI expectations. Colocation providers are selectively upgrading flagship halls to Tier IV, deploying twin-feed substations and predictive-maintenance analytics to justify higher leases within the Netherlands hyperscale data center market
By End-User Industry: AI/ML Cloud Emergence Reshapes Demand Patterns
Cloud and IT accounted for 42.10% of occupied MW in 2025, leveraging the country’s robust fiber spine and subsea-cable reach. Enterprises in banking, logistics, and life sciences consolidate workloads into regional availability zones to reduce latency to Frankfurt, Paris, and London. Parallelly, AI/ML Cloud workloads expand at 14.4% CAGR, driving fresh demand for on-package liquid cooling and HBM-equipped servers.
The Groningen AI factory, backed by EUR 200 million, epitomizes strategic public-private alignment toward sovereign AI capacity. Government agencies, telecom operators, and manufacturing verticals follow with proof-of-concept training clusters that piggyback on hyperscale back-bones. By 2031, AI/ML tenants are expected to narrow the share gap with traditional Cloud and IT, adding resiliency to revenue streams in the Netherlands hyperscale data center market.
By Data Center Size: Mega Facilities Drive Economies of Scale
Massive (Greater than 25 MW and less than equal to 60 MW) facilities owned 49.20% share in 2025, offering modular power blocks and phased capex deployment. These campuses balance construction risk with scalability. Conversely, Mega (greater than 60 MW) facilities capture a 15.45% CAGR as hyperscalers aggregate AI training clusters into single-tenant super-sites, chasing less than 1.2 PUE targets.
Meta’s canceled Zeewolde proposal illustrates public-acceptance hurdles. Yet, Vantage’s EUR 1.4 billion EMEA expansion underscores investor confidence in mega-campus economics. Large (Less than equal to 25 MW) facilities persist for edge and latency-sensitive use cases but remain a minority. The scaling dynamic widens cost differentials, compelling smaller players to specialize in compliance-led or edge-adjacent offerings within the Netherlands hyperscale data center market.
Competitive Landscape
The Netherlands hyperscale data center market hosts a moderately consolidated field led by Digital Realty, Equinix, NorthC, and global cloud providers executing self-build strategies. Digital Realty’s USD 8.4 billion Interxion takeover elevated its EMEA share to 17%, strengthening subsea cable access and cementing flagship status in Amsterdam Science Park. Equinix leverages xScale to target GPU-dense deployments, reporting 7% YoY revenue growth in 2024 despite grid bottlenecks.
Oracle’s USD 1 billion bet signifies a pivot from pure software toward infrastructure ownership, adding competitive pressure on colocation incumbents. AWS and Google deepen local footprints to uphold EU data residency, while NorthC absorbs Colt’s assets to rise as a regional champion. Sustainability emerges as a battleground: Vantage commits EUR 1.4 billion to low-carbon builds, and Data4 partners with Westinghouse on SMRs.
Netherlands Hyperscale Data Center Industry Leaders
Google LLC
Amazon Web Services, Inc.
Meta Platforms, Inc.
Oracle Corporation
Digital Realty Trust, Inc. (Interxion)
- *Disclaimer: Major Players sorted in no particular order

Recent Industry Developments
- July 2025: Oracle announced a USD 1 billion investment to expand cloud and AI infrastructure in the Netherlands, part of a USD 3 billion regional plan.
- June 2025: Groningen AI factory secured EUR 200 million (USD 234.01 million) government and regional funding for a 2026 supercomputer launch.
- April 2025: Colt completed the sale of European data centers to NorthC, consolidating Dutch presence.
- April 2025: Colt completed the sale of European data centers to NorthC, consolidating Dutch presence.
- April 2024: Google broke ground on a USD 640 million fourth Dutch data center in Westpoort, featuring advanced cooling.


Research Methodology Framework and Report Scope
Market Definitions and Key Coverage
Our study views the Netherlands hyperscale data center market as the total yearly revenue earned by facilities that deliver at least 4 MW of contiguous IT load per building and can expand to tens of thousands of racks, whether self-built by cloud giants or leased as hyperscale colocation. We count recurring service charges, on-site support, and value-added infrastructure upgrades, all expressed in USD.
Scope Exclusion: Enterprise, edge, and colocation halls below the 4 MW threshold are left out.
Segmentation Overview
- By Data Center Type
- Hyperscale Self-build
- Hyperscale Colocation
- By Component
- IT Infrastructure
- Server Infrastructure
- Storage Infrastructure
- Network Infrastructure
- Electrical Infrastructure
- Power Distribution Unit
- Transfer Switches and Switchgears
- UPS Systems
- Generators
- Other Electrical Infrastructure
- Mechanical Infrastructure
- Cooling Systems
- Racks
- Other Mechanical Infrastructure
- General Construction
- Core and Shell Development
- Installation and Commisioning Services
- Design Engineering
- Fire Detection, Suppression and Physical Security
- DCIM/BMS Solutions
- IT Infrastructure
- By Tier Standard
- Tier III
- Tier IV
- By End-User Industry
- Cloud and IT
- Telecom
- Media and Entertainment
- Government
- BFSI
- Manufacturing
- E-Commerce
- Other End Users
- By Data Center Size
- Large (Less than equal to 25 MW)
- Massive (Greater than 25 MW and less than equal to 60 MW)
- Mega (Greater than 60 MW)
Detailed Research Methodology and Data Validation
Primary Research
Mordor analysts interviewed grid planners, facility engineers, and procurement leads across Amsterdam, Flevoland, and Groningen. Their insights refined ramp-up timelines, weighted average price per kilowatt, and realistic rack-density road maps that desk research could not fully capture.
Desk Research
We began with government disclosures from the Netherlands Enterprise Agency and Central Bureau of Statistics, which anchor installed megawatts and energy tariffs. Trade bodies such as the Dutch Data Center Association and Eurostat supply vacancy rates, campus counts, and utilization ratios. Patent trends accessed through Questel show immersion-cooling uptake, while OFV freight statistics hint at delivery lead times for prefabricated modules. Company filings, investor decks, and reputable press complete the price benchmarks and expansion pipelines. We also drew on D&B Hoovers for uniform operator financials, Dow Jones Factiva for deal tracking, and Volza shipment logs to validate incoming server volumes. The sources named are illustrative; many additional datasets were consulted for collection, validation, and clarification.
Market-Sizing & Forecasting
The baseline value is first calculated top-down by reconciling operator-reported white space, average lease rates, and self-build capital-expense amortization. We then corroborate the total with sampled bottom-up checks on server shipments and GPU-dense rack counts. Key variables, grid-connection lead times, liquid-cooling penetration, AI workload share, renewable-power premiums, and land-use caps drive historical splits and future trajectories.
Forecasts use a blend of multivariate regression and scenario analysis, with growth elasticities tied to GDP digital-sector spend and power-availability trends. Where bottom-up gaps emerge, averages from peer campuses are statistically imputed before final reconciliation.
Data Validation & Update Cycle
Outputs pass a three-layer review that includes automated variance scans, peer analyst audits, and final sign-off meetings. Models refresh annually, and any major policy shift or hyperscale investment triggers an interim update so clients receive the latest view.
Why Our Netherlands Hyperscale Data Center Baseline Commands Reliability
Published estimates often diverge because firms pick different facility cut-offs, revenue components, and refresh cadences, widening totals by billions. Mordor's disciplined filter of >=4 MW halls, annualized service revenue, and mixed-method modeling yields a figure stakeholders can trace and replicate.
Benchmark comparison
| Market Size | Anonymized source | Primary gap driver |
|---|---|---|
| USD 0.8 bn (2025) | Mordor Intelligence | |
| USD 1.2 bn (2023) | Regional Consultancy A | Older baseline year and counts construction capex as revenue |
| USD 1.23 bn (2024) | Trade Journal B | Measures the entire data-center market, not hyperscale alone |
| USD 10.25 bn (2024) | Global Consultancy C | Includes hardware resale and lacks a 4 MW threshold filter |
Overall, the modest gap with Regional Consultancy A reflects calendar alignment, while wider spreads stem from broader scopes. By rooting every assumption in verifiable capacity data and live tariff inputs, Mordor delivers the balanced, transparent baseline decision-makers trust.


Key Questions Answered in the Report
What is the current size of the Netherlands hyperscale data center market?
The Netherlands hyperscale data center market size stands at USD 1.01 billion in 2026 and is forecast to reach USD 4.12 billion by 2032.
How fast is the market growing?
The market is expanding at a 26.41% CAGR in value terms, considerably faster than the 4.47% CAGR projected for installed capacity.
Which province is growing the quickest?
Flevoland records the fastest 11.25% CAGR due to land availability, favorable regulation, and proximity to Amsterdam’s fiber routes.
Why are hyperscalers adopting liquid cooling in the Netherlands?
AI and machine-learning workloads drive rack power densities above 50 kW, and liquid cooling can lower energy use by up to 40% compared with air cooling.
What impact do grid constraints in Amsterdam have on new data centers?
A decade-long moratorium on new large-consumer connections forces operators to pre-book alternative sites in Flevoland and Groningen, raising development costs.
Page last updated on:


