Poland Data Center Market Size and Share
Market Overview
| Study Period | 2020 - 2031 |
|---|---|
| Forecast Data Period | 2026 - 2031 |
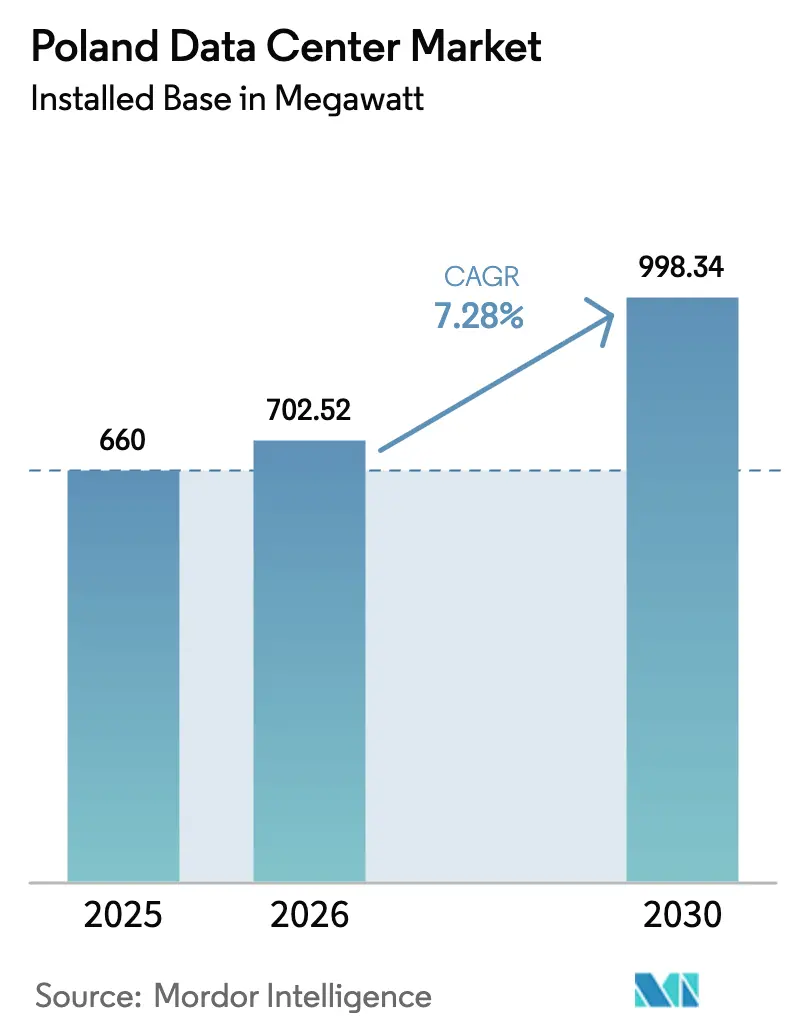
| Base Year Market Size (2025) | 660 megawatt |
| Market Volume (2026) | 702.52 megawatt |
| Market Volume (2030) | 998.34 megawatt |
| Growth Rate (2026 - 2031) | 7.28% CAGR |
| Market Concentration | Medium |
Major Players *Disclaimer: Major Players sorted in no particular order Image © Mordor Intelligence. Reuse requires attribution under CC BY 4.0. | |
Poland Data Center Market Analysis by Mordor Intelligence
The Poland data center market size in terms of installed base is expected to increase from 660 megawatt in 2025 to 702.52 megawatt in 2026 and reach 998.34 megawatt by 2030, growing at a CAGR of 7.28% over 2026-2030. Poland’s position as Central Europe’s fastest-growing colocation hub is anchored by hyperscale commitments from Microsoft and Google, steady fiber investments along pan-European routes, and a 5G rollout that is widening the addressable edge-computing base. Yet the growth trajectory is constrained by Warsaw’s power grid deficit, a tight labor pool, and volatile electricity prices, which are forcing operators to sign long-term renewable power deals. Competitive strategies are diverging, wholesale campuses pursue volume contracts with cloud providers, while medium-sized facilities in regional cities focus on hybrid-cloud workloads from banks, e-commerce, and manufacturing customers. Government incentives under the Polish Investment Zone program, together with the European Union’s energy-efficiency rulebook, are tilting new builds toward locations that combine tax holidays with abundant wind or solar capacity, reshaping the geographic spread of the Poland data center market.
Key Report Takeaways
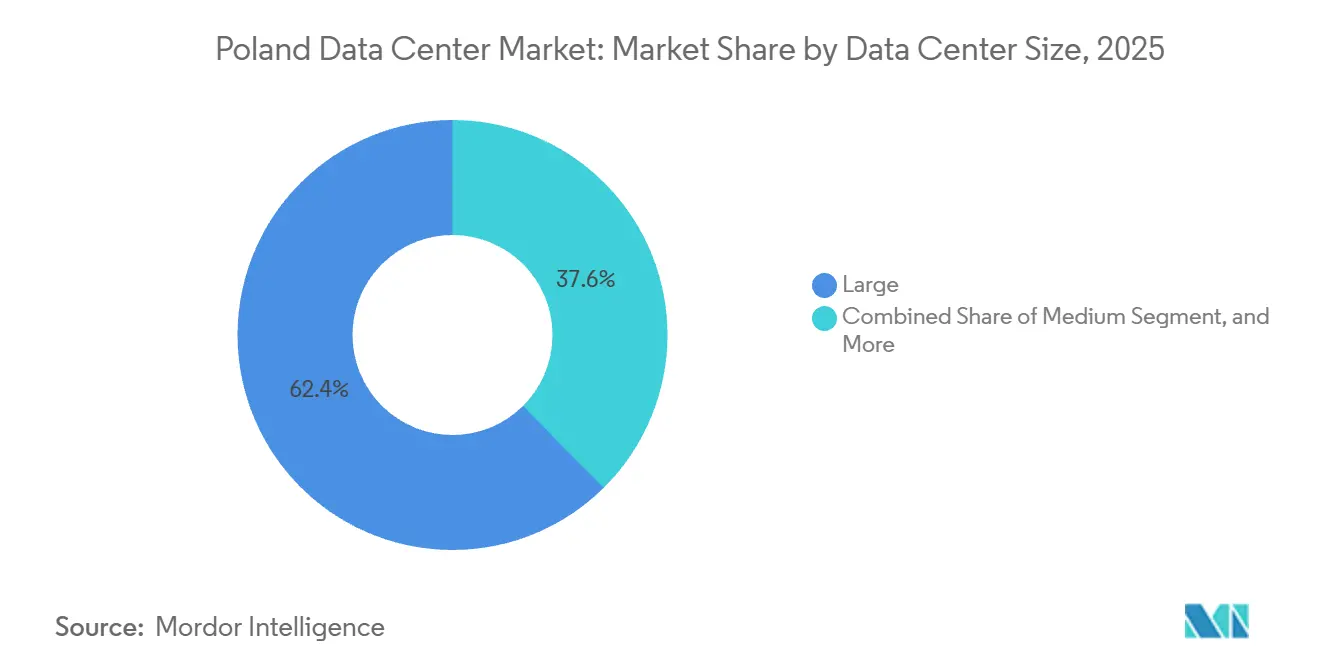
- By data center size, large facilities led with 62.42% share in 2025, while medium facilities are forecast to advance at an 8.17% CAGR to 2031.
- By tier type, tier 4 infrastructure commanded 78.52% of the Poland data center market share in 2025 and is projected to grow at an 8.36% CAGR through 2031.
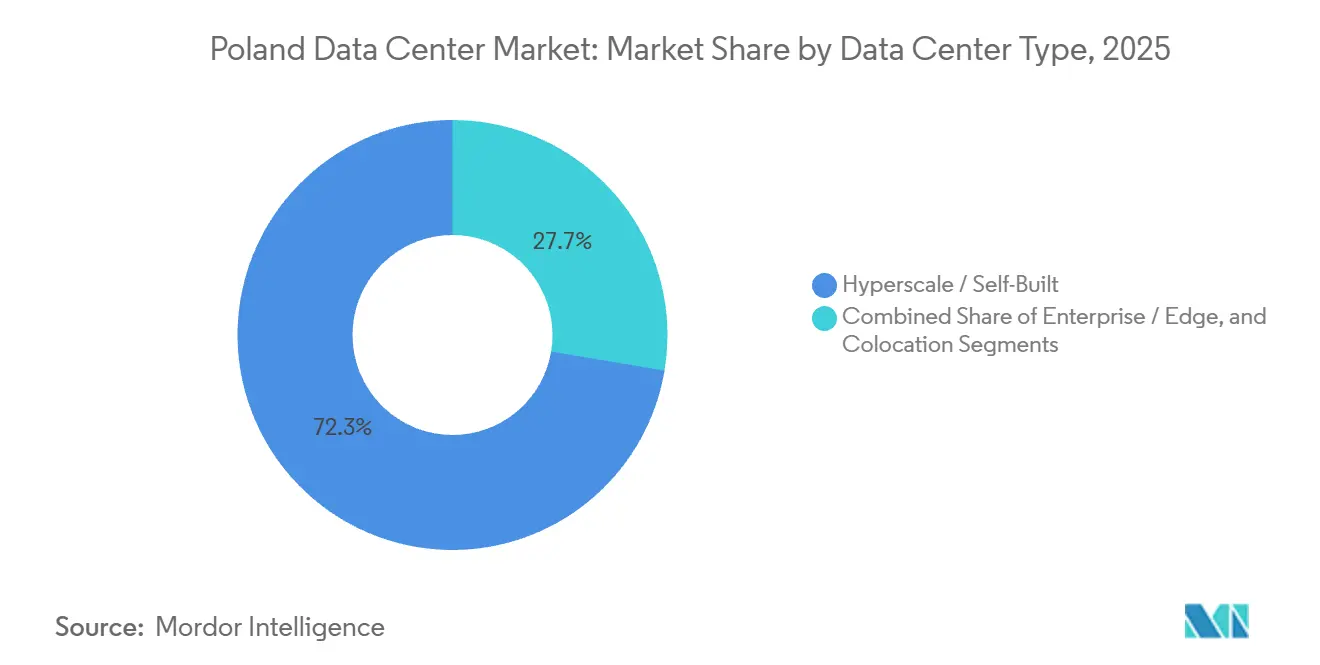
- By data center type, hyperscale and self-build campuses accounted for 72.35% of capacity in 2025, whereas enterprise and edge deployments are poised to grow at an 8.67% CAGR through 2031.
- By end user, the IT and ITES segment contributed 45.61% of demand in 2025, and the BFSI vertical is set to expand at a 9.65% CAGR through 2031.
- By hotspot, Warsaw accounted for 69.39% of installed capacity in 2025; the Rest of Poland cluster is expected to grow at an 8.48% CAGR through 2031.
Note: Market size and forecast figures in this report are generated using Mordor Intelligence’s proprietary estimation framework, updated with the latest available data and insights as of 2026.
Poland Data Center Market Trends and Insights
Drivers Impact Analysis*
| Driver | (~) % Impact on CAGR Forecast | Geographic Relevance | Impact Timeline |
|---|---|---|---|
| Surge in Hyperscale and Self-Build Investments by Global Cloud Providers | +2.1% | National, concentrated in Warsaw with spillover to Krakow, Wroclaw | Medium term (2-4 years) |
| Poland's Rapidly Growing Renewable-Energy Pipeline Enabling Green Operations | +1.4% | National, with early gains in coastal regions (Gdansk, Szczecin) and southern wind corridors | Long term (≥ 4 years) |
| Implementation of 5G And Edge-Computing Use Cases by Telecom Operators | +1.6% | National, urban centers (Warsaw, Krakow, Wroclaw, Poznan, Gdansk) | Short term (≤ 2 years) |
| Government Cash-Grant Incentives Under the Polish Investment Zone Scheme | +0.9% | National, prioritizing under-developed voivodeships (Lubelskie, Podkarpackie, Warminsko-Mazurskie) | Medium term (2-4 years) |
| EU-Funded Cross-Border Fiber Projects Boosting International Connectivity | +0.7% | National, border regions (Terespol-Belarus, Medyka-Ukraine, Szczecin-Germany) | Long term (≥ 4 years) |
| Under-Penetrated Regional Hubs Unlocking Secondary-City Demand | +1.2% | Regional, Krakow, Wroclaw, Gdansk, Poznan, Lodz | Medium term (2-4 years) |
| Source: Mordor Intelligence | |||


Surge in Hyperscale and Self-Build Investments by Global Cloud Providers
Microsoft’s PLN 2.8 billion expansion, due for completion in June 2026, signals that hyperscalers regard the Poland data center market as a sovereign-cloud bridgehead serving Ukraine, the Baltics, and the Nordics. Google Cloud’s 2024 Warsaw region reinforced this narrative, allowing enterprises to meet GDPR data-residency mandates without routing traffic to Frankfurt or Amsterdam. The influx is compressing wholesale colocation pricing by 10-15% but thickening the interconnection ecosystem as content delivery networks, internet exchanges, and managed-service partners follow anchor tenants. Equinix’s xScale 4x-3, opened in July 2025, illustrates the shift toward pre-certified 10 MW blocks that can be rapidly leased to single tenants. Operators therefore face a strategic fork; pursue low-margin volume deals with cloud giants, or defend a higher-margin retail business aimed at mid-market enterprises.
Implementation of 5G And Edge-Computing Use Cases by Telecom Operators
Orange Polska’s September 2025 standalone 5G trial showed sub-5 ms latency, validating metro-edge requirements for immersive reality and industrial IoT.[1]Orange Polska, “5G Standalone Architecture Trial Results,” orange.plPoland’s 15,987 5G base stations already cover 71.9% of households, and telecoms have invested over PLN 5 billion to densify networks. T-Mobile Polska’s collaboration with Beyond.pl is rolling out edge nodes in 12 cities, cutting deployment lead times from six months to six weeks. Enterprises thus gain local compute within 20 km of radio towers, lowering backhaul costs while meeting data-sovereignty rules. As a result, the enterprise and edge slice of the Poland data center market is on track to grow at the fastest pace through 2031.
Poland’s Rapidly Growing Renewable-Energy Pipeline Enabling Green Operations
The National Energy and Climate Plan targets 32% renewable electricity by 2030, adding 10 GW of onshore and offshore wind.[2]Ministry of Climate and Environment, “National Energy and Climate Plan 2021-2030,” gov.plData-center operators are locking in 15-year power-purchase agreements to hedge EU-ETS volatility that pushed carbon adders to EUR 80-90 per MWh in 2025. Atman’s WAW-3 campus secured a 50 MW wind PPA, guaranteeing 100% renewable supply from day one. Compliance pressure is increasing; the European Energy Efficiency Directive requires PUE below 1.5 and a 100% renewable energy factor by 2030, so facilities that can prove green credentials win procurement contests from hyperscalers and banks alike. Coastal locations near Gdansk, with easier access to offshore wind, therefore enjoy a structural cost edge.
Under-Penetrated Regional Hubs Unlocking Secondary-City Demand
Krakow and Wroclaw combine surplus transmission headroom with double-digit unemployment rebates under the Polish Investment Zone, trimming effective tax rates from 19% to as low as 6%.[3]Polish Investment and Trade Agency, “Polish Investment Zone Incentive Guidelines,” paih.gov.pl PSE’s 2025 transmission plan shows these cities can grant grid connections within six months versus up to 18 months in Warsaw. Operators thus sidestep the capital’s bottleneck, while enterprises gain low-latency access to Austrian and German corridors via Vienna-Katowice and Wroclaw-Dresden fiber routes. Early movers are capturing land parcels at sub-EUR 70 per square meter, one-third of Warsaw’s pricing, locking in capex advantages that improve project IRRs by 300-400 bps. The trend is expected to lift the Rest of Poland slice of the Poland data center market to 35-40% of national capacity by 2031.
Restraints Impact Analysis*
| Restraint | (~) % Impact on CAGR Forecast | Geographic Relevance | Impact Timeline |
|---|---|---|---|
| Scarcity of Power-Grid Capacity in the Warsaw Metropolitan Area | -1.3% | Warsaw metropolitan area, Mazowieckie voivodeship | Short term (≤ 2 years) |
| Lengthy Environmental Permitting for Large-Scale Facilities | -0.8% | National, acute in urban areas (Warsaw, Krakow, Wroclaw) | Medium term (2-4 years) |
| Fluctuating Electricity Prices Tied to EU-ETS Carbon Costs | -0.6% | National, higher impact in coal-dependent regions (Silesia) | Medium term (2-4 years) |
| Limited Availability of Highly Skilled Data-Center Workforce | -1.0% | National, concentrated in Warsaw, Krakow, Wroclaw, Gdansk | Long term (≥ 4 years) |
| Source: Mordor Intelligence | |||
Scarcity of Power-Grid Capacity in the Warsaw Metropolitan Area
Polskie Sieci Elektroenergetyczne flagged a 150-200 MW shortfall through 2028, obliging developers to co-finance substation upgrades that add EUR 15 million per site and delay commissioning by up to 18 months. Vantage Data Centers’ 48 MW WAW1 campus reached the grid only after committing to a joint investment in 400 kV infrastructure, a pattern now customary for allocations above 30 MW. The scarcity inflates wholesale pricing by 10-15% and is steering new builds toward Krakow, Gdansk, and Wroclaw despite those cities’ thinner fiber ecosystems. PSE’s EUR 2 billion modernization roadmap, due in 2029, should ease constraints, but until then, operators will ration Warsaw capacity toward the highest-margin tenants.
Limited Availability of Highly Skilled Data-Center Workforce
Statistics Poland reports an annual shortfall of 50,000 ICT specialists, equal to a 15% vacancy rate in roles such as facility engineers, network architects, and cybersecurity analysts. Wage inflation ran at 8-12% in 2025, eroding colocation margins and forcing operators to source talent from Czechia and Romania. The gap slows fit-out schedules, lengthens maintenance windows, and raises the hurdle rate for hyperscale self-builds that depend on on-site mechanical and electrical expertise. Universities in Krakow and Wroclaw are expanding energy-engineering programs, yet those cohorts will not reach the labor pool before 2028, making staffing a structural brake on the Poland data center market over the forecast horizon.
*Our forecasts treat driver/restraint impacts as directional, not additive. The impact forecasts reflect baseline growth, mix effects, and variable interactions.
Segment Analysis
By Data Center Size: Medium Facilities Gain Share In Regional Markets
Medium facilities are attracting increasing interest as enterprises outside Warsaw seek 2-5 MW leases that balance flexibility with cost efficiency. Large campuses retained 62.42% of deployed load in 2025, owing to wholesale contracts with single-tenant customers who demanded private halls. However, Warsaw’s grid deficit weighs on new 20-50 MW projects, nudging capital toward secondary cities where land and permitting expenses are lower. Medium sites, which normally bypass the 10 MW threshold that triggers a full environmental impact study, can break ground within a fiscal year and generate revenue sooner, attracting domestic operators that prefer incremental phasing.
Operators pursuing the medium slice often co-locate cloud on-ramps and carrier-neutral meet-me rooms, letting tenants interconnect without backhauling to the capital. This model anchors the hybrid-cloud strategies of regional banks and e-commerce firms. The segment, therefore, shows the highest elasticity to 5G edge demand, particularly for caching, fraud detection, and real-time analytics. Given these dynamics, medium facilities are forecast to outpace the Poland data center market average at an 8.17% CAGR, steadily eroding the large-campus dominance even as hyperscale self-builds continue in parallel.


By Tier Type: Tier 4 Dominance Reflects Financial-Services Mandates
Poland’s banking and capital-markets backbone drives a clear preference for concurrent-maintainable architectures. Tier 4 sites held 78.52% of installed IT load in 2025 and are expanding at an 8.36% CAGR, buoyed by KNF guidance that core transactions remain onshore in ISO 22301-certified environments. Price gaps versus Tier 3 narrowed to roughly 10%, removing cost objections for mission-critical workloads.
Uptime Institute-certified Tier 4 campuses advertise 2N electrical paths and 96 hours of diesel autonomy, a design standard now common in wholesale contracts for cloud infrastructure nodes. As the European Central Bank rolls out the TARGET Instant Payment Settlement system across the euro area, cross-border banks in Warsaw will need persistent sub-5 ms links into clearing hubs, reinforcing the Tier 4 premium. With few greenfield plots left inside the M25 ring road, operators upgrading Tier 3 shells to Tier 4 find capex justified by banking take-up rates.
By Data Center Type: Enterprise Edge Deployments Accelerate Amid 5G Rollout
Hyperscale and self-built estates still dominate with 72.35% of capacity, yet the enterprise and edge cohort leads growth with an 8.67% CAGR. Telcos knitting standalone 5G cores into metro rings require micro-data centers within 10-20 km of antennas, a spatial layout that classic wholesale campuses cannot serve economically. Beyond.pl and T-Mobile Polska are therefore seeding 50-500 kW nodes across industrial corridors where latency budgets sit below 10 ms.
This architecture dovetails with manufacturing users who run digital twins, computer vision, and autonomous robots on plant floors. Moving sensor analytics from the public cloud into metro-edge boxes slashes bandwidth bills and protects intellectual property. Over time, high-density AI training clusters are likely to straddle both segments; small inference pods at edge sites and large GPU farms inside hyperscale halls, each optimized for workload type, cementing a balanced mix within the Poland data center market.
By End User: BFSI Sector Leads Growth Amid Digital-Banking Transition
The Polish financial sector, already modern and mostly paperless, is adopting real-time clearing under the European Central Bank framework. Banks, insurers, and payment firms need deterministic latency below 5 ms to trading venues and card schemes, pushing them toward Tier 4 footprints in Warsaw. Although IT and ITES still represent the largest slice at 45.61%, BFSI workloads are projected to grow at a 9.65% CAGR, the quickest of any vertical.
Concurrently, e-commerce and media customers are spreading edge caches across the country to improve user experience, and government digital-identity programs are entering sovereign clouds to comply with GDPR. Manufacturing plants in Katowice and Lodz, integrating predictive maintenance and machine vision, are another rising cohort. Collectively, non-IT verticals will dilute the historic concentration of demand among software outsourcers, diversifying revenue streams for operators nationwide.
Geography Analysis
In 2025, Warsaw boasted a commanding 69.39% share of the installed capacity. Meanwhile, the Rest of Poland cluster is projected to expand at a robust 8.48% CAGR through 2031. As the heart of Poland's interconnection landscape, Warsaw is home to 60% of the nation's fiber routes and nearly all cloud on-ramps. This centrality is bolstered by its proximity to key financial institutions, such as the Warsaw Stock Exchange and the National Bank of Poland. However, an energy shortfall in the metro from 2025 to 2028 has stifled speculative development, driving up wholesale rates. This scenario has led hyperscalers to pivot, opting for mixed-campus deployments that balance capital with their regional counterparts.
Krakow, with direct fiber to Vienna and Budapest, now attracts fintech disaster recovery nodes and software development back ends. Wroclaw leverages its automotive supply-chain ties to Germany and Czechia, creating edge demand for just-in-time logistics analytics. Gdansk capitalizes on Baltic cable landings and offshore wind PPAs, offering renewable power baseloads and sub-30 ms hops into Nordic grids, a differentiator for sustainability-minded tenants.
Poznan, positioned along the Berlin-Warsaw corridor, is drawing manufacturers experimenting with 5G factory cells that need on-premises compute for machine-vision inference. Together, these locations form an emerging ring of metro-edge sites that balance latency, cost, and energy security. The national grid operator’s modernization schemes, alongside EU Recovery and Resilience funds earmarked for backbone fiber, are set to narrow latency gaps, anchoring a multi-node network that underpins future growth of the Polish data center market.
Competitive Landscape
The market has moderate concentration. Atman completed the first 15 MW phase of its 43 MW WAW-3 campus in October 2024 after securing PLN 1.35 billion in project finance, giving it a 15% nationwide footprint. Equinix operates four IBX sites in Warsaw, filling 78% of EMEA capacity as of late 2025 and extending its xScale venture into the hyperscale lane. Vantage raised EUR 750 million via senior notes in May 2024 to expand its 48 MW WAW1 campus and eye distressed assets in secondary cities.
Domestic challengers such as Polcom and 3S (Play) compete on bundled connectivity and price, leveraging dense metro fiber to offer sub-10 ms SLAs at tariffs 10-20% below multinationals. Telecom carriers, meanwhile, are building micro-edge footprints tied to mobile towers, a model that traditional colocation specialists struggle to imitate. Sustainability credentials are also becoming table stakes; facilities powered 100% by wind or solar now command premium occupancy ratios. Operators adopting liquid cooling and free-air economizers are better placed to meet EU efficiency rules and win hyperscale RFPs.
Overall, strategy divides into volume-driven hyperscale campuses, margin-focused retail colocation for mid-market customers, and rapidly growing edge nodes. Players able to straddle at least two of these lanes, while securing renewable power and specialized talent, will consolidate share as market expansion persists.
Poland Data Center Industry Leaders
Vantage Data Centers Management Company LLC
Atman sp. z o.o.
Beyond.pl sp. z o.o.
Equinix Inc.
DATA4 Group
- *Disclaimer: Major Players sorted in no particular order

Recent Industry Developments
- September 2025: Orange Polska completed standalone 5G trials in Warsaw that achieved sub-5 ms latency, green-lighting commercial edge-computing services.
- July 2025: Equinix launched its xScale 4x-3 10 MW facility, backed by a 15-year wind PPA guaranteeing carbon-neutral energy from day one.
- February 2025: Microsoft confirmed a PLN 2.8 billion expansion of its Polish Azure region, adding 50 MW across three availability zones and targeting sovereign-cloud demand from banks and public agencies.
- October 2024: Atman delivered the first phase of its 43 MW WAW-3 campus in Piaseczno, leveraging Polish Investment Zone tax breaks that slash its effective corporate rate to 6%.


Poland Data Center Market Report Scope
The data center market encompasses the infrastructure, services, and technologies that support the storage, management, and processing of data. This market includes various data center sizes, tier classifications, types, end-user industries, and hotspots, reflecting the diverse needs of businesses and organizations operating in the country.
The Poland Data Center Market Report is Segmented by Data Center Size (Small, Medium, Large, and Hyperscale), Tier Type (Tier 1 and 2, Tier 3, and Tier 4), Data Center Type (Hyperscale/Self-Built, Enterprise/Edge, and Colocation), End User (BFSI, IT and ITES, E-Commerce, Government, Manufacturing, Media and Entertainment, Telecom, and Other End Users), and Hotspot (Warsaw, and Rest of Poland). The Market Forecasts are Provided in Terms of IT Load Capacity (Megawatt).
| Small |
| Medium |
| Large |
| Hyperscale |
| Tier 1 and 2 |
| Tier 3 |
| Tier 4 |
| Hyperscale / Self-Built | ||
| Enterprise / Edge | ||
| Colocation | Non-Utilized | |
| Utilized | Retail Colocation | |
| Wholesale Colocation | ||
| BFSI |
| IT and ITES |
| E-Commerce |
| Government |
| Manufacturing |
| Media and Entertainment |
| Telecom |
| Other End Users |
| Warsaw |
| Rest of Poland |
| By Data Center Size | Small | ||
| Medium | |||
| Large | |||
| Hyperscale | |||
| By Tier Type | Tier 1 and 2 | ||
| Tier 3 | |||
| Tier 4 | |||
| By Data Center Type | Hyperscale / Self-Built | ||
| Enterprise / Edge | |||
| Colocation | Non-Utilized | ||
| Utilized | Retail Colocation | ||
| Wholesale Colocation | |||
| By End User | BFSI | ||
| IT and ITES | |||
| E-Commerce | |||
| Government | |||
| Manufacturing | |||
| Media and Entertainment | |||
| Telecom | |||
| Other End Users | |||
| By Hotspot | Warsaw | ||
| Rest of Poland | |||


Market Definition
- IT LOAD CAPACITY - The IT load capacity or installed capacity, refers to the amount of energy consumed by servers and network equipments placed in a rack installed. It is measured in megawatt (MW).
- ABSORPTION RATE - It denotes the extend to which the data center capacity has been leased out. For instance, a 100 MW DC has leased out 75 MW, then absorption rate would be 75%. It is also referred as utilization rate and leased-out capacity.
- RAISED FLOOR SPACE - It is an elevated space build over the floor. This gap between the original floor and the elevated floor is used to accommodate wiring, cooling, and other data center equipment. This arrangement assist in having proper wiring and cooling infrastructure. It is measured in square feet (ft^2).
- DATA CENTER SIZE - Data Center Size is segmented based on the raised floor space allocated to the data center facilities. Mega DC - # of Racks must be more than 9000 or RFS (raised floor space) must be more than 225001 Sq. ft; Massive DC - # of Racks must be in between 9000 and 3001 or RFS must be in between 225000 Sq. ft and 75001 Sq. ft; Large DC - # of Racks must be in between 3000 and 801 or RFS must be in between 75000 Sq. ft and 20001 Sq. ft; Medium DC # of Racks must be in between 800 and 201 or RFS must be in between 20000 Sq. ft and 5001 Sq. ft; Small DC - # of Racks must be less than 200 or RFS must be less than 5000 Sq. ft.
- TIER TYPE - According to Uptime Institute the data centers are classified into four tiers based on the proficiencies of redundant equipment of the data center infrastructure. In this segment the data center are segmented as Tier 1,Tier 2, Tier 3 and Tier 4.
- COLOCATION TYPE - The segment is segregated into 3 categories namely Retail, Wholesale and Hyperscale Colocation service. The categorization is done based on the amount of IT load leased out to potential customers. Retail colocation service has leased capacity less than 250 kW; Wholesale colocation services has leased capacity between 251 kW and 4 MW and Hyperscale colocation services has leased capacity more than 4 MW.
- END CONSUMERS - The Data Center Market operates on a B2B basis. BFSI, Government, Cloud Operators, Media and Entertainment, E-Commerce, Telecom and Manufacturing are the major end-consumers in the market studied. The scope only includes colocation service operators catering to the increasing digitalization of the end-user industries.
| Keyword | Definition |
|---|---|
| Rack Unit | Generally referred as U or RU, it is the unit of measurement for the server unit housed in the racks in the data center. 1U is equal to 1.75 inches. |
| Rack Density | It defines the amount of power consumed by the equipment and server housed in a rack. It is measured in kilowatt (kW). This factor plays a critical role in data center design and, cooling and power planning. |
| IT Load Capacity | The IT load capacity or installed capacity, refers to the amount of energy consumed by servers and network equipment placed in a rack installed. It is measured in megawatt (MW). |
| Absorption Rate | It denotes how much of the data center capacity has been leased out. For instance, if a 100 MW DC has leased out 75 MW, then the absorption rate would be 75%. It is also referred to as utilization rate and leased-out capacity. |
| Raised Floor Space | It is an elevated space built over the floor. This gap between the original floor and the elevated floor is used to accommodate wiring, cooling, and other data center equipment. This arrangement assists in having proper wiring and cooling infrastructure. It is measured in square feet/meter. |
| Computer Room Air Conditioner (CRAC) | It is a device used to monitor and maintain the temperature, air circulation, and humidity inside the server room in the data center. |
| Aisle | It is the open space between the rows of racks. This open space is critical for maintaining the optimal temperature (20-25 °C) in the server room. There are primarily two aisles inside the server room, a hot aisle and a cold aisle. |
| Cold Aisle | It is the aisle wherein the front of the rack faces the aisle. Here, chilled air is directed into the aisle so that it can enter the front of the racks and maintain the temperature. |
| Hot Aisle | It is the aisle where the back of the racks faces the aisle. Here, the heat dissipated from the equipment’s in the rack is directed to the outlet vent of the CRAC. |
| Critical Load | It includes the servers and other computer equipment whose uptime is critical for data center operation. |
| Power Usage Effectiveness (PUE) | It is a metric which defines the efficiency of a data center. It is calculated by: (𝑇𝑜𝑡𝑎𝑙 𝐷𝑎𝑡𝑎 𝐶𝑒𝑛𝑡𝑒𝑟 𝐸𝑛𝑒𝑟𝑔𝑦 𝐶𝑜𝑛𝑠𝑢𝑚𝑝𝑡𝑖𝑜𝑛)/(𝑇𝑜𝑡𝑎𝑙 𝐼𝑇 𝐸𝑞𝑢𝑖𝑝𝑚𝑒𝑛𝑡 𝐸𝑛𝑒𝑟𝑔𝑦 𝐶𝑜𝑛𝑠𝑢𝑚𝑝𝑡𝑖𝑜𝑛). Further, a data center with a PUE of 1.2-1.5 is considered highly efficient, whereas, a data center with a PUE >2 is considered highly inefficient. |
| Redundancy | It is defined as a system design wherein additional component (UPS, generators, CRAC) is added so that in case of power outage, equipment failure, the IT equipment should not be affected. |
| Uninterruptible Power Supply (UPS) | It is a device that is connected in series with the utility power supply, storing energy in batteries such that the supply from UPS is continuous to IT equipment even during utility power is snapped. The UPS primarily supports the IT equipment only. |
| Generators | Just like UPS, generators are placed in the data center to ensure an uninterrupted power supply, avoiding downtime. Data center facilities have diesel generators and commonly, 48-hour diesel is stored in the facility to prevent disruption. |
| N | It denotes the tools and equipment required for a data center to function at full load. Only "N" indicates that there is no backup to the equipment in the event of any failure. |
| N+1 | Referred to as 'Need plus one', it denotes the additional equipment setup available to avoid downtime in case of failure. A data center is considered N+1 when there is one additional unit for every 4 components. For instance, if a data center has 4 UPS systems, then for to achieve N+1, an additional UPS system would be required. |
| 2N | It refers to fully redundant design wherein two independent power distribution system is deployed. Therefore, in the event of a complete failure of one distribution system, the other system will still supply power to the data center. |
| In-Row Cooling | It is the cooling design system installed between racks in a row where it draws warm air from the hot aisle and supplies cool air to the cold aisle, thereby maintaining the temperature. |
| Tier 1 | Tier classification determines the preparedness of a data center facility to sustain data center operation. A data center is classified as Tier 1 data center when it has a non-redundant (N) power component (UPS, generators), cooling components, and power distribution system (from utility power grids). The Tier 1 data center has an uptime of 99.67% and an annual downtime of <28.8 hours. |
| Tier 2 | A data center is classified as Tier 2 data center when it has a redundant power and cooling components (N+1) and a single non-redundant distribution system. Redundant components include extra generators, UPS, chillers, heat rejection equipment, and fuel tanks. The Tier 2 data center has an uptime of 99.74% and an annual downtime of <22 hours. |
| Tier 3 | A data center having redundant power and cooling components and multiple power distribution systems is referred to as a Tier 3 data center. The facility is resistant to planned (facility maintenance) and unplanned (power outage, cooling failure) disruption. The Tier 3 data center has an uptime of 99.98% and an annual downtime of <1.6 hours. |
| Tier 4 | It is the most tolerant type of data center. A Tier 4 data center has multiple, independent redundant power and cooling components and multiple power distribution paths. All IT equipment are dual powered, making them fault tolerant in case of any disruption, thereby ensuring interrupted operation. The Tier 4 data center has an uptime of 99.74% and an annual downtime of <26.3 minutes. |
| Small Data Center | Data center that has floor space area of ≤ 5,000 Sq. ft or the number of racks that can be installed is ≤ 200 is classified as a small data center. |
| Medium Data Center | Data center which has floor space area between 5,001-20,000 Sq. ft, or the number of racks that can be installed is between 201-800, is classified as a medium data center. |
| Large Data Center | Data center which has floor space area between 20,001-75,000 Sq. ft, or the number of racks that can be installed is between 801-3,000, is classified as a large data center. |
| Massive Data Center | Data center which has floor space area between 75,001-225,000 Sq. ft, or the number of racks that can be installed is between 3001-9,000, is classified as a massive data center. |
| Mega Data Center | Data center that has a floor space area of ≥ 225,001 Sq. ft or the number of racks that can be installed is ≥ 9001 is classified as a mega data center. |
| Retail Colocation | It refers to those customers who have a capacity requirement of 250 kW or less. These services are majorly opted by small and medium enterprises (SMEs). |
| Wholesale Colocation | It refers to those customers who have a capacity requirement between 250 kW to 4 MW. These services are majorly opted by medium to large enterprises. |
| Hyperscale Colocation | It refers to those customers who have a capacity requirement greater than 4 MW. The hyperscale demand primarily originates from large-scale cloud players, IT companies, BFSI, and OTT players (like Netflix, Hulu, and HBO+). |
| Mobile Data Speed | It is the mobile internet speed a user experiences via their smartphones. This speed is primarily dependent on the carrier technology being used in the smartphone. The carrier technologies available in the market are 2G, 3G, 4G, and 5G, where 2G provides the slowest speed while 5G is the fastest. |
| Fiber Connectivity Network | It is a network of optical fiber cables deployed across the country, connecting rural and urban regions with high-speed internet connection. It is measured in kilometer (km). |
| Data Traffic per Smartphone | It is a measure of average data consumption by a smartphone user in a month. It is measured in gigabyte (GB). |
| Broadband Data Speed | It is the internet speed that is supplied over the fixed cable connection. Commonly, copper cable and optic fiber cable are used in both residential and commercial use. Here, optic cable fiber provides faster internet speed than copper cable. |
| Submarine Cable | A submarine cable is a fiber optic cable laid down at two or more landing points. Through this cable, communication and internet connectivity between countries across the globe is established. These cables can transmit 100-200 terabits per second (Tbps) from one point to another. |
| Carbon Footprint | It is the measure of carbon dioxide generated during the regular operation of a data center. Since, coal, and oil & gas are the primary source of power generation, consumption of this power contributes to carbon emissions. Data center operators are incorporating renewable energy sources to curb the carbon footprint emerging in their facilities. |


Research Methodology
Mordor Intelligence follows a four-step methodology in all our reports.
- Step-1: Identify Key Variables: In order to build a robust forecasting methodology, the variables and factors identified in Step-1 are tested against available historical market numbers. Through an iterative process, the variables required for market forecast are set and the model is built on the basis of these variables.
- Step-2: Build a Market Model: Market-size estimations for the forecast years are in nominal terms. Inflation is not a part of the pricing, and the average selling price (ASP) is kept constant throughout the forecast period for each country.
- Step-3: Validate and Finalize: In this important step, all market numbers, variables and analyst calls are validated through an extensive network of primary research experts from the market studied. The respondents are selected across levels and functions to generate a holistic picture of the market studied.
- Step-4: Research Outputs: Syndicated Reports, Custom Consulting Assignments, Databases & Subscription Platforms


