Plasma Cutting Machine Market Size and Share
Market Overview
| Study Period | 2020 - 2031 |
|---|---|
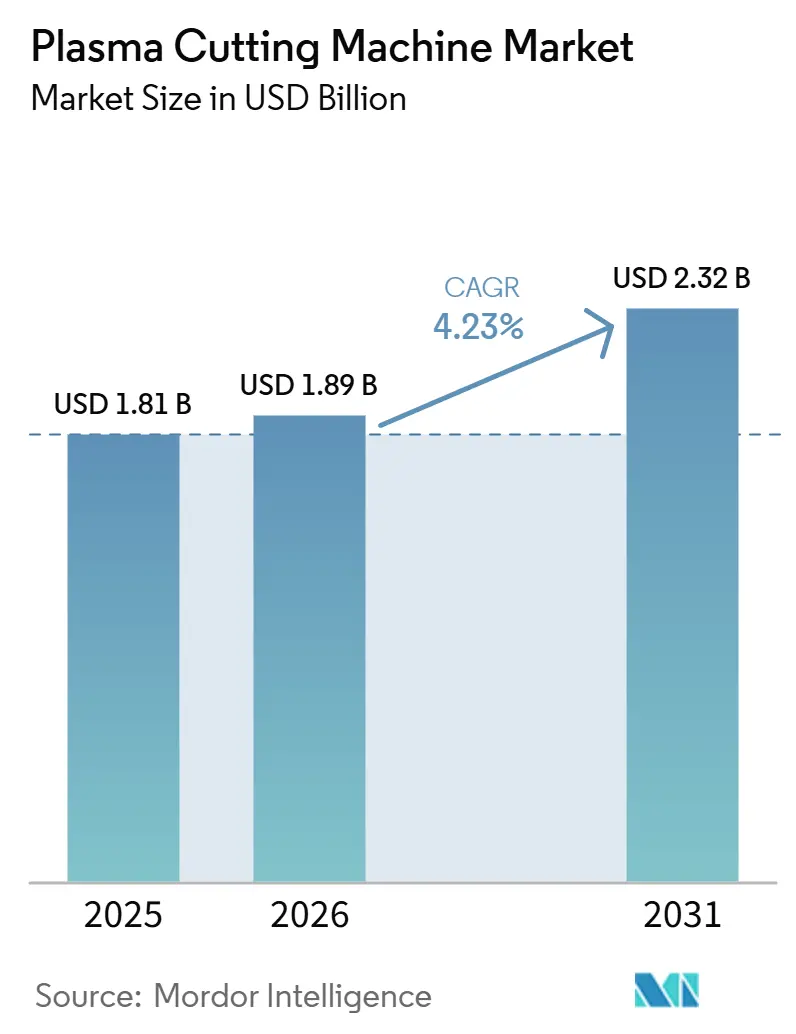
| Market Size (2026) | USD 1.89 Billion |
| Market Size (2031) | USD 2.32 Billion |
| Growth Rate (2026 - 2031) | 4.23% CAGR |
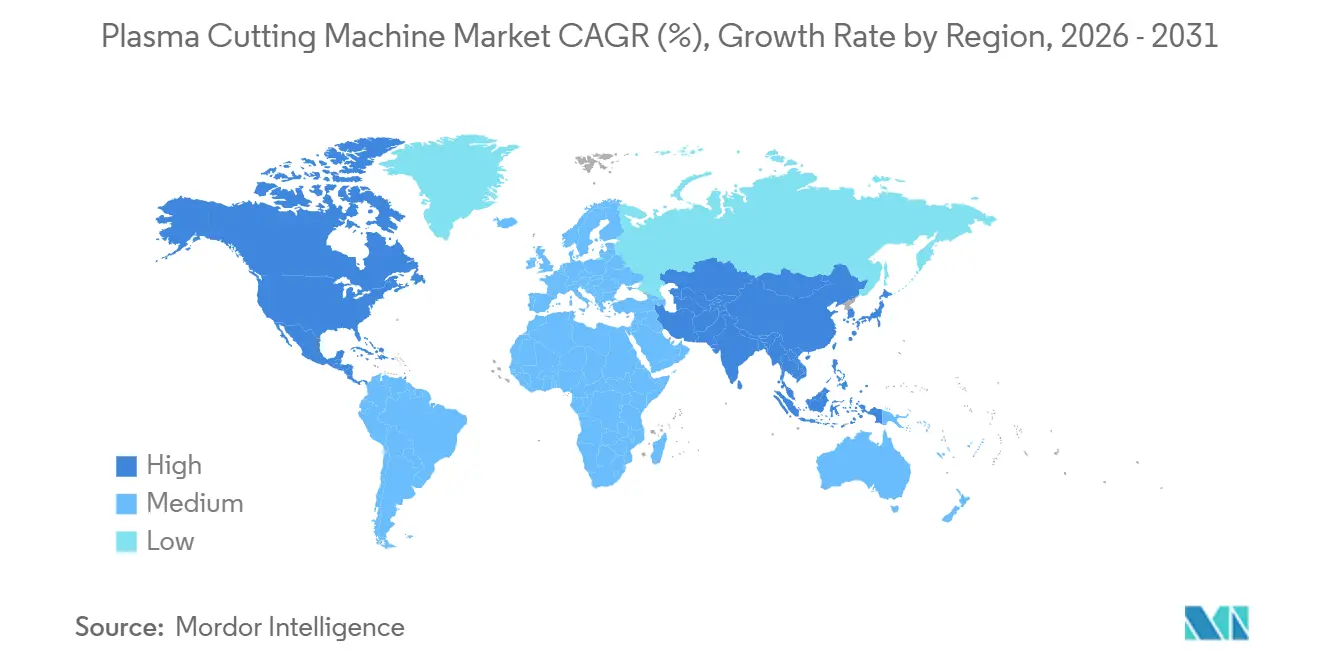
| Fastest Growing Market | South America |
| Largest Market | Asia Pacific |
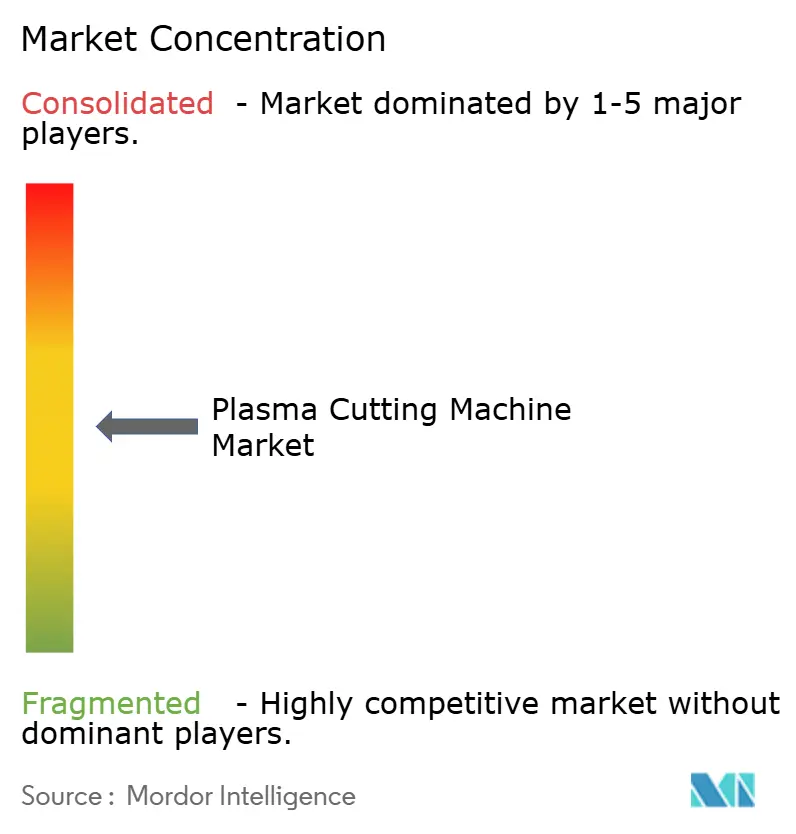
| Market Concentration | Medium |
Major Players *Disclaimer: Major Players sorted in no particular order Image © Mordor Intelligence. Reuse requires attribution under CC BY 4.0. | |
Plasma Cutting Machine Market Analysis by Mordor Intelligence
The Plasma Cutting Machine Market size is projected to be USD 1.81 billion in 2025, USD 1.89 billion in 2026, and reach USD 2.32 billion by 2031, growing at a CAGR of 4.23% from 2026 to 2031.
Competitive pressure from fiber lasers continues to reshape product positioning as vendors differentiate through thick-plate productivity, coated-material tolerance, and total cost of ownership outcomes. Sustained investment in shipbuilding modernization across the United States and Europe supports demand for high-amperage platforms as yards scale capacity and adopt more automated cutting cells. European policy actions align decarbonization goals with digital upgrade paths in marine production, which sustains a steady pull for advanced thermal cutting integration in shipyards. Factory digitalization is broadening the installed base for CNC plasma as manufacturers accelerate adoption of AI-enabled systems that can monitor, optimize, and document cut quality at scale. South Asia’s push to build advanced manufacturing capabilities, including robotics and digital twins, is reinforcing demand for flexible and cost-effective thermal cutting solutions in both mid and high amperage ranges.
Key Report Takeaways
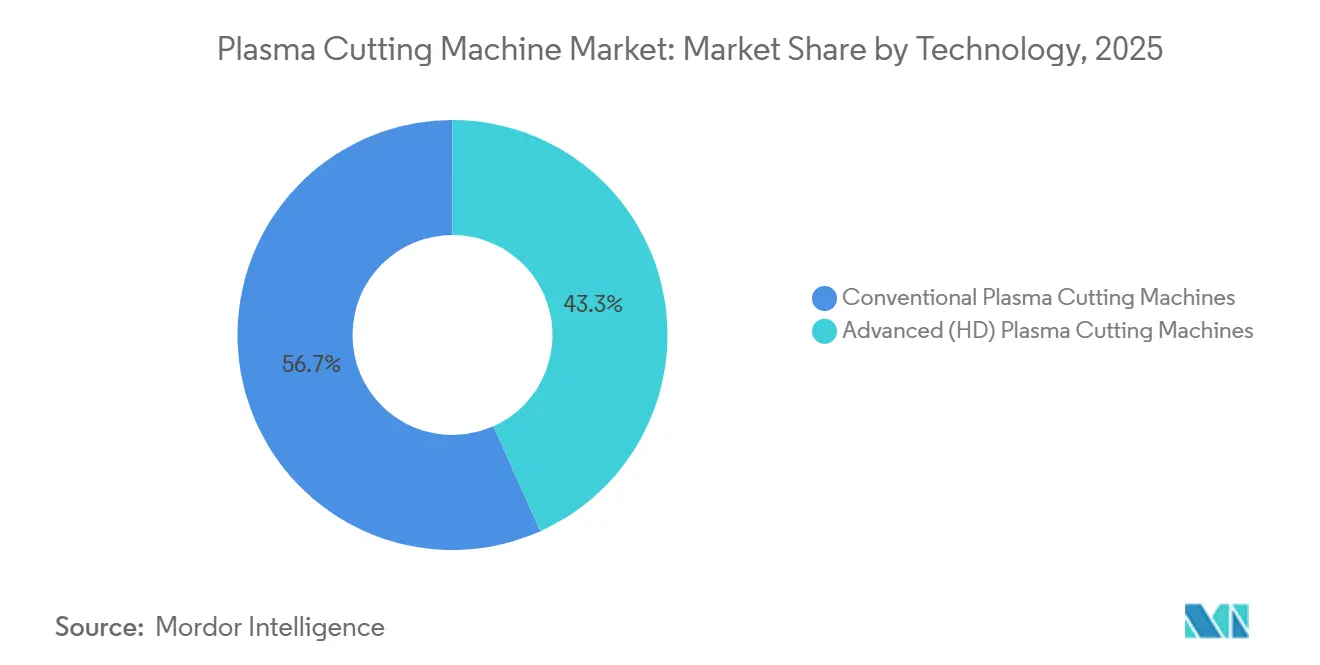
- By technology type, conventional plasma systems led with 56.71% share of the plasma cutting machine market size in 2025. High-definition plasma is projected to expand at a 6.41% CAGR through 2031.
- By automation level, automated and CNC systems held 59.24% share in 2025. Automated and CNC are projected to record a 5.87% CAGR through 2031.
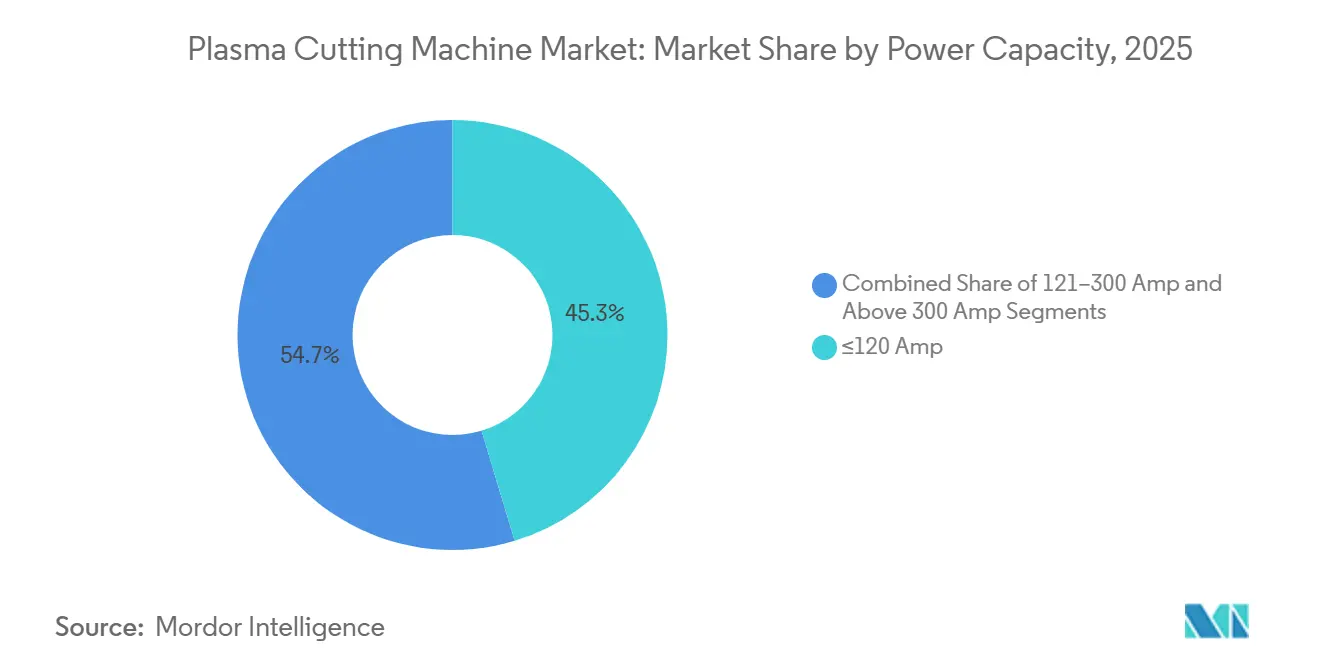
- By power capacity, ≤120 amps systems captured 45.32% of the plasma cutting machine market share in 2025. Systems rated above 300 amps are projected to advance at a 6.82% CAGR through 2031.
- By end-user industry, automotive and transportation accounted for 28.71% share in 2025. Shipbuilding and offshore operations are among the fastest-growing end uses through 2031.
- By geography, Asia-Pacific led with 28.71% share in 2025, while South America is forecast to post a 5.42% CAGR through 2031.
Note: Market size and forecast figures in this report are generated using Mordor Intelligence’s proprietary estimation framework, updated with the latest available data and insights as of January 2026.
Global Plasma Cutting Machine Market Trends and Insights
Drivers Impact Analysis*
| Driver | (~) % Impact on CAGR Forecast | Geographic Relevance | Impact Timeline |
|---|---|---|---|
| Rising Adoption of Automation and Industry 4.0 Integration | +1.2% | Global, with early gains in North America, Western Europe, and East Asia (China, Japan, South Korea) | Medium term (2-4 years) |
| Increasing Demand for High-Definition (HD) Plasma Technology | +0.8% | North America and EU, spill-over to APAC advanced manufacturing hubs | Medium term (2-4 years) |
| Expanding Automotive and Aerospace Manufacturing Demand | +1.0% | APAC core (China, India, Japan), secondary in North America and Europe | Short term (≤ 2 years) |
| Cost-Effectiveness and Superior Speed for Medium-to-Thick Metal Processing | +0.9% | Global | Short term (≤ 2 years) |
| Rapid Infrastructure Development and Construction Growth | +0.7% | Asia-Pacific, Middle East and Africa, secondary in Latin America | Long term (≥ 4 years) |
| Growth of Shipbuilding, Marine, and Offshore Industries | +0.6% | APAC core (China, South Korea, Japan), EU, spill-over to MEA | Long term (≥ 4 years) |
| Source: Mordor Intelligence | |||
Rising Adoption of Automation and Industry 4.0 Integration
National programs and public-private partnerships are lowering barriers to digital adoption in fabrication, which accelerates the shift toward CNC and sensor-rich plasma systems in production settings. Manufacturing USA reported engagement with more than 150,700 learners and workers and supported 920 applied R&D projects, reinforcing a pipeline of digital skills and demonstrators that shorten the path from pilot to scale. NIST’s Smart Manufacturing Systems Design and Analysis initiative is building reference architecture and assurance methods for cyber-physical systems, which helps integrators improve interoperability across controllers, robots, and cutting platforms[1]National Institute of Standards and Technology, “Smart Manufacturing Systems Design and Analysis Program,” National Institute of Standards and Technology, nist.gov. Equipment vendors are aligning with open interfaces and standardized data models to satisfy fabricators’ requirements for ERP and MES connectivity; a trend reflected in supplier communications and technology showcases. The NSF’s FY2026 request allocates dedicated funding for advanced manufacturing, including AI-enabled digital twins that can assist with real-time process control and quality documentation during cutting operations. Parallel to these initiatives, U.S. manufacturers reported rapid AI adoption in operations in 2025 and expect further integration by 2027, signaling rising demand for CNC plasma systems that embed analytics and closed-loop monitoring.
Increasing Demand for High-Definition (HD) Plasma Technology
Demand for HD plasma is supported by applications that require tight angularity and weld-ready edges on thicker materials, where lasers face constraints in speed, edge quality, or duty cycle. HD platforms maintain productivity advantages on coated and oxidized stock because plasma tolerates surface conditions that would otherwise require time-consuming preparation steps with lasers[2]American Welding Society, “Cutting Through the Noise: Plasma vs Fiber Laser CNC Cutting,” American Welding Society, aws.org. In thick-plate fabrication, HD plasma’s ability to sustain throughput and manage heat-affected zones supports downstream workflow efficiency in heavy equipment, shipbuilding, and structural steel. Fabricators also favor systems that integrate cleanly with CNC controllers and plant IT, since Ethernet-based interfaces and standards-driven data exchange simplify integration into connected shops. As buyers compare thick-plate productivity, coated-material tolerance, and certification workflows, HD plasma remains a practical choice for many high-mix, mid-to-thick metal operations.
Expanding Automotive and Aerospace Manufacturing Demand
Global EV adoption remained strong, with more than 17 million electric cars sold each year, and China accounted for the largest share, which sustains demand for precision cutting in battery enclosures and coated metal components. EU car production contributed 14.6% to global output in 2025, and more than one-third of EU-made vehicles were exported, which supports flexible cutting capacity for both ferrous structures and EV-focused non-ferrous parts across the region. Airbus reported 793 aircraft deliveries in 2025, reinforcing the need for consistent metal fabrication throughput on airframe components where thick-section work favors robust thermal cutting. Case evidence from U.S. manufacturers shows that integrating automated plasma can extend machine uptime and improve ROI by shifting the value equation toward spindle utilization rather than raw cut speed alone. These conditions sustain multi-industry demand for plasma platforms that balance speed, quality, and cost in EV and aerospace production.
Cost-Effectiveness and Superior Speed for Medium-to-Thick Metal Processing
Capital and operating cost comparisons show why plasma holds a share in medium-to-thick applications where throughput and simplicity matter. Multi-year cost-of-ownership comparisons from industry practitioners indicate significant savings for plasma over fiber laser when comparable capacity is required, with total cost driven by maintenance, consumables, and process gas usage profiles. Independent technical discussions confirm plasma’s speed advantages above specific thickness thresholds for mild steel and highlight plasma’s tolerance to rust, paint, and scale that would otherwise require added steps in laser workflows. Shop-level analysis from a North American fabricator positions HD plasma as a balance of quality and speed for thicker workpieces, particularly in heavy equipment and structural fabrication, where ISO-compliant quality outcomes are needed without the capital intensity of high-power lasers. These comparisons reinforce the role of plasma in multi-shift environments that run mixed materials and variable thicknesses with an emphasis on reliability and unit economics.
Restraints Impact Analysis*
| Restraint | (~) % Impact on CAGR Forecast | Geographic Relevance | Impact Timeline |
|---|---|---|---|
| Intense Competition from Fiber Laser Cutting Technology | -1.1% | Global | Short term (≤ 2 years) |
| High Initial Investment and Total Cost of Ownership | -0.7% | North America, EU, APAC advanced manufacturing clusters | Medium term (2-4 years) |
| Shortage of Skilled Operators and Training Requirements | -0.5% | Global, with acute pressure in North America, Western Europe, and APAC | Long term (≥ 4 years) |
| Precision and Cut Quality Limitations for High-Tolerance Applications | -0.4% | Global, concentrated in precision manufacturing hubs (Germany, Japan, South Korea) | Medium term (2-4 years) |
| Source: Mordor Intelligence | |||
Intense Competition from Fiber Laser Cutting Technology
Fiber lasers have expanded quickly in thin-to-mid thickness bands due to speed and efficiency, which reshapes purchase choices for fabricators focused on sheet and thin plate. Industry comparisons point to higher wall-plug efficiency and much faster thin-gauge speeds for fiber lasers, along with broader adoption across cutting workflows since 2016. Suppliers are scaling fiber power levels beyond 20 kW with advanced beam quality, which supports cleaner cutting and higher velocities on thicker materials in automated systems. Technical reviews note that plasma retains advantages on mild steel above certain thickness thresholds and on coated or rusty stock, while very high laser powers can face duty cycle and heat distortion concerns in production. Diversified machine builders continue to invest in fiber portfolios for welding and cutting, including EV battery joining applications, which strengthens the case for lasers in adjacent workflows that once defaulted to plasma.
Shortage of Skilled Operators and Training Requirements
Workforce constrains slow adoption for both laser and plasma automation, with certification and safety training adding time and cost for small shops. CNC operator training can take from 2 weeks to 6 months, and certified professionals tend to command higher wages, which can strain budgets in small and mid-sized fabricators. Training gaps become more acute as shops shift from manual to automated systems that require CAD/CAM programming, preventative maintenance, and formal safety protocols. Industry builders and schools are expanding vocational initiatives and digital learning to close skills gaps, including simulators and platform-agnostic curricula that ease transitions to CNC thermal cutting. U.S. programs that fund robotics, real-time sensors, and in-situ quality checks help derisk automation projects and make upskilling investments more practical for SMEs.[3]Manufacturing USA, “Organic Industrial Base Modernization Project Call,” Manufacturing USA, manufacturingusa.com
*Our forecasts treat driver/restraint impacts as directional, not additive. The impact forecasts reflect baseline growth, mix effects, and variable interactions.
Segment Analysis
By Technology Type: Conventional Systems Hold Volume, HD Plasma Captures Value
Conventional plasma cutting machines commanded 56.71% share in 2025, supported by entrenched installed bases in general fabrication, construction service centers, and maintenance operations, and lower capital budgets guide choices. Advanced high-definition platforms are gaining popularity as users pursue tighter tolerances and more consistent bevel quality on thicker sections, with the fastest cohort forecast at a 6.41% CAGR through 2031. As OEM quality thresholds rise, many fabricators are repositioning to HD plasma for structural components and EV battery enclosures where stable edge quality, reduced secondary finishing, and robust thick-plate throughput matter. Conventional platforms will continue to ship in high volumes, but share erosion is likely as buyers weigh productivity gains, consumable life, and weld-readiness benefits in HD systems. This shift is more pronounced in markets where shipbuilding and aerospace cutting requirements tighten, since these use cases depend on reliable results in thicker materials and coated stock, areas where plasma sustains process advantages.
Across industrial use cases, modernization strategies often favor upgrading tables and controls rather than full machine replacement, which sustains demand for retrofit kits and advanced consumables. A 2026 modernization project at Grosschädl Stahl illustrates how fabricators refresh legacy assets with improved torches, motion systems, and software while preserving existing footprints. In naval and commercial shipyards, policy support for maritime capacity expansion and modernization tilts investment toward high-amperage plasma that can cut thick naval steels and corrosion-resistant alloys at industrial throughput. Given these needs, HD systems will continue to capture incremental value where multi-process integration, repeatable bevels, and certifiable edge quality matter most, while conventional units retain volume in cost-conscious and field-repair contexts. Conventional systems held 56.71% of the plasma cutting machines market share in 2025, and the gap between installed-base volume and value capture will widen as HD adoption steps up in heavier applications. The plasma cutting machines market continues to segment along cut-quality thresholds and upgrade pathways that let users time modernization to production demands and budgets.


By Automation Level: CNC Dominance Reflects Digital Imperative
Automated and CNC plasma machines held 59.24% share in 2025 and are the fastest-growing automation segment at a 5.87% CAGR through 2031 as fabricators scale connected production cells and mitigate workforce gaps. Manual and handheld units will remain common in field work, remote sites, and developing regions where portability and cost sensitivity drive purchases. Hybrid gantry configurations that combine plasma, oxy-fuel, and drill or tap modules appeal to structural fabricators that must process ultra-thick material and add holes or bevels in a single setup. Vendors continue to showcase multi-process gantries that integrate plasma and oxy-fuel or drilling, reflecting a customer preference for flexible cells that handle mixed thickness and part complexity on one bed. The plasma cutting machines market benefits when buyers can align automation investments with software readiness, plant connectivity, and practical training plans.
Integration remains a hurdle for many small and mid-sized shops, which slows uptake despite clear throughput benefits. NIST has documented that only a small fraction of potential users have deployed robotics due to installation time, model availability, and lack of modular, interoperable designs, which maps closely to adoption barriers for automated cutting. Concurrently, U.S. funding calls are targeting digital operations, robotic sensing, AI planning, and in-situ inspection to de-risk factory upgrades that rely on data-driven control of cutting processes. On the equipment side, systems such as Koike Aronson’s ShopPro XHD Katana emphasize encoder stability and modern servo dynamics to speed setup and improve reliability after power interruptions. ESAB’s 2024 report shows active portfolio development through strategic acquisitions in Brazil, Bangladesh, and South America to broaden automation and light-industrial footprints that can integrate cutting and welding in packaged cells. The plasma cutting machines market size for automated and CNC systems is projected to expand at a 5.87% CAGR through 2031 as integration support, standardized communications, and training resources improve.
By Power Capacity: Budget Systems Lead Volume, High-Power Unlocks Premium Segments
Units rated at ≤120 amps captured 45.32% share in 2025, reflecting strong demand in contractor, automotive repair, HVAC, and technical education, where portability and price outweigh the need for high cut capacity. Above 300 amps is the fastest-growing tier at a 6.82% CAGR through 2031 since shipyards, offshore fabricators, and heavy equipment manufacturers require consistent throughput on thick sections and corrosion-resistant alloys. The 121-to-300-amp segment anchors general fabrication on a 6 to 25 mm plate, a band where plasma competes directly with mid-power fiber lasers yet maintains tolerance for scale and coatings. As a result, platform choice depends on a shop’s material mix, duty cycle, and the cost profile of gas, power, and consumables across multi-shift operations. This segmentation continues to shape how vendors package gantries, power supplies, and torch technologies for mixed-thickness workflows and integrated beveling.
High-amperage demand is reinforced by maritime policy and infrastructure investment that encourage U.S. yards to recapitalize and scale shipbuilding capacity, which favors plasma for heavy steel work and thick aluminum superstructures. On the gantry side, North American offerings that bundle plasma with oxy-fuel and drilling, plus features like contour cut optimization and tool storage, help structural shops reduce setups while expanding the range of parts they can complete on one bed. In India, the government’s advanced manufacturing roadmap outlines a build phase that includes frontier-technology parks for aerospace, electronics, and automotive, which supports the adoption of mid-to-high amperage CNC plasma in MSME clusters seeking shared-use models[4]NITI Aayog, “Reimagining Manufacturing: India’s Roadmap to Global Leadership in Advanced Manufacturing,” Government of India, niti.gov.in. The plasma cutting machines industry benefits from these investments as users match capacity choices to thickness, material variety, and automation plans that fit evolving production needs.

Geography Analysis
Asia-Pacific held 28.71% of the plasma cutting machines market share in 2025, led by China’s EV manufacturing base and steady investment in automotive and industrial fabrication. South America is the fastest-growing region at a 5.42% CAGR through 2031 on the back of automotive expansions and a rising installed base for thermal cutting, aided by corporate investments that broaden automation and equipment portfolios in the Americas. China’s EV sales strength and broader APAC supplier networks continue to support demand for flexible plasma capacity in both mid and high thickness ranges. In North America, maritime policy proposals and yard recapitalization need to favor investments in heavy-duty systems that can process thick naval steel and aluminum, which supports suppliers serving large fabrication programs. The plasma cutting machines market size in South America is projected to expand at a 5.42% CAGR through 2031 as cost-effective platforms gain traction among first-time automation buyers.
Europe shows a dual-speed profile. Western centers emphasize HD plasma technology and tight tolerances for automotive and aerospace supply chains, while Central and Eastern Europe emphasize cost-effectiveness and installed-base upgrades in structural and general fabrication. The EU’s industrial maritime strategy strengthens modernization and digitization initiatives in yards across member states, which supports more automated plasma bevel cutting and integrated cells where thick steel remains a core workload. As Western Europe pursues higher precision and traceability, Eastern Europe balances upgrades with budget constraints, keeping conventional plasma relevant alongside gradual HD adoption. The plasma cutting machines market in Europe will therefore continue to reflect distinct buyer priorities, from certification-driven HD in the west to lifecycle-focused retrofits in the east.
The Middle East and Africa remain mixed, with offshore and energy projects in the Gulf countries sustaining high-amperage demand, while sub-Saharan markets favor portable units due to grid and infrastructure variability. In South Asia, India’s advanced manufacturing roadmap prioritizes robotics and digital twins, which support incremental adoption of mid-to-high amperage CNC plasma within MSME clusters and shared-use facilities. In North America, public programs continue to back R&D and workforce development across thousands of organizations, which reduces risk for SMEs pursuing automation and real-time quality systems on cutting-edge platforms. These regional patterns reinforce that the plasma cutting machines market grows fastest where policy support, industry training, and supply-chain requirements intersect to justify automation and upgrade cycles.

Competitive Landscape
The plasma cutting machines market is moderately fragmented, with global suppliers such as Hypertherm Associates, ESAB, Lincoln Electric, TRUMPF, Messer Cutting Systems, Komatsu NTC, and Koike Aronson competing alongside fast-moving Chinese manufacturers. Price-based competition from lower-cost imports challenges established brands in entry segments, while heavy-duty and HD categories reward performance, consumable life, and integration support. Gantry builders that integrate third-party power sources let buyers choose best-of-breed components across plasma, oxy-fuel, and drilling, which reflects a practical approach to multi-process requirements. Laser competition overlaps with plasma in certain thickness bands, but plasma retains an edge in thick-plate and coated stock in many production contexts, which preserves a durable role for thermal arc processes.
Software-centric entrants are changing the controller layer by offering cloud-based nesting and optimization tools that are hardware-agnostic, which gradually reduce lock-in at the CNC and HMI. In response, leading suppliers are differentiating through service guarantees and lifecycle economics, including extended warranties that lower downtime risk for fabricators who run multi-shift operations. Hypertherm Associates extended the warranty on Powermax systems from three years to six years for orders delivered on or after January 1, 2025, which underscores a shift toward value-based propositions beyond initial price. On the technology front, diversified builders continue to expand fiber portfolios for adjacent welding and cutting use cases, including high-precision EV battery welding, which intensifies competitive pressure at the thin-to-mid gauge range. The plasma cutting machines market positions value around uptime, consumables, and integration outcomes that translate into predictable part flow.
Regional growth strategies also influence competitive dynamics. ESAB’s 2024 results show acquisitions that expand automation and service capabilities in the Americas and South Asia, adding light-industrial automation and strengthening repair and maintenance offerings that complement cutting and welding portfolios. Messer’s large-format projects in Europe highlight how some fabricators consolidate multiple thermal cutting technologies on a single platform when it fits part mix and throughput targets, which can displace older CO2 lasers and even some plasma installations in the thin-to-mid ranges. At the same time, many structural steel and shipyard users continue to invest in high-amperage plasma for thicker materials where duty cycle, coated stock tolerance, and bevel accuracy remain decisive. The plasma cutting machines market will therefore continue to balance cost-driven entry products against performance-led premium systems, with service, software, and integration support playing a growing role in differentiation.
Plasma Cutting Machine Industry Leaders
Hypertherm
ESAB Corporation
Lincoln Electric
Komatsu NTC
Messer Cutting Systems
- *Disclaimer: Major Players sorted in no particular order

Recent Industry Developments
- March 2026: The European Commission launched its Industrial Maritime Strategy, establishing an EU Industrial Maritime Value Chain Alliance and accelerating digital and circular transformation of European shipyards through the Connecting Europe Facility, Innovation Fund, Horizon Europe, and European Defense Fund programs.
- January 2026: Messer Cutting Systems completed modernization upgrades at Grosschädl Stahl, integrating the latest cutting technology into existing plasma installations and illustrating retrofit-driven upgrade pathways.
- July 2025: Messer Cutting Systems introduced its ELEMENT L laser cutting system for Europe Steel Center in Moerdijk, Netherlands, a customized XXXL fiber laser platform that replaced multiple legacy systems and optimized the hall layout and throughput.


Global Plasma Cutting Machine Market Report Scope
The Plasma Cutting Machines Market Report is Segmented by Technology Type (Conventional, Advanced HD), by Automation Level (Manual/Handheld, Automated & CNC, Hybrid), by Power Capacity (≤120 Amp, 121–300 Amp, Above 300 Amp), by End-User Industry (Automotive & Transportation, Construction, and More), and by Geography (North America, South America, Europe, and More). The Market Forecasts are Provided in Terms of Value (USD Billion).
| Conventional Plasma Cutting Machines |
| Advanced (HD) Plasma Cutting Machines |
| Manual / Handheld Plasma Cutting Machines |
| Automated & CNC Plasma Cutting Machines |
| Hybrid Plasma Cutting Machines |
| ≤120 Amp |
| 121–300 Amp |
| Above 300 Amp |
| Automotive & Transportation |
| Industrial Machinery & Heavy Equipment |
| Shipbuilding & Offshore |
| Construction & Infrastructure |
| Aerospace & Defense |
| Others (general metal fabrication, energy & power, etc.) |
| North America | United States |
| Canada | |
| Mexico | |
| South America | Brazil |
| Argentina | |
| Peru | |
| Rest of South America | |
| Europe | United Kingdom |
| Germany | |
| France | |
| Italy | |
| Spain | |
| BENELUX (Belgium, Netherlands, and Luxembourg) | |
| NORDICS (Denmark, Finland, Iceland, Norway, and Sweden) | |
| Rest of Europe | |
| Asia-Pacific | China |
| India | |
| Japan | |
| Australia | |
| South Korea | |
| ASEAN (Indonesia, Thailand, Philippines, Malaysia, Vietnam) | |
| Rest of Asia-Pacific | |
| Middle East and Africa | Saudi Arabia |
| United Arab Emirates | |
| Qatar | |
| Kuwait | |
| Turkey | |
| Egypt | |
| South Africa | |
| Nigeria | |
| Rest of Middle East and Africa |
| By Technology Type | Conventional Plasma Cutting Machines | |
| Advanced (HD) Plasma Cutting Machines | ||
| By Automation Level | Manual / Handheld Plasma Cutting Machines | |
| Automated & CNC Plasma Cutting Machines | ||
| Hybrid Plasma Cutting Machines | ||
| By Power Capacity | ≤120 Amp | |
| 121–300 Amp | ||
| Above 300 Amp | ||
| By End-User Industry | Automotive & Transportation | |
| Industrial Machinery & Heavy Equipment | ||
| Shipbuilding & Offshore | ||
| Construction & Infrastructure | ||
| Aerospace & Defense | ||
| Others (general metal fabrication, energy & power, etc.) | ||
| By Geography | North America | United States |
| Canada | ||
| Mexico | ||
| South America | Brazil | |
| Argentina | ||
| Peru | ||
| Rest of South America | ||
| Europe | United Kingdom | |
| Germany | ||
| France | ||
| Italy | ||
| Spain | ||
| BENELUX (Belgium, Netherlands, and Luxembourg) | ||
| NORDICS (Denmark, Finland, Iceland, Norway, and Sweden) | ||
| Rest of Europe | ||
| Asia-Pacific | China | |
| India | ||
| Japan | ||
| Australia | ||
| South Korea | ||
| ASEAN (Indonesia, Thailand, Philippines, Malaysia, Vietnam) | ||
| Rest of Asia-Pacific | ||
| Middle East and Africa | Saudi Arabia | |
| United Arab Emirates | ||
| Qatar | ||
| Kuwait | ||
| Turkey | ||
| Egypt | ||
| South Africa | ||
| Nigeria | ||
| Rest of Middle East and Africa | ||


Key Questions Answered in the Report
What is the 2026 size and 2031 outlook for the plasma cutting machines market?
The Plasma Cutting Machines Market size is estimated at USD 1.9 billion in 2026 and is projected to reach USD 2.32 billion by 2031 at a 4.23% CAGR.
Which application spaces are sustaining demand for plasma systems in 2026?
Thick-plate structural steel, shipbuilding, heavy equipment, and coated EV battery enclosure materials sustain demand due to plasma’s throughput and tolerance for surface conditions.
How is policy shaping demand for high-amperage platforms?
U.S. and EU maritime initiatives emphasize yard upgrades and capacity expansion, which support investment in heavy-duty plasma cutting cells for thick naval and commercial steel.
Where is the fastest regional growth expected through 2031?
South America shows the fastest trajectory, with the plasma cutting machines market size in the region projected to expand at a 5.42% CAGR through 2031.
What keeps plasma competitive against fiber lasers?
Plasma remains competitive on medium-to-thick materials, on coated or rusty stock, and where total cost of ownership and multi-process flexibility matter more than thin-gauge speed.
Which buyer profile favors automated CNC plasma in 2026?
Fabricators pursuing connected cells, predictive maintenance, and real-time quality logging favor automated CNC plasma, especially where workforce constraints and uptime targets are critical.
Page last updated on:


