Market Overview
| Study Period | 2020 - 2031 |
|---|---|
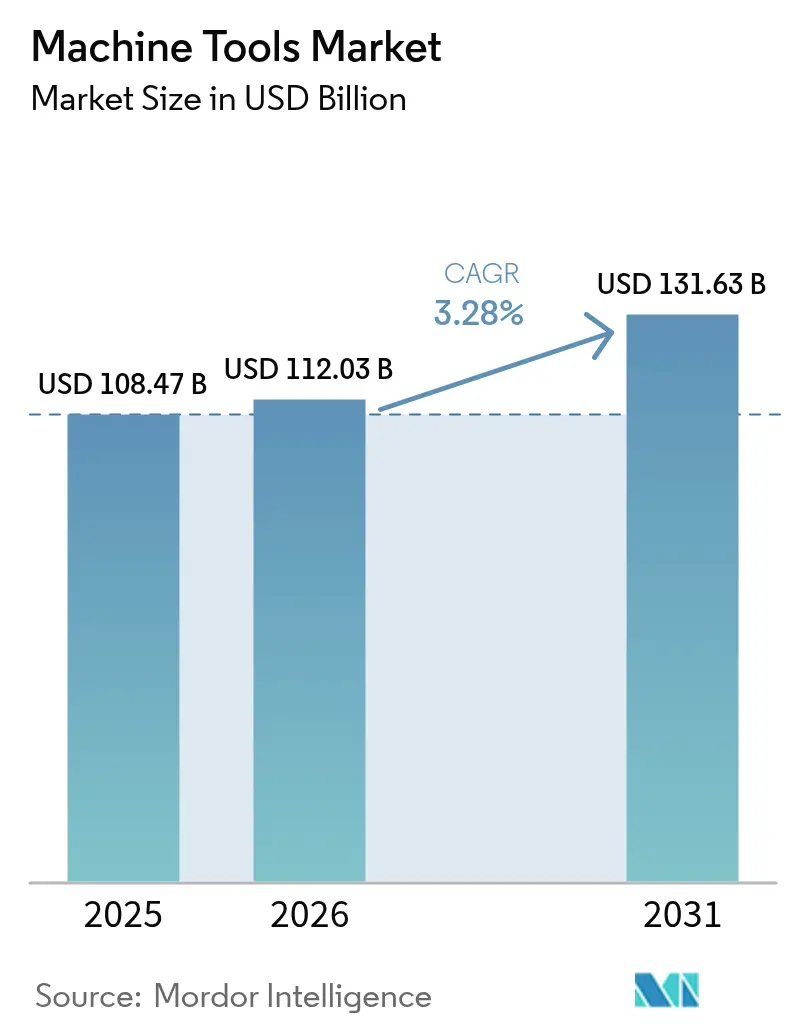
| Market Size (2026) | USD 112.03 Billion |
| Market Size (2031) | USD 131.63 Billion |
| Growth Rate (2026 - 2031) | 3.28% CAGR |
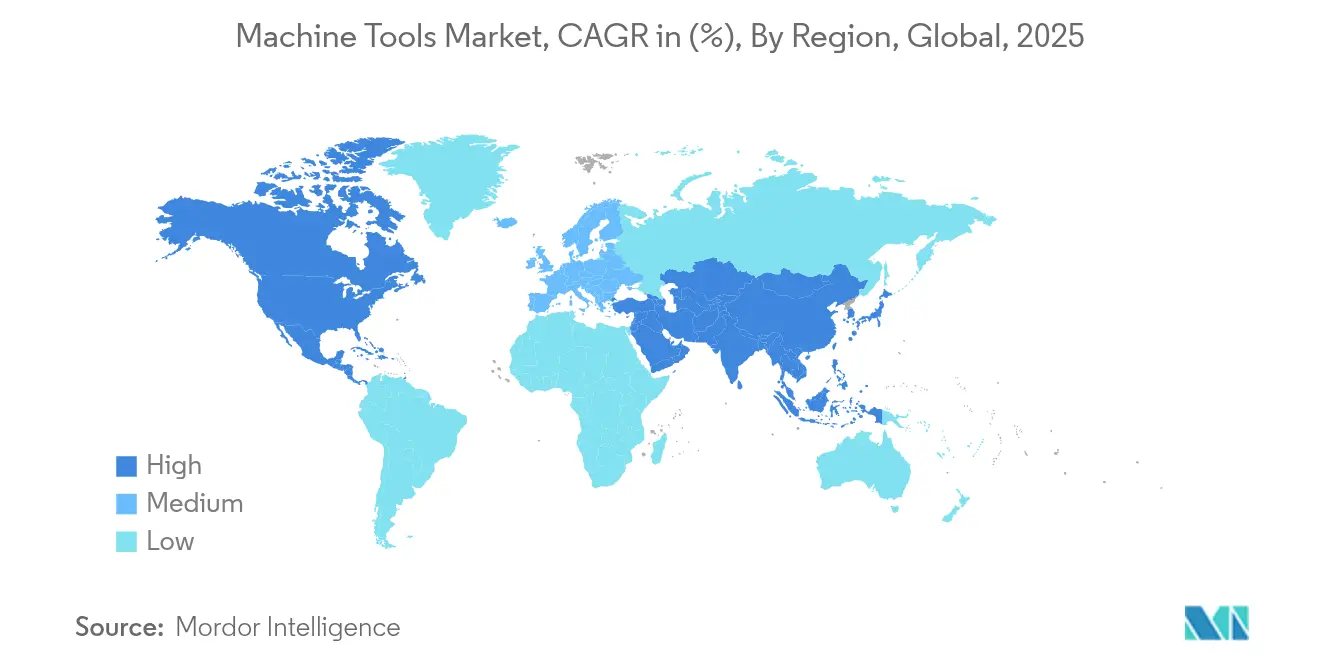
| Fastest Growing Market | Asia Pacific |
| Largest Market | Asia Pacific |
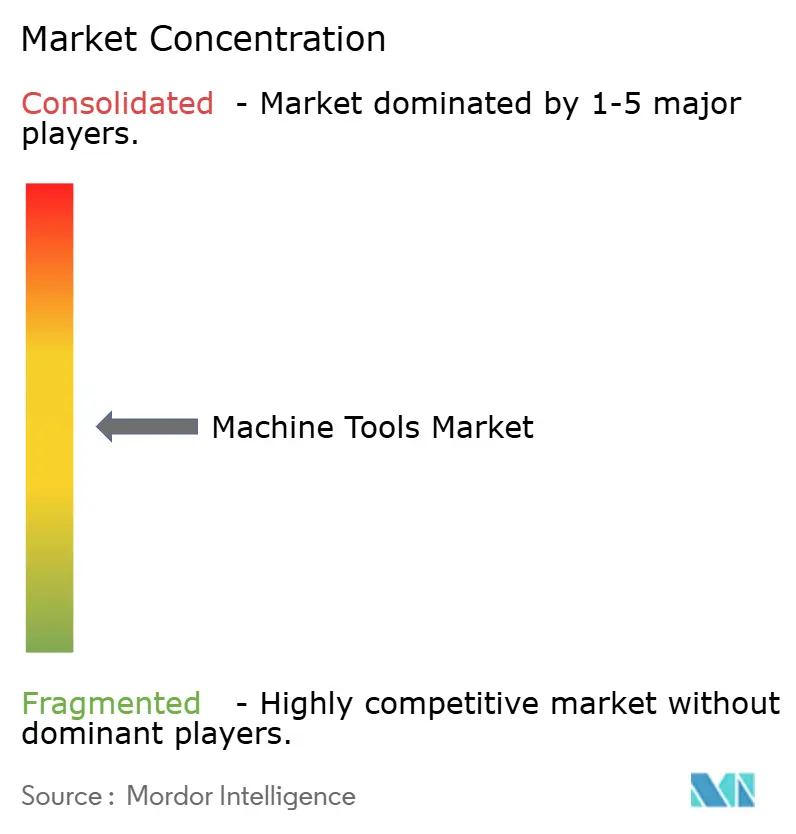
| Market Concentration | Medium |
Major Players *Disclaimer: Major Players sorted in no particular order Image © Mordor Intelligence. Reuse requires attribution under CC BY 4.0. | |
Machine Tools Market Analysis by Mordor Intelligence
The Machine Tools Market size in 2026 is estimated at USD 112.03 billion, growing from 2025 value of USD 108.47 billion with 2031 projections showing USD 131.63 billion, growing at 3.28% CAGR over 2026-2031. This expansion occurs against a backdrop of realigned supply chains, stricter trade rules, and record investment in semiconductor fabs, each of which demands ultra-precision machining capacity. ASML’s High-NA EUV systems, which cost more than USD 400 million apiece, exemplify how next-generation lithography is lifting the performance bar for nanometer-level metal cutting and finishing [1]Jordan Novet, “ASML’s USD 400 Million High-NA EUV Machines Set New Precision Standard,” CNBC, cnbc.com. Electrification in automotive and ongoing aerospace modernization are spurring purchases of multi-axis machining centers, while Industry 4.0 projects increasingly bundle AI-enabled CNC controls that self-optimize feed rates and tool paths. Regional investment patterns show Asia drawing the bulk of new capacity additions, yet reshoring incentives in the United States and tariff uncertainty in Europe are tilting future demand toward more diversified plant footprints. Direct sales still dominate the global distribution mix, but e-commerce portals are accelerating procurement cycles for mid-ticket CNC models and replacement tooling.
Key Report Takeaways
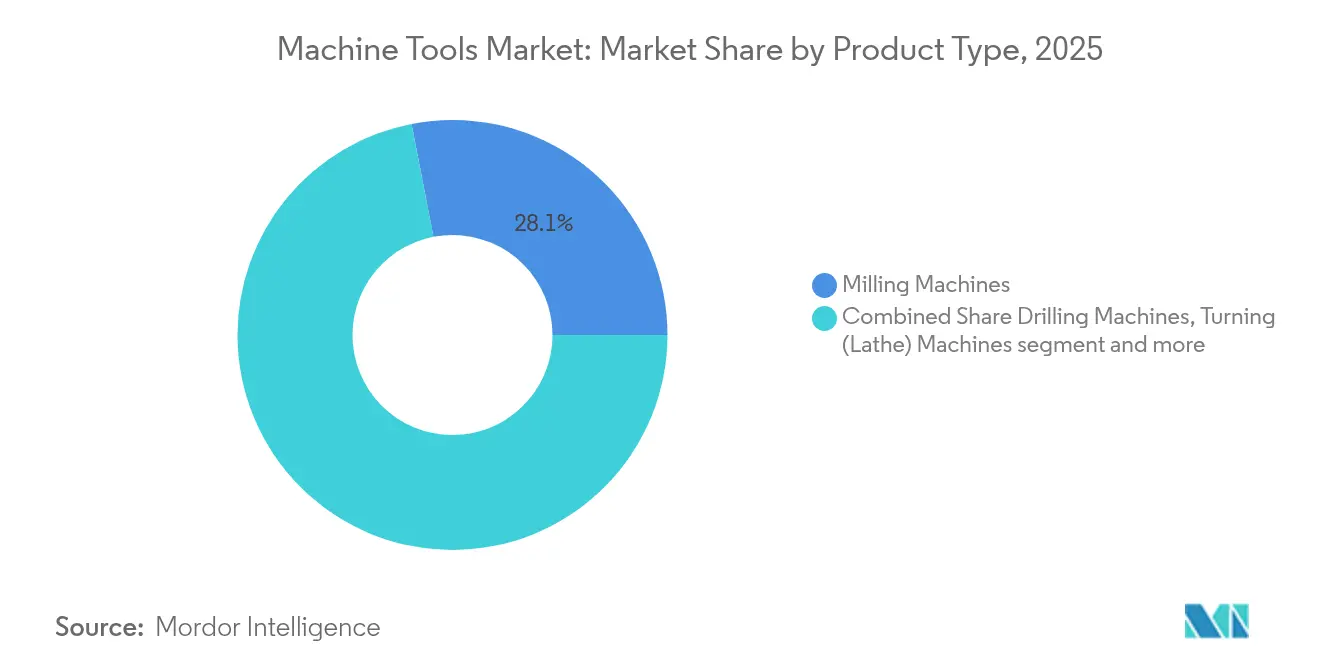
- By product type, Milling machines held 28.05% of the machine tools market share in 2025; multi-axis machining centers are projected to grow at a 6.88% CAGR to 2031.
- By technology, CNC platforms accounted for 68.55% of the machine tools market share in 2025 and will expand at a 6.08% CAGR through 2031.
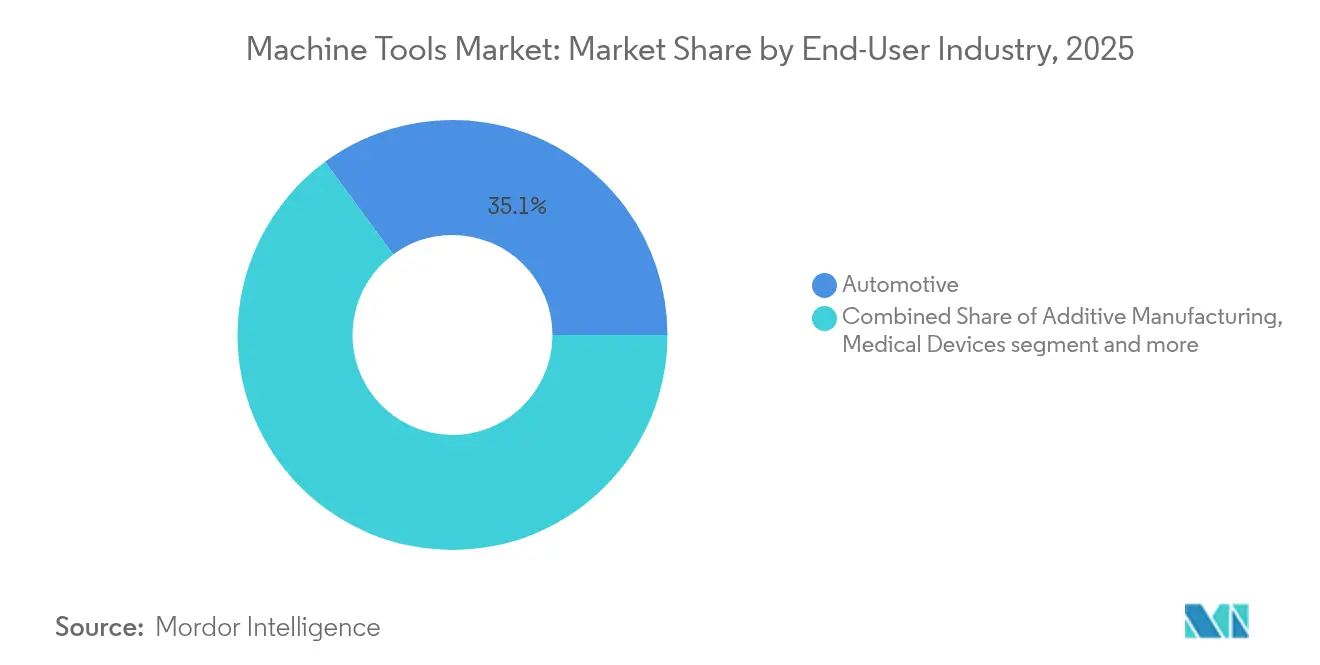
- By end-user industry, Automotive contributed 35.10% of the machine tools market size in 2025, whereas aerospace & defence leads future growth with a 6.62% CAGR.
- By sales channel, Direct sales represented 55.20% of the machine tools market size in 2025; online/e-commerce platforms are advancing at a 7.74% CAGR.
- By region, Asia Pacific captured 45.10% revenue share in 2025 and will rise at a 6.05% CAGR to 2031.
Note: Market size and forecast figures in this report are generated using Mordor Intelligence’s proprietary estimation framework, updated with the latest available data and insights as of 2026.
Global Machine Tools Market Trends and Insights
Driver Impact Analysis*
| Driver | % Impact on CAGR Forecast | Geographic Relevance | Impact Timeline |
|---|---|---|---|
| Electrification Surge Driving Precision e-Powertrain Machining | +0.8% | Global, with concentration in China, Germany, US | Medium term (2-4 years) |
| Semiconductor Fab Expansion Necessitating Ultra-Precision Equipment | +0.7% | APAC core, spill-over to US Southwest | Long term (≥ 4 years) |
| Industry 4.0 Adoption Boosting Demand for Smart CNC Platforms | +0.6% | North America & EU, expanding to APAC | Long term (≥ 4 years) |
| Lightweight Alloy & Composite Uptake Requiring High-Speed Multi-Axis Tools | +0.5% | Aerospace hubs: US, EU, emerging in India | Medium term (2-4 years) |
| Source: Mordor Intelligence | |||


Electrification Surge Driving Precision e-Powertrain Machining
Electric-vehicle motor plants are pushing tolerances to micro-scale ranges, often pairing automated stator insertion and hairpin winding with five-axis machining centers that eliminate secondary finishing steps. ZF targets 70% automation for EV drive-train lines by 2030, and Chinese suppliers project annual output exceeding 120 million e-motors by 2034. General Motors and Mercedes-Benz have both insourced e-motor housing production, favouring machines that cut aluminum-silicon alloys without creating pass-off chatter. Demand is intensifying for in-process gauging, coolant management, and closed-loop compensation to suppress electromagnetic noise that would otherwise arise from micron-level form errors.
Semiconductor Fab Expansion Necessitating Ultra-Precision Equipment
Global 300 mm fab spending is forecast to hit USD 137 billion in 2027, with the Americas doubling outlays in three years. ASML’s multi-ton projection optics require diamond-turning and air-bearing grinding systems that hold sub-50 nm form error over 1 m travel. TSMC’s USD 165 billion Arizona complex exemplifies how sovereign chip programs create local pull for ultraprecision machine shops that can keep heavy components in-state during assembly. Clean-room compatibility, hydrostatic slideways, and contamination-free lubrication schemes are now baseline specifications for equipment makers serving this niche.
Industry 4.0 Adoption Boosting Demand for Smart CNC Platforms
Machine builders are embedding adaptive control and digital twin software directly into new models. Siemens’ MACHINUM suite reports double-digit reductions in tool wear, while Haas Automation’s MyHaas cloud links spindle data, probe offsets, and maintenance logs in real time. TRUMPF’s AI-assisted laser equipment demonstrates similar gains, signaling a shift from isolated CNC controllers toward network-native machining cells. These capabilities lower programming barriers, shorten first-article approval times, and unlock predictive scheduling based on live energy tariffs.
Lightweight Alloy & Composite Uptake Requiring High-Speed Multi-Axis Tools
Aerospace primes are designing components around titanium aluminide and carbon-fibre reinforced polymers, both of which generate high heat and rapid tool wear when cut on legacy machines. Challenge Machine’s five-axis cells with automatic pallet changers achieved 15% sales growth after demonstrating unattended rough-to-finish milling of thin-walled jet-engine casings. Demand for through-spindle cryogenic cooling and vibration-damped toolholders is driving retrofit activity across first-tier suppliers. Medical-device OEMs mirror these requirements, insisting on surface finishes that prevent biofilm formation and flash corrosion.
Restraints Impact Analysis*
| Restraint | (~) % Impact on CAGR Forecast | Geographic Relevance | Impact Timeline |
|---|---|---|---|
| High capex and lengthy payback for advanced CNC | -0.6% | Global, pronounced in cost-sensitive markets | Medium term (2-4 years) |
| Surging specialty steel & linear-motion costs | -0.4% | Global, acute in steel-dependent regions | Short term (≤ 2 years) |
| Source: Mordor Intelligence | |||
High Capex & Lengthy Payback for Advanced CNC Systems
Atlanta Fed surveys reveal that 80% of manufacturers weigh interest rates heavily before committing to capital equipment, a dynamic amplified by prime-rate increases in 2025. A top-tier five-axis cell can exceed USD 3 million installed, pushing breakeven past five years for medium-volume job shops. Equipment-as-a-service contracts are emerging as an interim solution, though many CFOs remain wary of residual value risk once software upgrades render early-generation controllers obsolete.
Surging Specialty Steel & Linear-Motion Component Costs
World Bank indices show metals pricing climbing 9% year-on-year, with precision ball screws and guideways seeing the steepest hikes amid tungsten export controls from China[2]World Bank, “Metals and Minerals Price Index Update,” worldbank.org. OEMs are absorbing higher bills of materials or postponing new-model introductions, driving up lead times for standard horizontal machining centers. Several European builders report double ordering of critical components to hedge against logistics delays, a strategy that ties up working capital and elevates final equipment quotes.
*Our forecasts treat driver/restraint impacts as directional, not additive. The impact forecasts reflect baseline growth, mix effects, and variable interactions.
Segment Analysis
By Product Type – Multi-Axis Centers Lead Innovation Drive
The multi-axis segment started 2026 commanding USD 26.29 billion of the machine tools market size and is heading toward a 6.88% CAGR to 2031. Milling machines retain the biggest revenue pool with 28.05% share in 2025, yet growth now concentrates on simultaneous five-axis platforms that finish complex housings in one clamp. Automakers replacing ICE cylinder-block lines with e-drive casing cells embrace multi-axis machines to lower floor-space and handling costs. Aerospace primes add high-torque tilt-spindle centres to mill titanium spars while maintaining 0.015 mm flatness over 1.2 m lengths. Toolroom operators still rely on three-axis knee mills, but retrofit kits with digital readouts and probing keep them competitive for maintenance work.
Demand for laser cutting systems is rebounding as AI-guided parameter wizards reduce scrap rates on thin-gauge stainless. Electrical-discharge machining maintains a niche in tool-and-die cavities that require micro-corner radii which mills cannot reach economically. Hybrid machines that mix directed-energy deposition with finish milling are entering prototype labs where cycle-time savings outweigh equipment cost. Plasma and waterjet platforms serve heavy-fabrication yards; however, both are starting to integrate closed-loop height control to maintain cut quality on warped plates.


By Technology – CNC Dominance Accelerates Through AI Integration
CNC platforms represented 68.55% revenue in 2025 and will climb at 6.08% CAGR, solidifying their position at the heart of the machine tools market. Emerging controllers employ GPU-accelerated algorithmsthat translate STEP files directly to optimized toolpaths, slashing programming time for short-run parts. China’s First Automation secured nearly RMB 100 million to localize servo drives and PLC stacks, highlighting strategic efforts to de-risk foreign firmware dependencies. Conventional manual machines endure in small workshops and vocational schools, yet new builds are trending toward servo-ready frames even when purchased without controls, anticipating future retrofits. Hybrid additive-subtractive systems occupy the cutting edge, combining laser metal deposition with five-axis milling to eliminate support-structure removal steps in aerospace brackets.
Digital twins now simulate tool deflection and thermal drift, allowing off-machine validation that prevents collision during first-article runs. ChatCNC™ plug-ins recognise prismatic features and auto-generate rough-to-finish sequences, enabling less-experienced programmers to achieve veteran-level cycle times. Predictive analytics platforms flag spindle anomalies well before catastrophic failure, an especially valuable feature for lights-out processing where operator oversight is minimal.
By End-User Industry – Aerospace Overtakes Traditional Automotive Growth
Automotive kept its grip on 35.10% of 2025 revenue, yet the sector is in transition as internal-combustion machining contracts sunset alongside EV drivetrain ramp-ups. Aerospace & defence will post the fastest 6.62% CAGR thanks to pent-up jetliner demand and record defence modernisation budgets. GE Aerospace allocated USD 650 million in 2024 for new component lines that require five-axis blisk milling, fibre-optic in-cycle inspection, and adaptive tool compensation. Electrical & electronics manufacturers are expanding clean-room machining to support plasma-etch chamber parts, while medical-device firms specify 6,000 rpm grinding spindles for cobalt-chrome knee implants.
Industrial machinery OEMs seek modular machining cells that flex between prototype and series production without costly re-validation. Shipbuilding and marine yards, subject to cyclical naval funding, demand large-envelope gantry mills that can handle 15-m propeller blades with contour accuracy better than 0.3 mm. Wind-tower hubs and gearbox housings meanwhile add volume in the energy segment, pushing machine builders to develop hydrostatic-guided horizontals capable of 30-ton table loads.
By Sales Channel – Digital Disruption Accelerates Direct Engagement
Direct engagement generated 55.20% of the machine tools market size in 2025 because complex quotations often mandate on-site time studies and fixture concept reviews. Nonetheless, web-based tender portals now list mid-range CNC lathes complete with financing calculators, compressing deal cycles from months to weeks. Younger procurement teams favour online specification configurators that compare spindle power, axis acceleration, and IoT options side-by-side, thereby eroding dealer exclusivity. E-commerce-driven revenue is climbing at 7.74% CAGR as pandemic-born remote-demo tools become standard practice.
Dealers respond by bundling tool management, coolant supply, and operator training to safeguard margins. Subscription models that charge per spindle hour appeal to job shops coping with lumpy contract loads, shifting capex to predictable opex. TRUMPF’s remote operations centre solved half of reported U.S. laser-machine downtimes within 15 minutes during an unmanned night shift trial. System integrators are also profiting; they design turnkey cells combining robots, conveyors, and vision systems, reducing OEM risk and ensuring accountability for takt-time commitments.
Geography Analysis
Asia-Pacific Leads Amid Strategic Shifts, While North America Reshores and Europe Innovates Through Headwinds. Asia-Pacific entered 2026 with 45.10% of global revenue and a 6.05% CAGR outlook as governments funnel incentives into EV, aerospace, and semiconductor clusters. China is upgrading small-batch workshops into high-end CNC cell factories to offset looming 25% U.S. tariffs on mid-range machinery. India’s production-linked incentive program is steering capital toward 300 mm wafer fabs and defence airframe work, generating orders for precision horizontals and vertical machining centres. Japan leverages decades of motion-control know-how to export ultra-precision grinders that hold sub-micron repeatability across multi-shift duty cycles, while South Korea’s consumer-electronics conglomerates invest in machining capacity for foldable-phone hinge plates and camera modules. ASEAN nations such as Vietnam and Thailand gain share as OEMs adopt a China-plus-one sourcing model that values geographic risk dispersion.
North America benefits from reshoring policies aimed at rebuilding strategic manufacturing self-reliance. United States consumption reached its highest 11.9% share since 2001 as regional tool builders added capacity for large-format vertical lathes used in space-launch structures. Mexico’s 9.1% uptick stems from near-shore vehicle assembly, with state-backed industrial parks in Nuevo León offering 24-hour permit approvals. Canada draws machine-tool orders from the mining sector and low-carbon energy projects, though overall momentum is tempered by skilled-labour shortages, a constraint echoed across the entire continent.
Europe faces margin erosion from elevated electricity costs and currency volatility, yet it preserves a commanding lead in high-accuracy five-axis and laser-metal-deposition systems. German builders are responding to soft domestic orders by pushing into after-sales contracts and retrofits, including spindle-exchange programmes that guarantee 48-hour turnaround. TRUMPF invested EUR 530 million in R&D during 2025 to maintain its edge in beam-source efficiency despite a 9% revenue dip. Nordic firms highlight sustainability leadership by offering carbon-footprint certificates with each new machine shipment, a feature increasingly mandated in public-sector tenders.

Competitive Landscape
Competitive Landscape
The competitive arena mixes century-old incumbents and digital-native challengers, producing moderate fragmentation yet intense rivalry on software and service dimensions. Yamazaki Mazak, DMG MORI, and TRUMPF continue to command premium price points through global support networks and proprietary control stacks. Sandvik’s 2025 buyout of CNC Software Inc. (Mastercam) confirms a vertical integration playbook that links CAM expertise directly to cutting-tool portfolios, tightening customer lock-in and shortening feedback loops for insert development. United Grinding’s agreement to purchase GF Machining Solutions will consolidate electro-discharge and laser-texturing know-how under one roof, creating a multi-process powerhouse aimed at aerospace engine manufacturers.
Emerging Chinese brands pose a volume-driven threat in mid-spec vertical machining centres, frequently bundling in-house IoT dashboards at no extra cost. Western OEMs answer by shipping machines pre-configured with OPC-UA connectors that mesh with factory-wide MES platforms, reducing integration overhead. Predictive-maintenance subscription tiers, now standard on high-speed grinders, guarantee uptime percentages in return for semi-annual fee schedules. Remote support continues to differentiate premium suppliers; TRUMPF’s video-diagnostic solution replicates factory-acceptance tests online, letting customers approve final cutting parameters without transoceanic travel.
White-space opportunities revolve around AI-driven programming aids, lights-out pallet systems, and hybrid manufacturing centres that alter supply-chain economics by combining additive and subtractive processes in one envelope. Early adopters report 30% reduction in part count when topology-optimized brackets are printed, stress-relieved, and finish-milled in a single setup. As geopolitical restrictions persist, component localisation becomes a selling point; builders able to source 70% of subassemblies domestically gain preferential financing from state-owned banks.
Machine Tools Industry Leaders
TRUMPF Group
DMG Mori Seiki Co., Ltd
Yamazaki Mazak Corporation
JTEKT Corporation
Doosan Machine Tools
- *Disclaimer: Major Players sorted in no particular order

Recent Industry Developments
- May 2025: TRUMPF Inc. opens a smart factory in Connecticut that showcases fully networked sheet-metal fabrication workflows.
- April 2025: InCompass acquires Bridgeport Machine Tool Company, expanding its vertical-milling product line and aftermarket parts catalogue.
- March 2025: Mastercam completes eight acquisitions in 2025, adding CAD/CAM resellers and probing technology to deepen its CAM ecosystem.
- February 2025: AMETEK Inc. purchases Kern Microtechnik to bolster its ultra-precision machining and optical inspection division.


Research Methodology Framework and Report Scope
Market Definitions and Key Coverage
Our study defines the machine-tools market as all new, factory-built equipment that shapes metal or other rigid materials through cutting, forming, drilling, grinding, additive-hybrid, or multi-axis operations. Systems sold as integrated CNC cells are counted within the same value pool. According to Mordor Intelligence, revenues tied to aftermarket services, software-only upgrades, and used or refurbished units sit outside this scope.
Scope Exclusion: pre-owned machinery and stand-alone CAM software are not valued.
Segmentation Overview
- By Product
- Metal Cutting Tools
- Milling Machines
- Drilling Machines
- Turning (Lathe) Machines
- Grinding Machines
- Laser Cutting Machines
- Electrical Discharge Machines (EDM)
- Waterjet Cutting Machines
- Plasma Cutting Machines
- Multi-Axis Machining Centres
- Others (Boring, etc.)
- Metal Forming Tools
- Presses (Mechanical, Hydraulic, Servo)
- Forging Machines
- Bending Machines
- Others (Shearing, Extrusion, Rolling, etc.)
- Metal Cutting Tools
- By Technology
- Conventional Machines (Manually or Semi-Manually)
- CNC Machines
- Additive Manufacturing / Hybrid Machines
- By End-User Industry
- Automotive
- Aerospace & Defence
- Electrical & Electronics
- Industrial Machinery & Equipment
- Medical Devices
- Shipbuilding & Marine
- Precision Engineering
- Energy & Power
- Metal Fabrication (Job Shops, etc.)
- Other Industries (Railway, Other General Manufacturing, etc.)
- By Sales Channel
- Direct Sales (OEMs to End Users)
- Dealers & Distributors
- Online / E-commerce
- Others (System Integrators, Events & Exhibitions, Rebuilders & Refurbished, etc.)
- By Geography
- North America
- United States
- Canada
- Mexico
- South America
- Brazil
- Argentina
- Peru
- Rest of South America
- Europe
- United Kingdom
- Germany
- France
- Italy
- Spain
- BENELUX (Belgium, Netherlands, and Luxembourg)
- NORDICS (Denmark, Finland, Iceland, Norway, and Sweden)
- Rest of Europe
- Asia-Pacific
- China
- India
- Japan
- Australia
- South Korea
- ASEAN (Indonesia, Thailand, Philippines, Malaysia, Vietnam)
- Rest of Asia-Pacific
- Middle East and Africa
- Saudi Arabia
- United Arab Emirates
- Qatar
- Kuwait
- Turkey
- Egypt
- South Africa
- Nigeria
- Rest of Middle East and Africa
- North America
Detailed Research Methodology and Data Validation
Primary Research
Mordor analysts interviewed machine-tool builders, tier-one automotive and aerospace buyers, regional dealer principals, and tooling fluid suppliers across Asia-Pacific, Europe, and North America. These conversations confirmed CNC penetration rates, lead-time shifts, and discount practices, letting us ground secondary clues in lived operator experience.
Desk Research
We began with authoritative public datasets such as UN Comtrade shipment codes, the United Nations Industrial Production Index, and national machine-tool builder associations (JMTBA, CECIMO, AMT) to size new unit flows and average selling prices. Company 10-Ks, investor decks, and procurement portals then helped us benchmark pricing windows across milling, turning, and laser systems.
To refine regional splits, our team sifted through customs manifests on Volza, quarterly trade bulletins from Eurostat, and patents logged on Questel for emerging hybrid designs. Paid feeds from D&B Hoovers and Dow Jones Factiva supplemented peer-group financials and order backlogs. The sources listed illustrate our approach; many additional references were reviewed for validation, clarification, and context.
Market-Sizing & Forecasting
We reconstruct the global value using a top-down framework that scales production and trade data to end-market consumption, then cross-checks totals with sampled ASP × new-unit deliveries for key machine families before minor adjustments. Variables tested in our multivariate regression include national manufacturing PMI, automotive capital-expenditure outlays, CNC penetration, cutting-fluid consumption, average spindle horsepower, and export rebate policy shifts. Scenario analysis around reshoring and EV drivetrain adoption shapes the 2025-2030 outlook, while bottom-up supplier roll-ups plug data gaps for niche segments such as additive-hybrid cells.
Data Validation & Update Cycle
Outputs pass a three-layer review: automated variance scans, peer review among sector specialists, and a final sign-off by a senior editor. Mordor Intelligence refreshes each model annually, with mid-cycle updates triggered by material events (for instance, tariff changes or large aerospace order books). A fresh accuracy sweep precedes every client delivery.
Why Our Machine Tools Baseline Commands Trust
Published numbers often diverge because firms choose different product mixes, valuation bases, and update rhythms. We anchor our baseline on new-build shipments only, apply uniform ASP ladders, and revisit elasticities every twelve months.
Key gap drivers include: some publishers fold in used equipment, several exclude forming presses, and a few project aggressive automation CAGRs without reconciling current CNC install density. Mordor's disciplined scope, annual refresh cadence, and dual-path validation give decision-makers a balanced starting point.
Benchmark comparison
| Market Size | Anonymized source | Primary gap driver |
|---|---|---|
| USD 108.47 B (2025) | Mordor Intelligence | |
| USD 97.93 B (2024) | Regional Consultancy A | excludes presses and hybrid additive cells; older base year |
| USD 81.09 B (2025) | Trade Journal B | narrow geographic sample and uses list prices without dealer discounts |
| USD 125.75 B (2024) | Global Consultancy C | includes refurbished units and bundled service contracts |
In sum, Mordor's methodology yields a transparent, reproducible baseline tied to clear variables and a repeatable audit trail, equipping stakeholders with numbers they can explain in one slide and defend in one meeting.


Key Questions Answered in the Report
How large is the machine tools market in 2026?
The Machine Tools Market size is expected to reach USD 112.03 billion in 2026 and grow at a CAGR of 3.28% to reach USD 131.63 billion by 2031.
Which product segment is expanding the fastest?
Multi-axis machining centers are expected to grow at a 6.88% CAGR between 2026 and 2031, the highest among all product categories.
Why is aerospace demand outpacing automotive growth in this market?
Aerospace & defence programs need high-speed, multi-axis machining for titanium and composite parts, pushing their segment to a 6.62% CAGR versus a mature automotive base.
How is Industry 4.0 reshaping machine tool purchasing decisions?
AI-enabled CNC controls, digital twins, and predictive maintenance services are becoming standard, turning machines into connected assets that provide real-time performance data.
What role do online sales channels play in equipment procurement?
E-commerce platforms now grow at an 7.74% CAGR, offering configuration tools and financing calculators that shorten buying cycles for mid-range CNC models.
Which regions are most attractive for new machine tool investments?
Asia-Pacific leads with 45.10% revenue share and a 6.05% CAGR, while North America is buoyed by reshoring incentives and semiconductor factory construction.
Page last updated on:


