Cutting Equipment Market Size and Share
Market Overview
| Study Period | 2020 - 2031 |
|---|---|
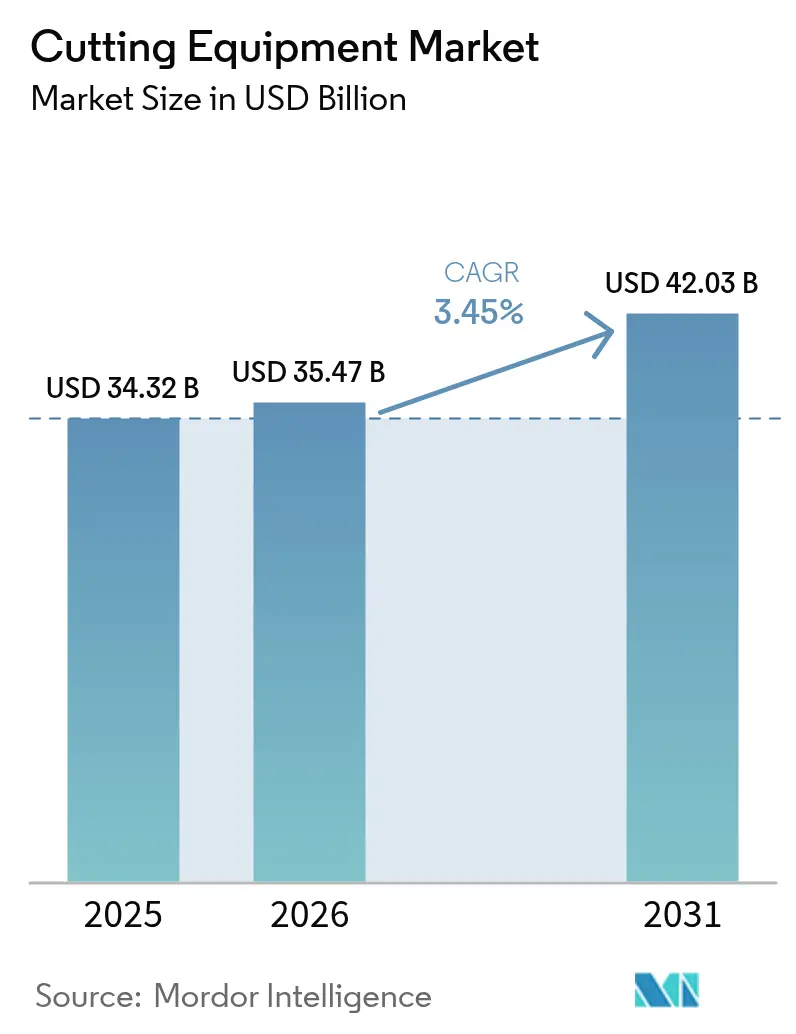
| Market Size (2026) | USD 35.47 Billion |
| Market Size (2031) | USD 42.03 Billion |
| Growth Rate (2026 - 2031) | 3.45% CAGR |
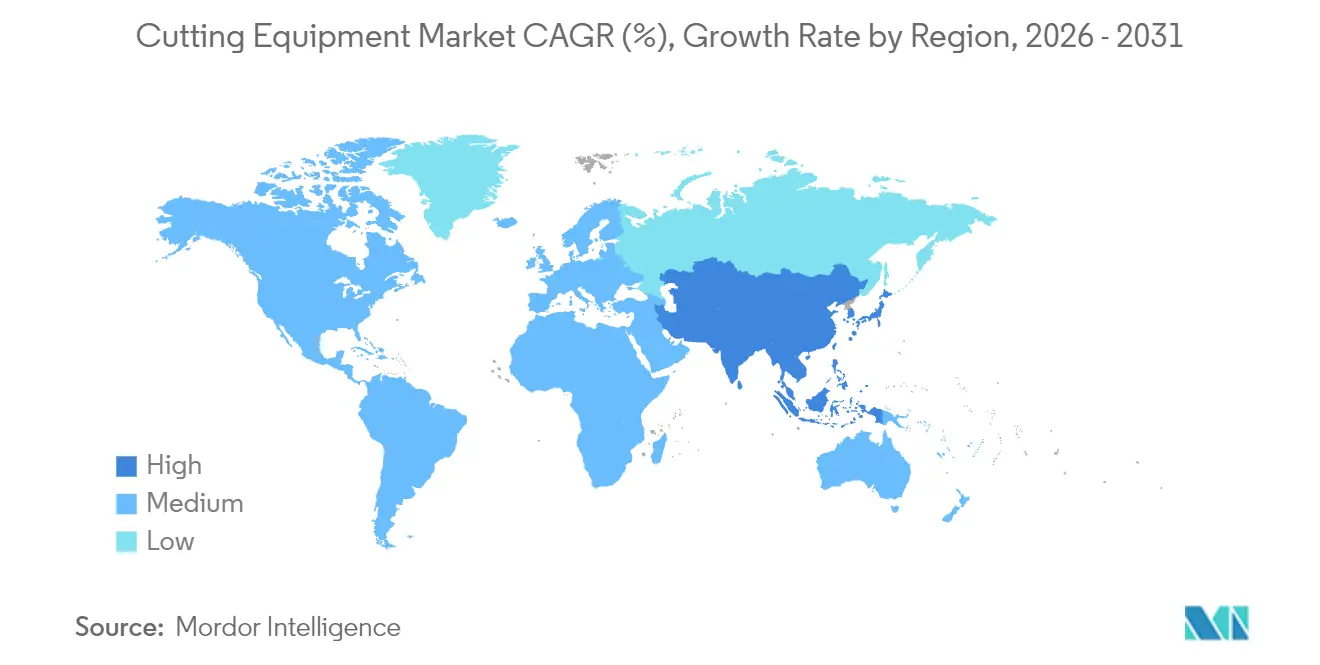
| Fastest Growing Market | Asia-Pacific |
| Largest Market | Asia Pacific |
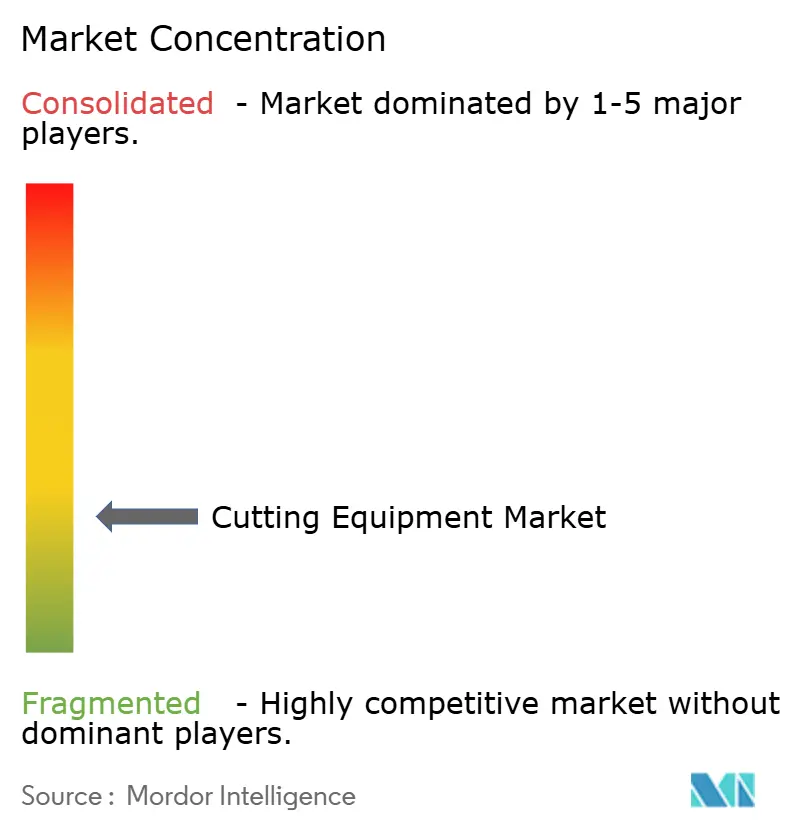
| Market Concentration | Low |
Major Players *Disclaimer: Major Players sorted in no particular order Image © Mordor Intelligence. Reuse requires attribution under CC BY 4.0. | |
Cutting Equipment Market Analysis by Mordor Intelligence
The Cutting Equipment Market size is projected to expand from USD 34.32 billion in 2025 and USD 35.47 billion in 2026 to USD 42.03 billion by 2031, registering a CAGR of 3.45% between 2026 to 2031.
Growing preference for fiber-laser machines that convert more than 50% of wall-plug power into photons is reshaping investment priorities, while robotic cells equipped with generative-AI computer-aided manufacturing (CAM) software help fabricators cope with chronic labor shortages. Asia-Pacific remains the epicenter of demand as EV gigafactories, naval shipyards, and infrastructure projects accelerate capital outlays on high-definition plasma, water-jet, and 30 kW fiber systems. Sustainability policies such as the European Union’s Carbon Border Adjustment Mechanism (CBAM) reward nitrogen-shielded laser platforms that cut embedded-carbon intensity by 40% per linear meter. At the same time, volatile electricity tariffs in Germany and California squeeze margins for shops running more than 15 kW sources, reinforcing the case for energy-efficient architectures.[1]European Commission, “CBAM Definitive Regime,” europa.eu
Key Report Takeaways
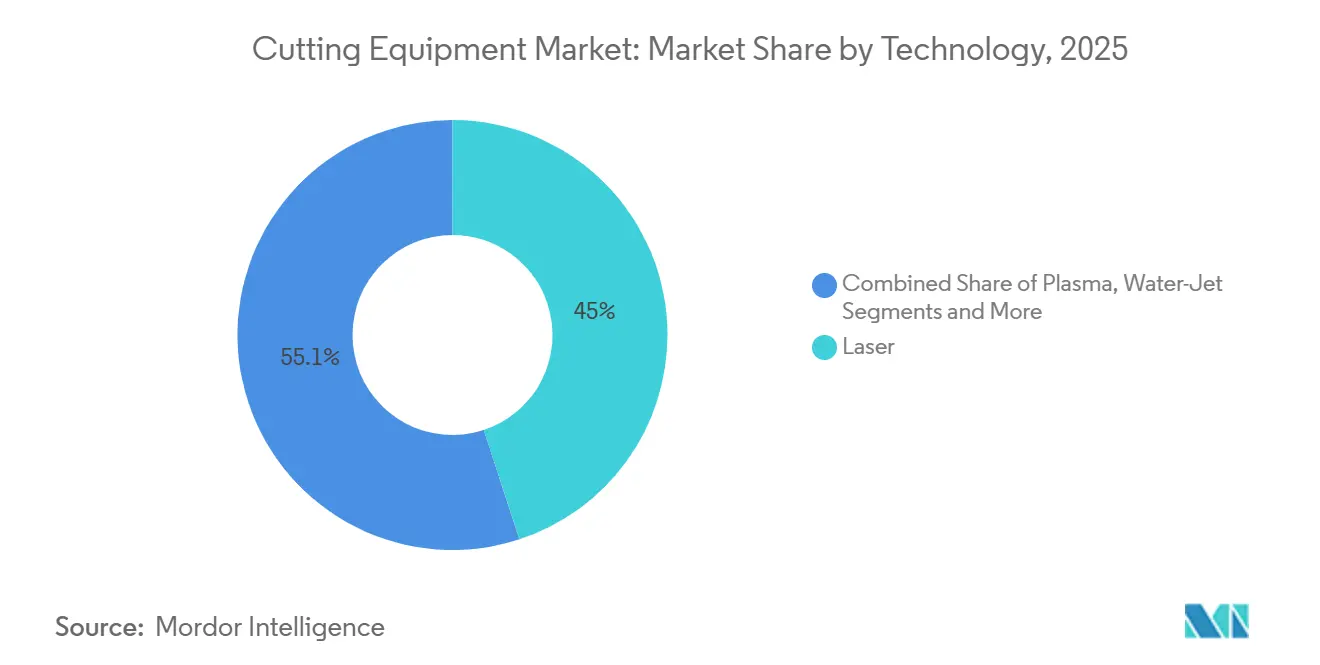
- By technology, laser platforms led with 44.95% of the cutting equipment market share in 2025, while fiber-laser revenue is projected to grow at a 4.85% CAGR to 2031.
- By automation level, semi-automated cells held 41.75% of revenue in 2025; robotic and fully automated cells are the fastest-growing cohort at a 5.01% CAGR through 2031.
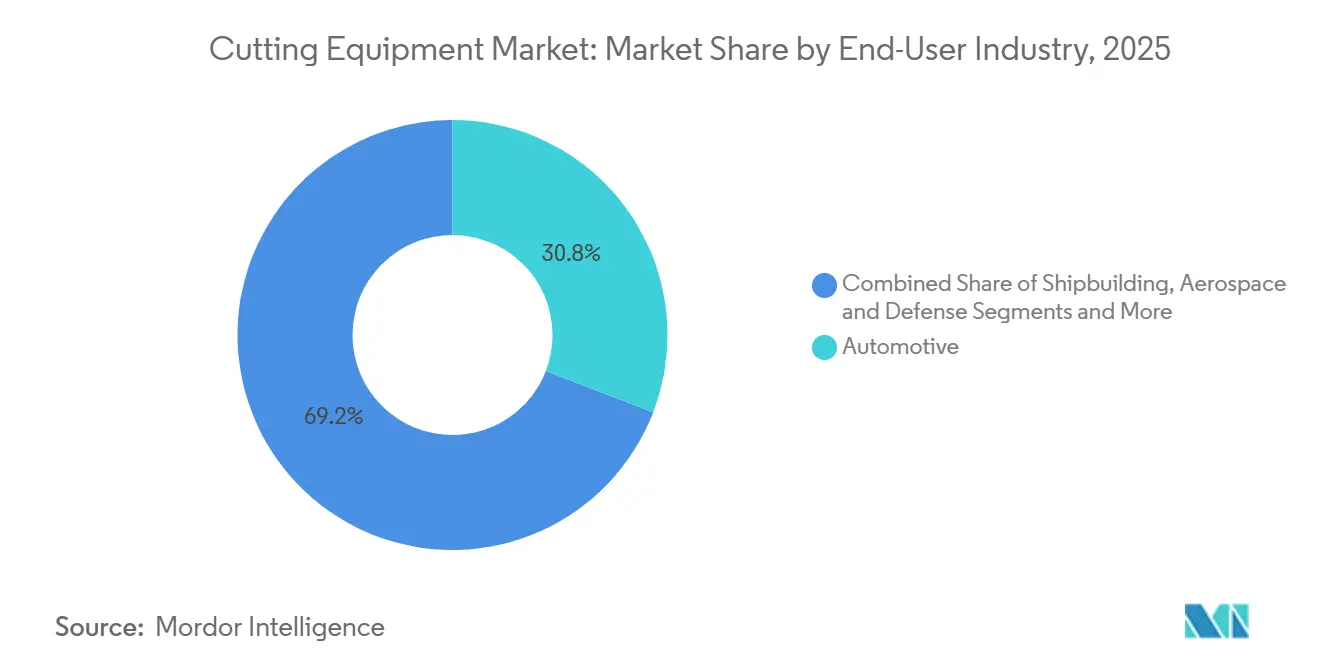
- By end-user industry, automotive retained 30.84% share of the cutting equipment market size in 2025, but electrical and electronics applications are forecast to expand at a 4.38% CAGR up to 2031.
- By material type, ferrous metals comprised 48.17% of 2025 revenue, while polymers, plastics and wood composites are set to rise at a 4.98% CAGR through 2031.
- Asia-Pacific dominated with 48.28% of global revenue in 2025 and is anticipated to log the fastest regional CAGR, at 4.14% over the forecast window.
Note: Market size and forecast figures in this report are generated using Mordor Intelligence’s proprietary estimation framework, updated with the latest available data and insights as of 2026.
Global Cutting Equipment Market Trends and Insights
Drivers Impact Analysis*
| Drivers | (~) % Impact on CAGR Forecast | Geographic Relevance | Impact Timeline |
|---|---|---|---|
| Additive–subtractive hybrid manufacturing scale-up demanding precise post-print finishing | +0.6% | North America, Europe, Asia-Pacific | Medium term (2-4 years) |
| Net-zero steel and aluminum initiatives driving uptake of low-dross, nitrogen-shielded high-power lasers | +0.5% | Global (EU, North America, China) | Long term (≥ 4 years) |
| Global defense and shipbuilding rearmament cycle boosting thick-plate cutting-system orders | +0.5% | North America, Europe, Asia-Pacific, Middle East | Medium term (2-4 years) |
| On-shore wind-blade circular-economy mandates creating large-scale composite-sectioning demand | +0.4% | Europe, North America, Asia-Pacific | Long term (≥ 4 years) |
| Sustainability mandates accelerating adoption of energy-efficient fiber lasers | +0.4% | Global | Medium term (2-4 years) |
| Gigafactory and hydrogen-electrolyzer plate-demand spike | +0.4% | Asia-Pacific, Europe, North America | Short term (≤ 2 years) |
| Source: Mordor Intelligence | |||


Additive–Subtractive Hybrid Manufacturing Scale-Up Demanding Precise Post-Print Finishing
Hybrid platforms that merge metal additive manufacturing (AM) with five-axis milling shipped 35% more units in 2025 versus 2024, as aerospace primes compressed turbine-blade refurbishment cycles by 60% with DMG MORI’s LASERTEC 125 3D system. Powder-bed fusion and directed-energy deposition still leave surface roughness above 1.6 µm, so ultra-precision cutters, adaptive fixtures, and real-time metrology are indispensable for trim and drill tasks. Generative-AI CAM packages from Siemens NX interpret in-situ laser-scan data and autopopulate collision-free toolpaths, cutting programming time from days to hours. As AM adoption spreads from prototypes to serial production, every installed hybrid cell pulls through incremental demand for cutting heads, spindle upgrades, and vacuum work-holding. Vendors that bundle post-print finishing with predictive analytics can command service premiums and lock in multiyear maintenance contracts.
Net-Zero Steel and Aluminum Initiatives Driving Uptake of Low-Dross, Nitrogen-Shielded High-Power Lasers
Steelmakers under the EU CBAM now price carbon at the border, catalyzing a shift to 12 kW to 30 kW fiber lasers that pair with nitrogen at 20 bar and shave 28% off energy consumption per linear meter of cut when compared with legacy CO₂ units. ArcelorMittal’s XCarb low-carbon plate and Hydro’s REDUXA aluminum already carry premiums of 5%-8%, so fabricators capture margin by deploying lasers that leave oxide-free edges and eliminate secondary deburring. ISO 14067 footprint certification is becoming a contract prerequisite among Tier 1 automotive suppliers, reinforcing laser dominance in both ferrous and non-ferrous processing. As global net-zero targets tighten, retrofit demand for gas-recovery skids and nitrogen-generation modules is also rising, broadening the revenue base beyond optics and resonators.
Global Defense and Shipbuilding Rearmament Cycle Boosting Thick-Plate Cutting-System Orders
The U.S. Navy budgeted USD 29.2 billion for shipbuilding in 2025, driving multi-torch plasma table orders that bevel 50 mm armor-grade steel at 500 mm/min, while India earmarked USD 6.2 billion for indigenous yards servicing frigate and submarine programs. Hypertherm’s XPR300 achieves 1,800 starts per consumable set, slashing per-part cost by 22%. Australia’s AUKUS partnership and NATO fleet renewals further extend demand visibility to 2028. Water-jet systems that section reactor-compartment shielding without thermal stress complement plasma cells, enlarging the total addressable market for thick-section cutting.[2]U.S. Navy, “FY 2025 Shipbuilding Budget,” navy.mil
On-Shore Wind-Blade Circular-Economy Mandates Creating Large-Scale Composite-Sectioning Demand
Germany and Denmark banned turbine-blade landfill disposal, prompting European recyclers to acquire diamond-wire saws and 60 HP abrasive water-jets that segment 80-meter blades into 2 m modules for cement-kiln co-processing. The DecomBlades project processed 14 blades per month in 2025 using OMAX’s Maxiem platform, recovering 95% of composite mass. As global installed wind capacity exceeds 1,000 GW, blade retirements are forecast to accelerate at an 8% CAGR, sustaining an above-market growth path for heavy-duty composite cutters. Suppliers that integrate automated material handling and abrasive-recycling loops can secure multi-site rollout contracts from turbine Original equipment manufacturer(OEMs).
Restraints Impact Analysis*
| Restraints | (~) % Impact on CAGR Forecast | Geographic Relevance | Impact Timeline |
|---|---|---|---|
| Volatile industrial electricity tariffs squeezing operating margins of >15 kW laser shops | –0.4% | Europe, North America | Short term (≤ 2 years) |
| Semiconductor-grade motion-controller shortages delaying delivery of advanced CNC gantries | –0.3% | Global | Short term (≤ 2 years) |
| EU CBAM carbon tariffs penalizing energy-intensive plasma and flame processes | –0.3% | Europe, export regions | Medium term (2-4 years) |
| Impending PFAS-coolant bans elevating retrofit costs for abrasive water-jet installations | –0.2% | North America, Europe | Medium term (2-4 years) |
| Source: Mordor Intelligence | |||
Volatile Industrial Electricity Tariffs Squeezing Operating Margins of >15 kW Laser Shops
German industrial tariffs averaged USD 0.30 per kWh in Q1 2025, lifting the annual power bill of a 20 kW laser running two shifts to nearly USD 48,000 and eroding gross margin by 8-12 points for contract fabricators. UK and California operators face similar spikes, triggering off-peak scheduling and USD 200,000-plus battery-storage investments. Although fiber lasers halve energy draw versus CO₂ units, their USD 150,000-300,000 price premium pushes payback to four-plus years under price volatility. Some shops sign power-purchase agreements tied to on-site solar or Scandinavian hydro grids, but upfront commitments slow near-term equipment turnover.
Semiconductor-Grade Motion-Controller Shortages Delaying Delivery of Advanced CNC Gantries
Siemens SINUMERIK 840D sl lead times stretched to 38 weeks in mid-2025 after Taiwan Semiconductor Manufacturing Company (TSMC) reallocated capacity to automotive electronic control units. Bystronic and Prima Power carried USD 5-10 million of safety stock, yet still slipped deliveries by up to 14 weeks, straining customer cash flow. The U.S. CHIPS Act will add domestic fab capacity from 2027, but until then, OEMs will pursue dual-source designs or retrofit legacy controllers that lack adaptive-toolpath functions.
*Our forecasts treat driver/restraint impacts as directional, not additive. The impact forecasts reflect baseline growth, mix effects, and variable interactions.
Segment Analysis
By Technology: Fiber Lasers Cement Leadership
Laser platforms captured 44.95% of 2025 revenue, underscoring their status as the cornerstone of the cutting equipment market share. Fiber variants, which alone are forecast to climb at a 4.85% CAGR to 2031, double the wall-plug efficiency of CO₂ designs and run without gas refills or mirror alignments, yielding predictable uptime above 95%. That reliability attracts automotive stamping lines and metal-service centers that benchmark overall equipment effectiveness at more than 80%. CO₂ lasers, once preferred for thick stainless, now cede ground as 30 kW fiber heads slice 25 mm plate at 1,200 mm/min under nitrogen, delivering burr-free edges ready for welding. High-definition plasma retains relevance beyond 50 mm thickness, yet CBAM penalties and nitrogen-shielded laser gains chip away at plasma’s European installed base.
Solid-state disk and slab lasers hang on in copper, brass, and gold cutting thanks to tunable wavelengths that mitigate reflectivity, but falling fiber prices narrow the niche. Abrasive water-jet machines headline composite and heat-sensitive workloads, as evidenced by Flow International’s 45-unit Boeing contract signed in 2025. Meanwhile, ultrafast picosecond sources explored in semiconductor tooling hint at future sub-micron precision, signaling a technology ladder that could unlock incremental layers of the cutting equipment market.


By Automation Level: Robotic Cells Gain Momentum
Semi-automated tables commanded 41.75% of 2025 revenue, a reflection of their cost-to-throughput sweet spot in mixed-batch fabrication. Conversational programming and manual loading satisfy most Tier 2 suppliers, who process 10-100-piece lots and value flexibility over lights-out operation. Nonetheless, robotic and fully automated cells are expanding fastest, at a 5.01% CAGR, because skilled labor remains scarce and wage inflation averaged 4.2% in U.S. manufacturing during 2025. ABB’s IRB 6700 paired with a TRUMPF 15 kW laser cut 400 unique geometries per shift without human intervention, shrinking direct labor 60% and freeing operators for higher-value inspection tasks.
Capital intensity slows adoption, USD 800,000-2 million per cell versus USD 300,000-600,000 for semi-automated platforms, but total cost of ownership evens out by year four under two-shift utilization. Generative-AI CAM now auto-generates collision-free trajectories, trimming integration time from 16 weeks to <8. Predictive-maintenance layers built on vibration and temperature analytics further raise uptime, sealing the economic case as job-shop backlogs lengthen.
By End-User Industry: Electronics Surges Ahead
Automotive applications delivered 30.84% of 2025 demand, the largest slice of the cutting equipment market size, yet electrical and electronics is the fastest riser with a 4.38% CAGR through 2031. Automakers rely on ultrashort-pulse lasers to slit 8 µm copper anodes, improving EV battery energy density, while water-jets finish structural battery packs without thermal distortion. Aerospace customers, including Pratt & Whitney, impose ±0.01 mm tolerances on titanium blades, necessitating adaptive multi-axis heads that sense material spring-back in real time.
Consumer-electronics brands run urban micro-factories to iterate chassis designs overnight, using modular 1 ps cutters inside spaces smaller than a two-car garage. Construction and infrastructure, buoyed by India’s USD 12 billion PLI electronics incentive, still depend heavily on plasma and flame machines for rebar and girders. Medical devices form a small but fast-growing subsegment, as ISO 13485 cleanrooms embrace picosecond lasers for orthopedic-implant finishing.
By Material Type: Polymers and Composites Accelerate
Ferrous metals kept a 48.17% share in 2025, buttressed by automotive body-in-white and building-frame consumption. Fiber lasers dominate thin-gauge carbon steel up to 6 mm, whereas plasma holds sway in 75 mm structural plate, though nitrogen or hydrogen assist gases now replace oxygen to tame oxidation. Non-ferrous metals such as aluminum, titanium, and copper require tuned wavelengths; green (515 nm) fiber lasers now reach 80% absorption on copper busbars, unlocking 3,000 mm/min traverse speeds.
Polymers, plastics, and wood composites are predicted to post a 4.98% CAGR through 2031, outstripping metals as wind-blade recycling, furniture e-commerce, and lightweighting mandates gather pace. Abrasive water-jets operating at 60,000 psi cut 20 mm GFRP laminates for blade recycling at 150 mm/min while reclaiming 95% of mass. In electronics, laser scribing of 0.7 mm Gorilla Glass foldable panels requires picosecond pulses that avoid micro-cracks, a process Corning validated in 2025. As landfill bans proliferate, heavy-duty composite cutters diversify the revenue mix and smooth cyclicality tied to ferrous volumes.
Geography Analysis
Asia-Pacific generated 48.28% of global revenue in 2025 and is projected to grow at a 4.14% CAGR to 2031, anchored by EV battery gigafactories in China, India, and Southeast Asia, along with naval-vessel programs in Australia, Japan, and South Korea. China produced 87,000 domestic laser units in 2025, a 14% uptick, as Han’s Laser and Hymson shipped systems within 48 hours to capture price-sensitive tiers. India’s Production-Linked Incentive scheme attracted USD 12 billion of FDI into Tamil Nadu and Karnataka, triggering the broad adoption of robotic fiber lasers at contract manufacturers. Vietnam’s electronics exports rose 18% in 2025, fueling micro-factory demand for ultrafast cutters that run 24/7 prototyping cycles.[3]MIIT China, “Domestic Laser Equipment Output 2025,” miit.gov.cn
North America and Europe each controlled about 21% of 2025 sales, but differ in growth vectors. The U.S. CHIPS and Science Act, plus the Inflation Reduction Act, underwrote semiconductor and battery plants that purchased multi-million-dollar laser lines; AESC’s USD 2 billion South Carolina gigafactory ordered 24 such platforms in late 2025. Canada leveraged cheap hydroelectricity sub USD 0.08 per kWh to install water-jet systems for CFRP fuselage panels, while Mexico’s auto corridor absorbed 4,200 CNC laser and plasma tables in 2025. In Europe, Germany, France and Italy sustained premium five-axis laser demand, yet Eastern Europe’s cost-competitive fabricators grabbed overflow work. CBAM’s definitive regime propels nitrogen-shielded fiber lasers that emit 40% less scope-2 carbon, allowing compliant shops to command 5-8% price premiums.
South America, the Middle East, and Africa combined for roughly 10% of 2025 turnover but promise greater than 5% CAGR. Brazil’s Embraer scaled CFRP wing cutting, Argentina’s Vaca Muerta basin demanded plasma rigs for pipeline fabrication, and Abu Dhabi’s EDGE Group bought 18 plasma tables for corvette hulls. South Africa’s 20 GW wind-and-solar target spurs structural-steel cutters, while Nigeria’s Dangote Refinery sources plasma systems for on-going maintenance. Grid instability and currency swings temper equipment cycles, yet commodity revenues fund infrastructure that sustains demand momentum.

Competitive Landscape
Competition remains moderate, with the top five vendors such as TRUMPF, Lincoln Electric, ESAB, Bystronic, and Hypertherm commanding roughly 35-40% of 2025 revenue, leaving a long tail of regional players. TRUMPF’s TruConnect IIoT suite networked 1,200 machines in 2025, benchmarking utilization across anonymized fleets and highlighting cycle inefficiencies in real time. Bystronic partnered with Siemens on BySoft Nest AI, slashing material waste up to 18% and compressing programming time to 10 minutes. These software layers deepen switching costs, but success triggers imitation; Lincoln Electric’s 2026 majority stake in India’s Ador Welding instantly added a 200-dealer network, demonstrating that inorganic moves remain vital to expand addressable markets.
Innovation pipelines concentrate on adaptive toolpaths, hybrid additive-subtractive control, and IIoT cyber-security. Patent grants in 2025 rose 22%, with TRUMPF, Siemens, and DMG MORI accounting for 40% of the total. Chinese challengers such as Han’s Laser bundle in-house resonators and motion controllers to undercut Western price points by up to 40% domestically, but U.S. export-control additions to the Entity List complicate overseas expansion. Western incumbents, therefore, double down on service, offering predictive-maintenance subscriptions that anticipate spindle-bearing failure 72 hours in advance, locking customers into high-margin consumables.
Aftermarket revenue eclipses new-equipment growth as installed bases age. Hypertherm’s Pune consumables plant, opened in 2025, trims Asia-Pacific lead times from eight weeks to two, securing share in electrode and nozzle replenishment. IPG Photonics’ Genesis platform bundles a 15 kW source with Siemens SINUMERIK ONE control, cutting programming from eight hours to two and illustrating the premium attached to speed-to-first-part. Overall, vendors that weave hardware, software and service into turnkey packages fortify margins even as base-machine prices face commoditization.[4]U.S. BIS, “Entity List Update 2024,” bis.doc.gov
Cutting Equipment Industry Leaders
TRUMPF SE + Co. KG
Lincoln Electric Holdings, Inc.
ESAB Corp. (ex-Colfax)
Bystronic AG
Hypertherm Associates
- *Disclaimer: Major Players sorted in no particular order

Recent Industry Developments
- February 2026: TRUMPF inaugurated a USD 162 million fiber-laser plant in Schramberg, Germany, doubling capacity to satisfy 12 kW-30 kW demand.
- January 2026: Lincoln Electric bought 60% of India’s Ador Welding for USD 180 million, adding a 200-dealer service network across South Asia.
- December 2025: ESAB introduced the Rebel EMP 320ic portable multi-process cutter-welder, shipping 8,000 units in its first quarter.
- November 2025: Bystronic and Siemens launched BySoft Nest AI, an optimizer that trims material waste by up to 18%.


Global Cutting Equipment Market Report Scope
Cutting equipment is the part of machine tools that are utilized to remove excess material from a workpiece with a cutting medium. These machines are specifically utilized across boring, slotting, and lathe machines. The cutting equipment market is segmented by technology (laser, plasma, waterjet, flame, and others), by end-user (automotive, aerospace and defense, electrical and electronics, construction, and other end users), and by geography (North America, Europe, Asia-Pacific, the Middle East and Africa, and Latin America). The report offers market size and forecasts for Cutting Equipment Market (in USD Billion) for all the above segments.
| Laser | Fiber |
| CO₂ | |
| Solid-state / Other | |
| Plasma | High-definition |
| Conventional | |
| Water-Jet | Abrasive |
| Pure | |
| Flame / Oxy-fuel | |
| Ultrasonic & Emerging |
| Manual |
| Semi-automated |
| Robotic / Fully-automated |
| Automotive |
| Aerospace & Defense |
| Electrical & Electronics |
| Construction & Infrastructure |
| Metal-Fabrication Job Shops |
| Shipbuilding |
| Energy & Power |
| Others (Medical Devices, etc.) |
| Ferrous Metals |
| Non-Ferrous Metals |
| Composites |
| Glass/Ceramics/Stone |
| Others (Polymers/Plastics/Wood, etc.) |
| North America | United States |
| Canada | |
| Mexico | |
| South America | Brazil |
| Argentina | |
| Rest of South America | |
| Europe | United Kingdom |
| Germany | |
| France | |
| Italy | |
| Spain | |
| BENELUX (Belgium, Netherlands, and Luxembourg) | |
| NORDICS (Denmark, Finland, Iceland, Norway, and Sweden) | |
| Rest of Europe | |
| Asia-Pacific | China |
| India | |
| Japan | |
| Australia | |
| South Korea | |
| ASEAN (Indonesia, Thailand, Philippines, Malaysia, Vietnam) | |
| Rest of Asia-Pacific | |
| Middle East and Africa | Saudi Arabia |
| United Arab Emirates | |
| Qatar | |
| Kuwait | |
| Turkey | |
| Egypt | |
| South Africa | |
| Nigeria | |
| Rest of Middle East and Africa |
| By Technology | Laser | Fiber |
| CO₂ | ||
| Solid-state / Other | ||
| Plasma | High-definition | |
| Conventional | ||
| Water-Jet | Abrasive | |
| Pure | ||
| Flame / Oxy-fuel | ||
| Ultrasonic & Emerging | ||
| By Automation Level | Manual | |
| Semi-automated | ||
| Robotic / Fully-automated | ||
| By End-User Industry | Automotive | |
| Aerospace & Defense | ||
| Electrical & Electronics | ||
| Construction & Infrastructure | ||
| Metal-Fabrication Job Shops | ||
| Shipbuilding | ||
| Energy & Power | ||
| Others (Medical Devices, etc.) | ||
| By Material Type | Ferrous Metals | |
| Non-Ferrous Metals | ||
| Composites | ||
| Glass/Ceramics/Stone | ||
| Others (Polymers/Plastics/Wood, etc.) | ||
| By Geography | North America | United States |
| Canada | ||
| Mexico | ||
| South America | Brazil | |
| Argentina | ||
| Rest of South America | ||
| Europe | United Kingdom | |
| Germany | ||
| France | ||
| Italy | ||
| Spain | ||
| BENELUX (Belgium, Netherlands, and Luxembourg) | ||
| NORDICS (Denmark, Finland, Iceland, Norway, and Sweden) | ||
| Rest of Europe | ||
| Asia-Pacific | China | |
| India | ||
| Japan | ||
| Australia | ||
| South Korea | ||
| ASEAN (Indonesia, Thailand, Philippines, Malaysia, Vietnam) | ||
| Rest of Asia-Pacific | ||
| Middle East and Africa | Saudi Arabia | |
| United Arab Emirates | ||
| Qatar | ||
| Kuwait | ||
| Turkey | ||
| Egypt | ||
| South Africa | ||
| Nigeria | ||
| Rest of Middle East and Africa | ||


Key Questions Answered in the Report
How big will the cutting equipment market be by 2031?
It is forecast to reach USD 42.03 billion by 2031, advancing at a 3.45% CAGR from 2026.
Which technology leads current sales?
Laser platforms dominate with 44.95% of revenue in 2025, and fiber lasers are the fastest-growing subsegment.
What region purchases the most cutting machines?
Asia-Pacific generated 48.28% of 2025 revenue and is on track for a 4.14% CAGR to 2031.
Why are fiber lasers replacing CO₂ systems?
They offer more than double the wall-plug efficiency, eliminate gas upkeep and qualify for low-carbon compliance incentives.
How are defense orders shaping demand?
U.S., Indian and Australian shipbuilding budgets are driving high-definition plasma and water-jet purchases for 50 mm-plus armor plate.
What is the key restraint in the next two years?
Volatile electricity tariffs inflate operating costs for more than 15 kW laser shops, delaying fleet upgrades until energy prices stabilize.
Page last updated on:


