Agricultural Inoculants Market Size and Share
Market Overview
| Study Period | 2021 - 2031 |
|---|---|
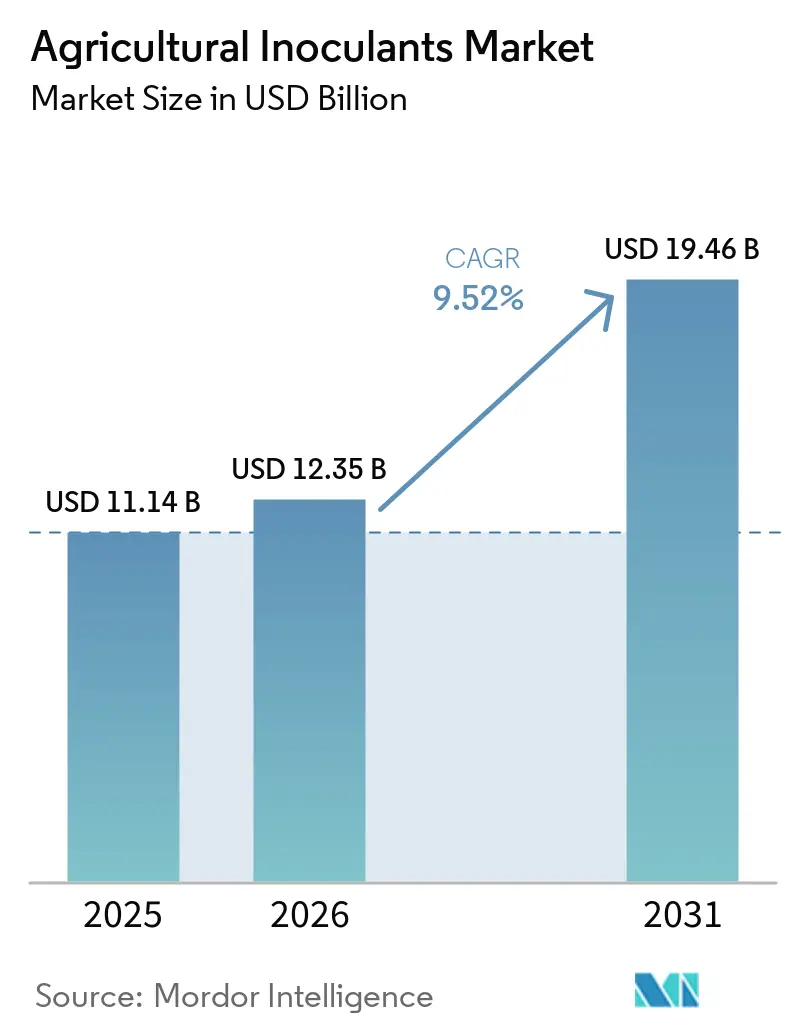
| Market Size (2026) | USD 12.35 Billion |
| Market Size (2031) | USD 19.46 Billion |
| Growth Rate (2026 - 2031) | 9.52% CAGR |
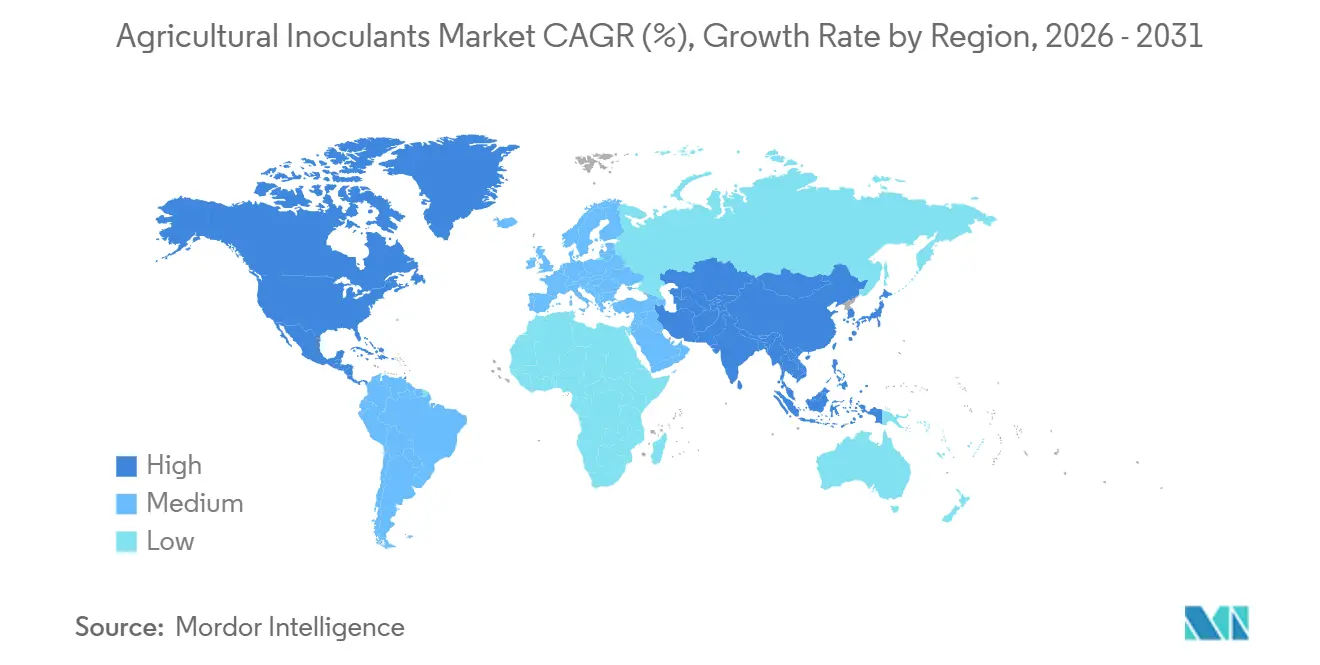
| Fastest Growing Market | Asia Pacific |
| Largest Market | North America |
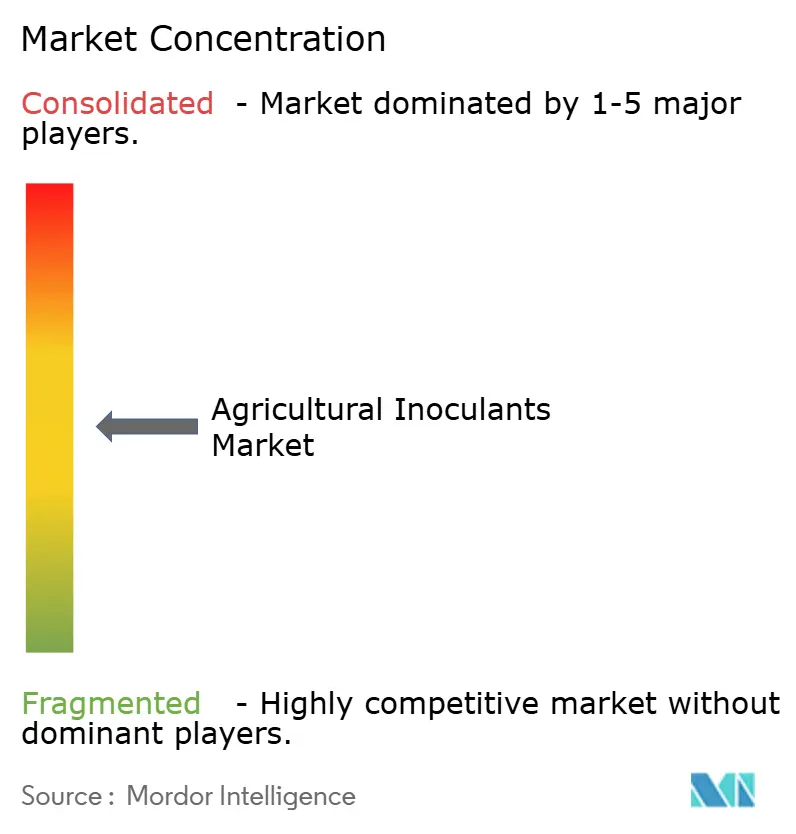
| Market Concentration | Medium |
Major Players
*Disclaimer: Major Players sorted in no particular order Image © Mordor Intelligence. Reuse requires attribution under CC BY 4.0. |
|
Agricultural Inoculants Market Analysis by Mordor Intelligence
The Agricultural inoculants market size is projected to grow from USD 11.14 billion in 2025 to USD 12.35 billion in 2026 and is forecast to reach USD 19.46 billion by 2031 at 9.52% CAGR over 2026-2031. The agricultural inoculants market is supported by a gradual shift in farm economics. Growers in the United States are increasingly adopting biological inputs to manage fertilizer costs and enhance nutrient efficiency. Residue control is gaining importance, particularly for producers supplying export markets and fresh produce chains that face stricter scrutiny on maximum residue limits. Additionally, the market benefits from stronger policy support for biological products, clearer commercialization pathways, and broader retailer acceptance of integrated programs combining microbial and conventional inputs. Competitive dynamics reveal a distinct division between large global companies with extensive manufacturing and distribution capabilities and specialized players focusing on nitrogen fixation, mycorrhiza, or targeted biocontrol solutions. Despite field performance challenges in certain soils and climates, the agricultural inoculants market demonstrates sustained long-term demand driven by rising cost pressures and stricter residue compliance requirements.
Key Report Takeaways
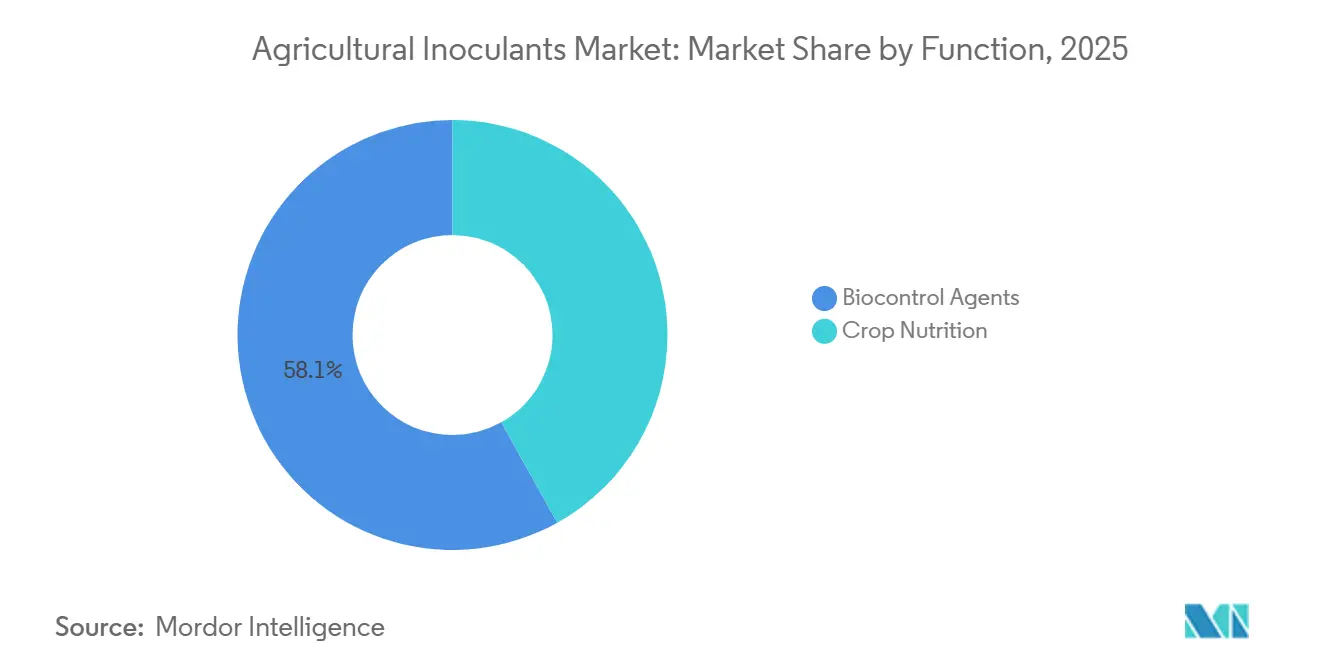
- By function, Biocontrol Agents was the largest segment, accounting for 58.1% of the Agricultural inoculants market share in 2025, while Crop Nutrition was the fastest-growing segment, with a projected 5.1% CAGR through 2031.
- By microorganism, Bacteria were the largest segment, accounting for 43.4% of the agricultural inoculants market size in 2025, while Viruses were the fastest-growing segment, with a projected 8.0% CAGR through 2031.
- By mode of application, Seed Treatment was the largest segment, accounting for 44.7% of the agricultural inoculants market size in 2025, while Foliar Spray was the fastest-growing segment, with a projected 5.7% CAGR through 2031.
- By crop type, Fruits and Vegetables were the largest segment with a 28.7% share in 2025, while Commercial Crops were the fastest segment with a projected 4.6% CAGR through 2031.
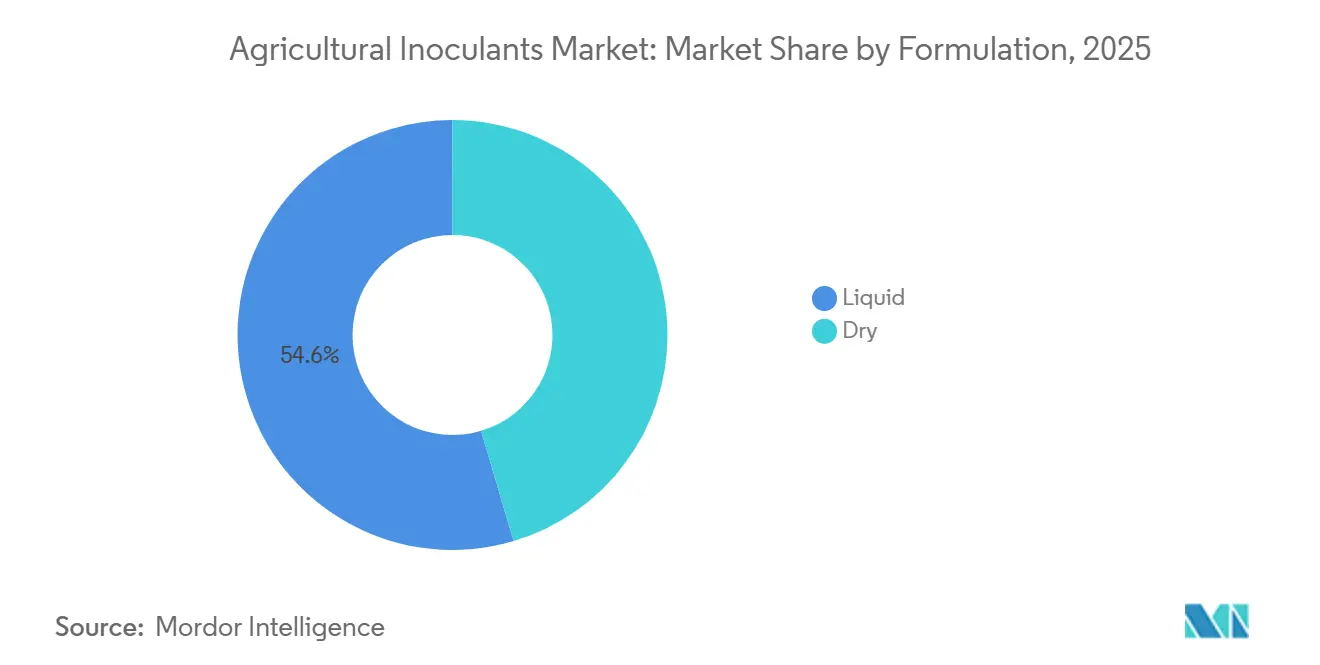
- By formulation, Liquid was the largest segment with a 54.6% share in 2025, while Dry was the fastest segment with a projected 5.5% CAGR through 2031.
- By geography, North America was the largest regional segment with a 32.1% share in 2025, while Asia-Pacific was the fastest regional segment with a projected 6.8% CAGR through 2031.
Note: Market size and forecast figures in this report are generated using Mordor Intelligence’s proprietary estimation framework, updated with the latest available data and insights as of January 2026.
Global Agricultural Inoculants Market Trends and Insights
Drivers Impact Analysis*
| Driver | (~) % Impact on CAGR Forecast | Geographic Relevance | Impact Timeline |
|---|---|---|---|
| Organic acreage expansion and residue-free food demand | +2.3% | Global, with concentrated gains in European Union, North America, and Southeast Asia | Medium term (2-4 years) |
| Biofertilizer adoption to offset synthetic input cost volatility | +1.8% | South America, South Asia, Sub-Saharan Africa | Short term (≤ 2 years) |
| Policy support for biologicals and lower-residue crop protection | +1.5% | European Union, India, Brazil, North America | Medium term (2-4 years) |
| Seed treatment adoption to improve application precision | +1.2% | North America, Europe, Australia | Short term (≤ 2 years) |
| On-farm compatibility demand for integrated biological and chemical solutions | +0.9% | North America, South America, Asia-Pacific core | Medium term (2-4 years) |
| Shelf-life gains from formulation and encapsulation innovations | +0.7% | Global, with near-term gains in Middle East and Africa and South Asia | Long term (≥ 4 years) |
| Source: Mordor Intelligence | |||
Organic Acreage Expansion and Residue-Free Food Demand
The agricultural inoculants market is experiencing growth due to the expansion of organic farming and stricter residue standards in global food supply chains. Consumers in the European Union and North America are increasingly demanding agricultural products with minimal residues, driving the adoption of biological crop inputs. This trend is extending beyond high-value fruits and vegetables to include large-scale field crops. In 2025, the European Commission’s bioeconomy framework identified bio-based fertilizers and biological plant-protection products as strategic priorities, promoting their integration into agricultural sustainability initiatives[1]Source: European Commission, “A Strategic Framework for a Competitive and Sustainable EU Bioeconomy,” European Commission, europa.eu. For growers, positioning products as residue-free enhances market access and ensures pricing stability in compliance-driven sales channels, thereby strengthening the commercial importance of inoculants beyond sustainability-focused applications.
Biofertilizer Adoption to Offset Synthetic Input Cost Volatility
The agricultural inoculants market is also growing as farmers adopt microbial nutrition products to reduce dependence on volatile fertilizer prices and improve nutrient-use efficiency. Instead of completely replacing synthetic fertilizers, many farms are incorporating inoculants to enhance nitrogen fixation and phosphorus uptake within conventional nutrient-management systems. This approach is particularly significant in fertilizer-import-dependent agricultural economies, where input-cost fluctuations can heavily impact farm profitability. A study published in Plants demonstrated that co-inoculation with Bradyrhizobium species and Azospirillum brasilense in certain regions of Brazil's soybean cultivation resulted in significant savings in urea replacement and direct profitability gains. This finding highlights why growers consider these products as effective economic tools. The same study also shows that inoculants are being adopted as part of integrated nutrient programs rather than as simple substitutes for conventional fertilizers. As a result, the Agricultural inoculants market is benefiting from both input cost discipline and better return visibility.
Policy Support for Biologicals and Lower-Residue Crop Protection
Policy support is playing a significant role in the growth of the agricultural inoculants market as governments and regulators establish clearer approval pathways for biological products. Countries such as Brazil, India, and members of the European Union are actively developing regulatory frameworks for biological crop inputs, enhancing commercialization prospects for manufacturers and distributors. The European Commission has also indicated plans to review fertilizer regulations in 2025, which may expand the range of approved microbial products over time. Improved regulatory clarity reduces risks associated with product launches, encourages investment in formulation and manufacturing, and builds confidence among retailers and agronomic advisors by enabling consistent labeling and product claims[2]Source: European Commission, "A Strategic Framework for a Competitive and Sustainable EU Bioeconomy," data.consilium.europa.eu. Consequently, regulations are increasingly acting as market enablers rather than merely compliance barriers.
Seed Treatment Adoption to Improve Application Precision
Seed treatment continues to be a key growth driver for the agricultural inoculants market as it delivers beneficial microorganisms directly to the seed-root interface during early crop development. This method integrates seamlessly with existing industrial seed-processing systems, allowing growers to adopt biological products without significant changes to field equipment or farming operations. In 2025, Research published in the Australian Journal of Crop Science demonstrated that pre-inoculated soybean seeds, treated up to 30 days before sowing, maintained viable bacterial populations and provided yield benefits when used alongside protective formulations and chemical seed treatments. Additionally, companies such as Novonesis A/S are advancing long-life seed-treatment technologies tailored for large-scale commercial seed systems. These developments support the adoption of seed-applied inoculant programs by emphasizing precision, operational simplicity, and compatibility with conventional farming practices.
Restraints Impact Analysis*
| Restraint | (~) % Impact on CAGR Forecast | Geographic Relevance | Impact Timeline |
|---|---|---|---|
| Performance variability across soil and climate conditions | -2.0% | Global, most acute in Middle East and Africa and temperate Europe | Medium term (2-4 years) |
| Farmer preference for fast-acting synthetic alternatives | -1.5% | South Asia, Sub-Saharan Africa, parts of South America | Short term (≤ 2 years) |
| Registration complexity for multi-strain microbial products | -1.2% | European Union, North America, Southeast Asia | Long term (≥ 4 years) |
| Cold-chain and contamination risk in microbe distribution | -0.7% | Middle East and Africa, South Asia, inland South America | Medium term (2-4 years) |
| Source: Mordor Intelligence | |||
Performance Variability Across Soil and Climate Conditions
Performance variability remains a significant challenge for the agricultural inoculants market, as microbial activity is highly dependent on factors such as soil temperature, moisture, pH, crop history, and native microbial populations. Consequently, inoculants often exhibit inconsistent field performance compared to synthetic inputs, particularly in large-scale farming operations and under varying environmental conditions. Industrial microbiology highlights that the efficacy of inoculants remains significantly influenced by environmental conditions, carrier design, and post-application survival conditions. This variability contributes to a trust gap, as growers seek predictable input responses for reliable planning. Without more precise field recommendations, the agricultural inoculants market is likely to continue to face hesitation in regions with climates and soils that yield inconsistent results.
Farmer Preference for Fast-Acting Synthetic Alternatives
The agricultural inoculants market also faces resistance from growers who favor fast-acting synthetic fertilizers and crop-protection products that deliver immediate, visible agronomic results. Biological products often require longer periods to demonstrate measurable benefits, posing adoption challenges in regions where seasonal cash flow constraints and limited agronomic advisory services impact purchasing decisions. To address these issues, companies are increasing their demonstration and distribution efforts. For instance, in 2024, Novonesis A/S partnered with Andermatt Group to expand access to Cell-Tech soybean inoculants in Africa, focusing on grower education and promoting the adoption of biological products[3]Source: Novonesis A/S, “Andermatt and Novonesis Join Hands to Launch Cell-Tech® for Soy Farmers in Africa,” Novonesis, novonesis.com. However, despite these initiatives, the preference for familiar synthetic inputs remains a significant barrier to the broader adoption of inoculants
*Our forecasts treat driver/restraint impacts as directional, not additive. The impact forecasts reflect baseline growth, mix effects, and variable interactions.
Segment Analysis
By Function: Biocontrol Agents Hold the Largest Position while Biostimulants are the Fastest
Biocontrol agents accounted for the largest market share at 58.1% in 2025, making the most significant contribution to the agricultural inoculants market across functional categories. This dominance is attributed to increasing resistance to synthetic pesticides in key pest systems and stricter regulations on certain chemically active ingredients in major crop markets. The agricultural inoculants market continues to rely on biocontrol agents, as they benefit from a well-established commercial infrastructure compared to other biological categories. Companies such as BASF SE, Valent BioSciences LLC, and Koppert Biological Systems B.V. operate in this segment with robust biological pest management portfolios, ensuring global supply capabilities and distributor confidence.
Crop nutrition is the fastest-growing function, projected to expand at a CAGR of 5.1% through 2031. This growth reflects a broader shift in how growers approach nutrient efficiency. In the agricultural inoculants market, biostimulants are increasingly marketed as practical tools for enhancing nutrient uptake and managing stress, rather than as optional plant health supplements. This shift is significant as agronomists can now integrate biostimulants into reduced-rate fertilizer programs, rather than requiring farmers to completely replace conventional systems. In March 2026, BASF SE completed the acquisition of AgBiTech Group, emphasizing the growing focus of major crop input companies on integrating biological technologies into their portfolio strategies and long-term growth plans. Consequently, while mature biocontrol platforms continue to anchor revenue, nutrition-focused products are growing faster in the agricultural inoculants market.


By Microorganism: Bacteria Remain the Largest while Viral Products are the Fastest
Bacteria accounted for the largest market share in 2025, at 43.4%, representing the most significant segment of the agricultural inoculants market by microorganism. This dominance is attributed to the long-standing commercial use of strains such as Bradyrhizobium, Azospirillum brasilense, and Bacillus subtilis, which are utilized for nitrogen fixation, nutrient mobilization, and plant growth enhancement. In the agricultural inoculants market, bacterial products benefit from established registration processes and widespread application in soybean, pulse, and cereal systems. South America plays a critical role in this segment, as rhizobial products are closely linked to legume production and the economic viability of soybean cultivation. While fungal inoculants are also significant, particularly in horticulture and soil-borne disease management, bacteria continue to provide the broadest commercial base across regions.
Viruses represent the fastest-growing segment of microorganisms, with a projected CAGR of 8.0% through 2031. This growth is driven by the increasing adoption of nucleopolyhedrovirus technologies for managing challenging lepidopteran pests. The agricultural inoculants market is focusing more on this segment as advancements in production economics and field validation make virus-based pest control more scalable.
By Mode of Application: Seed Treatment is the Largest while Foliar Spray is the Fastest
Seed treatment accounted for the largest market share at 44.7% in 2025, emerging as the leading application method in the Agricultural Inoculants Market. This method is preferred for its ability to position microbial activity near the seed during the early stages of root development while integrating seamlessly with existing seed processing workflows. In this market, seed treatment reduces field labor requirements and minimizes handling for growers by eliminating the need for on-farm mixing. Furthermore, industrial seed treatment infrastructure ensures consistent dosage and compatibility with conventional seed care products. These advantages make seed treatment the default choice for large row crop systems and regions with established pre-treated seed distribution networks.
Foliar spray is projected to be the fastest-growing application method, with a 5.7% CAGR through 2031. This approach provides growers with greater flexibility throughout the growing season, making it particularly beneficial for crops where nutrient stress, heat stress, or growth-stage timing are critical. The agricultural inoculants market has benefited significantly from this application method. For instance, in March 2026, Biosolutions leader introduced Otimais Duo in Brazil, a dual-microbial inoculant validated across multiple countries and crops. The product demonstrated stronger foliar performance compared to seed treatment, particularly in maize.
By Crop Type: Fruits and Vegetables are the Largest while Commercial Crops are the Fastest
Fruits and vegetables held the largest market share at 28.7% in 2025, contributing the highest value to the agricultural inoculants market by crop type. This dominance is primarily due to their higher value per hectare, which allows for easier cost recovery of biological inputs compared to lower-value field crops. The market benefits from strong residue sensitivity in export channels, where buyers of fresh produce prioritize clean-label, low-residue production practices. As a result, horticulture growers tend to adopt inoculants earlier than those cultivating bulk commodity crops, driven by both agronomic and commercial factors. This has established fruits and vegetables as leaders in adoption within many high-value production systems.
Commercial crops represent the fastest-growing segment, with a projected CAGR of 4.6% through 2031. This growth is driven by the increasing adoption of input-intensive crops such as sugarcane, cotton, and coffee. The agricultural inoculants market in these crops is expanding as buyers demand improved environmental performance, while growers seek solutions to enhance nutrient efficiency and protect profit margins.
By Formulation: Liquid Remains the Largest while Dry is the Fastest
Liquid formulations are projected to hold the largest market share, accounting for 54.6% of the agricultural inoculants market by formulation type in 2025. Their widespread adoption is attributed to manufacturers' ability to maintain stricter sterilization standards, achieve higher viable cell counts, and ensure compatibility with liquid seed treatment and irrigation systems. In particular, liquid products are extensively used in soybean programs in Brazil and Argentina, where existing planning, storage practices, and distributor networks align well with these formats. However, logistics remain a significant challenge, as refrigeration and contamination control are critical during transport and storage. These challenges are especially pronounced in inland areas and warmer regions with limited cold-chain infrastructure.
Dry formulations are the fastest-growing category, with a projected CAGR of 5.5% through 2031. This growth is driven by improvements in shelf life and ease of handling. The agricultural inoculants market is benefiting from advancements in polymer encapsulation, osmoprotectants, and layered carrier systems, which enhance the practicality of dry products in regions with challenging distribution conditions.
Geography Analysis
North America held 32.1% of the agricultural inoculants market share in 2025 and remained the largest regional contributor. Strong retailer networks, advanced agronomic advisory systems, and high adoption across soybean and corn production supported this. The United States continues to lead regional demand as microbial products integrate efficiently with seed treatment, crop protection, and sustainability-focused farming programs. In 2025, Pivot Bio, Inc. further expanded adoption through its N-OVATOR program and broader retail partnerships across the Corn Belt. This reinforced the role of biological inputs in improving both farm productivity and environmental performance.
Asia-Pacific is the fastest regional segment with a projected 6.8% CAGR through 2031. This growth is driven by fertilizer cost pressures, government support for biological inputs, and expanding agronomic extension programs. India remains a key growth market as regulatory formalization improves commercialization standards for biological products. In September 2024, Novonesis A/S strengthened its regional presence through its partnership with Krishak Bharati Cooperative Limited (KRIBHCO) to distribute mycorrhizal biofertilizers across major Indian crops. Australia also supports regional growth by increasing the adoption of precision agriculture.
Europe remains an important market for agricultural inoculants, although growth is partly constrained by current European Union regulations governing microorganisms. Ongoing regulatory reviews by the European Commission may gradually expand the list of approved microbial products. South America continues to be a major growth region, particularly in Brazil, where large-scale soybean cultivation and reliance on fertilizer imports are driving rising demand for biological inputs. The Middle East and Africa remain smaller markets but are attracting increasing industry attention because lower historical adoption leaves room for expansion through new distribution and advisory models, particularly in legume production systems.

Competitive Landscape
The Agricultural inoculants market is moderately consolidated globally, with BASF SE, Syngenta Group Co., Ltd., Corteva, Inc., Bayer AG, and Novonesis A/S benefiting from scale in manufacturing, registration, and distribution. These companies benefit from spreading research investments across broader agricultural portfolios and efficiently commercializing biological products through established crop-input channels. Key competitive advantages for companies aiming for rapid market expansion include fermentation infrastructure, formulation quality, and multi-country regulatory approvals.
Syngenta Group Co., Ltd. is expanding its biologicals platform through large-scale manufacturing and innovation-driven partnerships supported by operations at its biologicals facility in Orangeburg, South Carolina. Novonesis A/S is focusing on partnership-led growth in emerging agricultural markets such as India and Africa, where local distribution networks and agronomic education are critical for product adoption. These strategies underscore how the agricultural inoculants market rewards both internal capability development and strong regional commercialization partnerships.
In addition to the leading multinational corporations, the agricultural inoculants market remains highly dynamic, with specialized companies such as Pivot Bio, Inc., Groundwork BioAg Ltd., Koppert Biological Systems B.V., Verdesian Life Sciences LLC, and XiteBio Technologies Inc. playing significant roles. These companies often compete through crop-specific technologies, specialized microbial platforms, and products tailored for regions with limited cold-chain infrastructure or agronomic support. For instance, Pivot Bio, Inc. focuses on nitrogen-fixing microbial technologies, Groundwork BioAg specializes in mycorrhizal inoculants, and Koppert Biological Systems B.V. is expanding its distribution of biological crop protection through strategic partnerships. This competitive structure supports the growth of specialized players while larger companies continue to influence the broader market landscape.
Agricultural Inoculants Industry Leaders
-
BASF SE
-
Bayer AG
-
Novonesis A/S
-
Corteva, Inc.
-
Syngenta Group Co., Ltd.
- *Disclaimer: Major Players sorted in no particular order

Recent Industry Developments
- May 2026: BASF SE commissioned its BioHub fermentation plant at its Ludwigshafen, Germany, site with investment in the high double-digit million-euro range, specifically targeting biological fungicides and biological seed treatments based on Bacillus amyloliquefaciens and Penicillium coprobium. The facility brings fermentation production in-house, linking research and development directly to industrial-scale manufacturing and reinforcing supply chain resilience for BASF SE's BioSolutions portfolio.
- May 2026: Verdesian Life Sciences LLC received the Certified Biostimulant designation from The Fertilizer Institute for its Take Off LS liquid biostimulant, making it the company's second product to earn this certification. The recognition validates Take Off LS, a foliar or in-furrow product improving nitrogen-use efficiency in corn, soybean, and row crops, against industry standards for composition, safety, and efficacy.
- March 2026: BASF SE completed its acquisition of AgBiTech Group from Paine Schwartz Partners. AgBiTech specializes in nucleopolyhedrovirus technology for lepidopteran pest biocontrol, with manufacturing facilities in the United States, Australia, and Brazil. The acquisition strengthens BASF SE's biological insect control portfolio and accelerates the commercialization of nucleopolyhedrovirus technology in Brazil's expanding biocontrol market.


Research Methodology Framework and Report Scope
Market Definitions and Key Coverage
Our study defines the agricultural inoculants market as the value of microbial formulations, chiefly bacteria, fungi or consortia, applied to seed, soil or foliar surfaces to enhance nutrient availability, nitrogen fixation or pest suppression in food and feed crops.
Scope exclusion: products sold solely as silage-specific fermentation aids are not counted.
Segmentation Overview
-
By Function
- Crop Nutrition
- Biocontrol Agents
-
By Microorganism
-
Bacteria
- Bacillus
- Azotobacter
- Rhizobium and Bradyrhizobium
- Phosphate-solubilizing bacteria
-
Fungi
- Trichoderma
- Mycorrhiza
- Beauveria bassiana
- Metarhizium anisopliae
- Viruses
-
Bacteria
-
By Mode of Application
- Seed Treatment
- Soil Treatment
- Foliar Spray
-
By Crop Type
- Grains and Cereals
- Pulses and Oilseeds
- Commercial Crops
- Fruits and Vegetables
- Other Applications
-
By Formulation
- Liquid
- Dry
-
By Geography
-
North America
- United States
- Canada
- Mexico
- Rest of North America
-
Europe
- Germany
- United Kingdom
- France
- Spain
- Italy
- Russia
- Rest of Europe
-
Asia-Pacific
- China
- Japan
- India
- Australia
- Rest of Asia-Pacific
-
South America
- Brazil
- Argentina
- Rest of South America
-
Middle East
- Saudi Arabia
- United Arab Emirates
- Rest of Middle East
-
Africa
- South Africa
- Kenya
- Rest of Africa
-
North America
Detailed Research Methodology and Data Validation
Primary Research
To close gaps, our team interviews agronomists, formulation chemists, input distributors and grower cooperatives across North America, Brazil, India, France and South Africa. These conversations verify real-world adoption rates, typical application doses and forward pricing expectations that desk research alone cannot reveal.
Desk Research
Mordor analysts first screen open datasets from bodies such as FAO FAOSTAT, USDA ERS, Eurostat, ANPII and ICAR; we then layer patent analytics from Questel, shipment traces from Volza, and news archives in Dow Jones Factiva to size planted hectares and gauge inoculant penetration. Company 10-Ks, investor decks, and national biofertilizer guidelines supply ASP clues and regulatory pacing. The sources cited above are illustrative; many additional references inform data cleaning and sense-checking.
Market-Sizing & Forecasting
A hybrid top-down build converts crop acreage into potential treated hectares, applies region-specific penetration and dose multipliers, and prices volumes at weighted average selling prices. Results are cross-checked through selective bottom-up supplier roll-ups and channel checks. Key variables include soybean and corn acreage, organic certification acreage growth, inoculant dose per hectare, average shelf-life related wastage, and regional ASP dispersion. A multivariate regression with acreage, fertilizer price index and organic farmland share drives our 2025-2030 forecast; scenario analysis adjusts for disruptive regulation or drought events.
Data Validation & Update Cycle
Outputs undergo variance checks versus historical trade, are peer-reviewed by senior analysts, and refreshed every twelve months, with interim updates triggered by material events (for example, a major country-level registration change).
Why Mordor's Agricultural Inoculants Baseline Earns Trust
Published figures often diverge because each publisher chooses its own functional scope, base year and refresh cadence.
Key gap drivers include differing treatment of silage additives, whether biofertilizer blends are folded in, contrasting ASP escalation paths, and the timing of currency conversions.
Benchmark comparison
| Market Size | Anonymized source | Primary gap driver |
|---|---|---|
| USD 11.23 B (2025) | Mordor Intelligence | - |
| USD 1.10 B (2022) | Global Consultancy A | Counts only inoculant plus silage additives and omits biofertilizer subsegment |
| USD 0.96 B (2020) | Research House B | Older base year and conservative uptake assumptions depress value |
| USD 4.43 B (2024) | Industry Association C | Relies on shipment surveys from limited regions and flat ASP projection |
This comparison shows that Mordor's wider functional scope, yearly refresh and cross-validated pricing produce a balanced, transparent baseline that decision-makers can replicate and defend.


Key Questions Answered in the Report
What is driving growth in agricultural inoculants through 2031?
Growth is being supported by fertilizer cost pressure, tighter residue expectations, stronger biological input regulation, and wider use of seed treatment and foliar biological programs.
How large is the agricultural inoculants space in 2026?
The Agricultural inoculants market size stands at USD 12.35 billion in 2026 and is forecast to reach USD 19.46 billion by 2031 at a 9.52% CAGR.
Which function leads revenue and which one is growing the fastest?
Biocontrol Agents are the largest function with 58.1% share in 2025, while Crop Nutrition is the fastest function with a 5.1% CAGR through 2031.
Which microorganism group has the strongest outlook?
Bacteria remain the largest group with a 43.4% share in 2025, but Viruses have the fastest projected expansion at 8.0% CAGR through 2031.
Why is seed treatment still the most important application method?
Seed treatment stays largest because it places microbes at the root zone early, fits existing seed systems, and reduces on-farm handling needs.
Which region offers the strongest near-term expansion opportunity?
Asia-Pacific offers the strongest growth outlook with a 6.8% CAGR through 2031, supported by input cost pressure, policy support, and broader extension networks.
Page last updated on:


