US Herbicide Market Size and Share
Market Overview
| Study Period | 2018 - 2031 |
|---|---|
| Forecast Data Period | 2026 - 2031 |
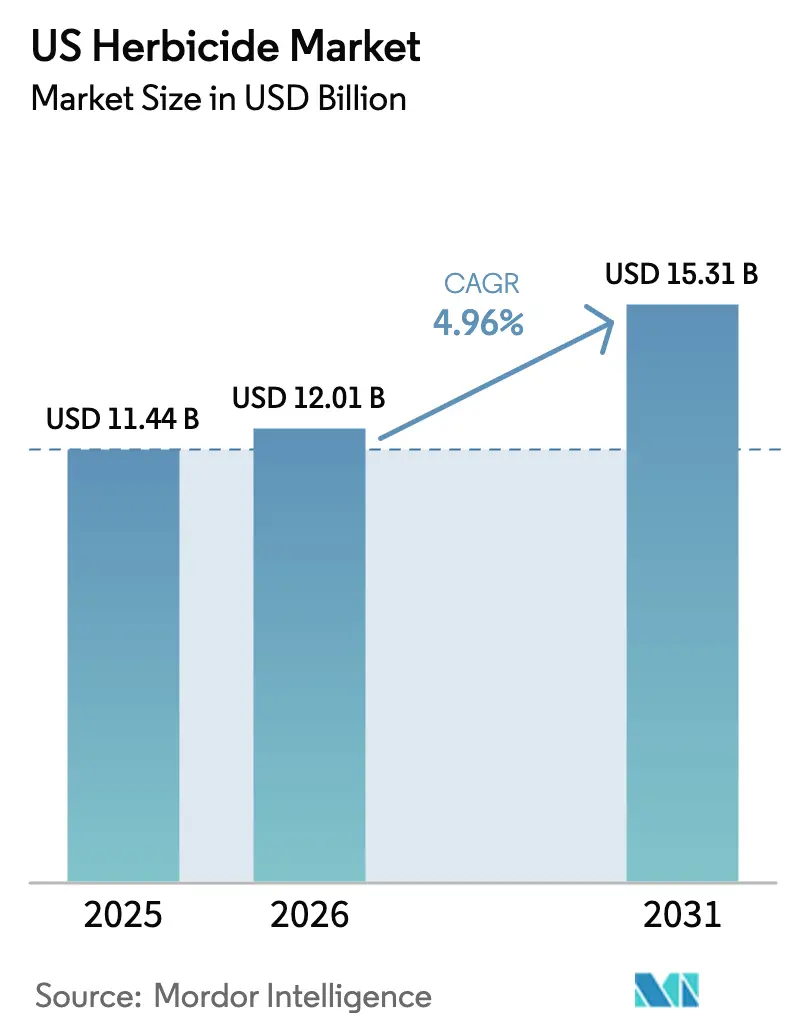
| Base Year Market Size (2025) | USD 11.44 Billion |
| Market Size (2026) | USD 12.01 Billion |
| Market Size (2031) | USD 15.31 Billion |
| Growth Rate (2026 - 2031) | 4.96% CAGR |
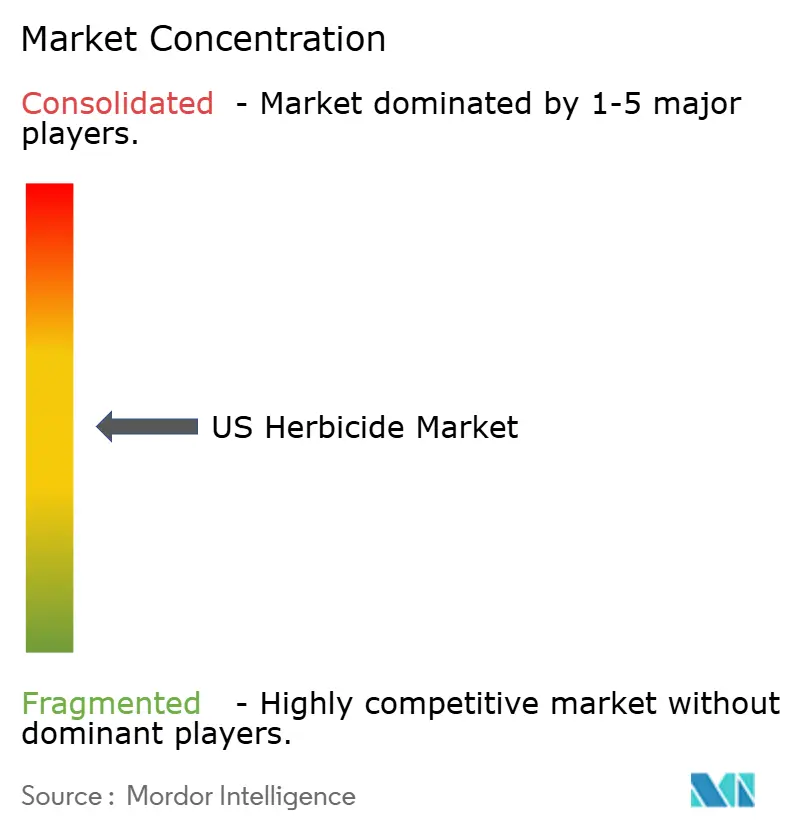
| Market Concentration | Medium |
Major Players *Disclaimer: Major Players sorted in no particular order Image © Mordor Intelligence. Reuse requires attribution under CC BY 4.0. | |
US Herbicide Market Analysis by Mordor Intelligence
The US herbicide market size in 2026 is estimated at USD 12.01 billion, growing from 2025 value of USD 11.44 billion with 2031 projections showing USD 15.31 billion, growing at 4.96% CAGR over 2026-2031. This steady expansion reflects rising labor costs that tip the cost-benefit equation toward chemical over mechanical weed control, a surge in herbicide-tolerant genetically modified (GM) crops, and rapid uptake of precision spraying tools that reward formulation innovation over sheer volume. Farmers are integrating pre-emergence soil treatments with post-emergence passes to counter escalating weed resistance, while premium low-volatility dicamba and 2,4-D blends extend application windows and reduce drift liability. In parallel, drone-enabled spot spraying is lowering total active-ingredient load per acre yet lifting average price realization for fast-acting products. State carbon-credit programs that pay growers to minimize tillage are also reinforcing chemical weed control as an operational norm.
Key Report Takeaways
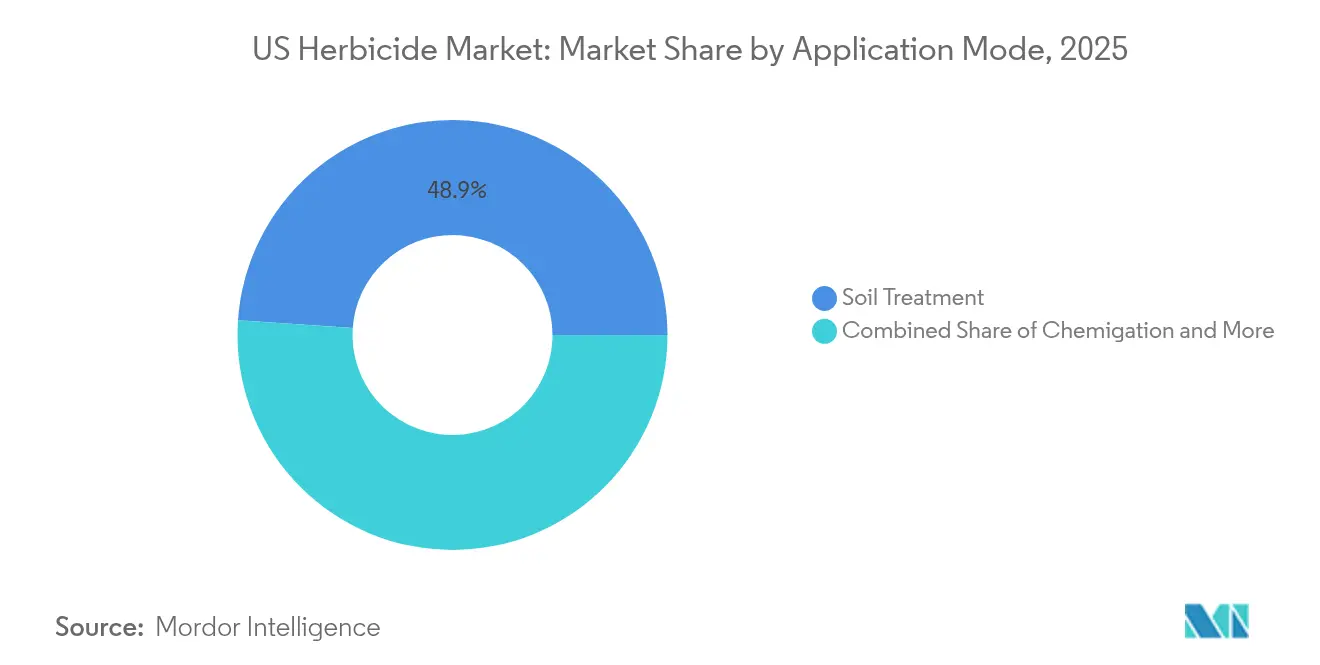
- By application mode, soil treatment led with 48.90% of the US herbicide market share in 2025 and is advancing at a 5.08% CAGR through 2031.
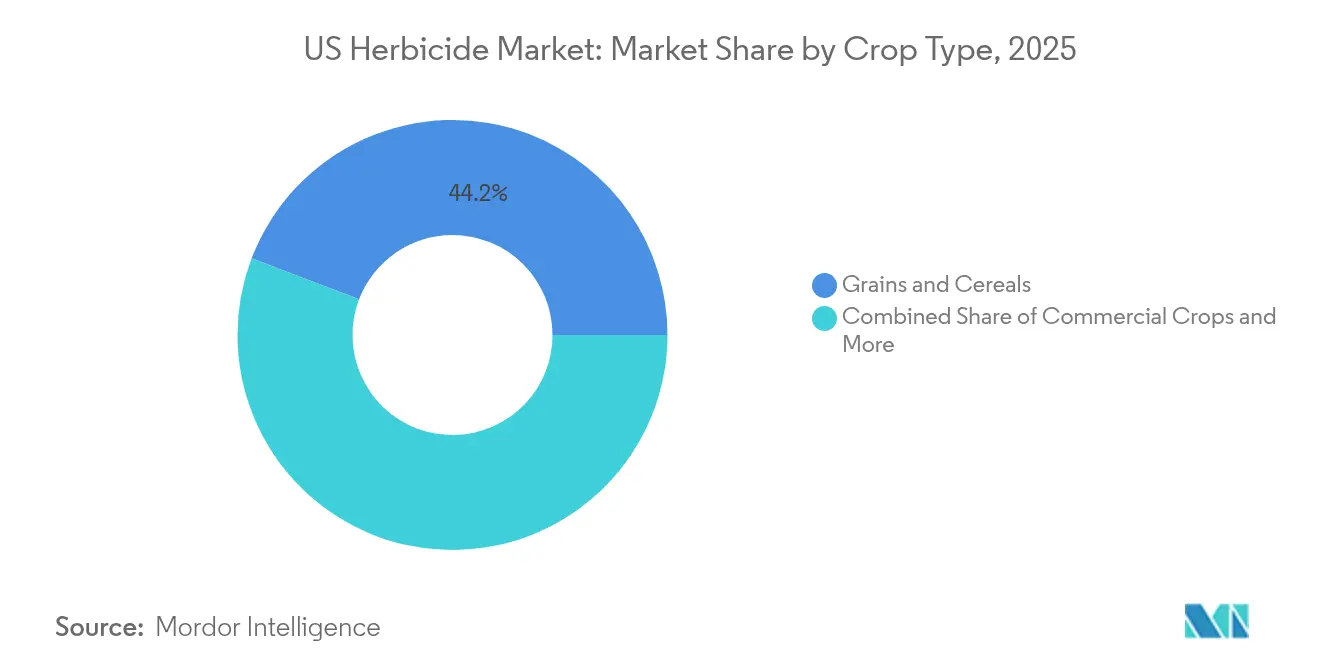
- By crop type, grains and cereals captured 44.20% of the US herbicide market size in 2025, while the segment’s use of stacked GM traits is driving a 5.11% CAGR to 2031.
Note: Market size and forecast figures in this report are generated using Mordor Intelligence’s proprietary estimation framework, updated with the latest available data and insights as of 2026.
US Herbicide Market Trends and Insights
Drivers Impact Analysis*
| Driver | (~) % Impact on CAGR Forecast | Geographic Relevance | Impact Timeline |
|---|---|---|---|
| Surging adoption of herbicide-tolerant GM seeds | +1.2% | Corn Belt states, Great Plains | Medium term (2-4 years) |
| Rising labor cost boosting chemical weed control | +0.9% | National, concentrated in California, Florida | Short term (≤ 2 years) |
| Launch of low-volatility dicamba and 2,4-D formulations | +0.7% | Midwest soybean regions, Cotton Belt | Medium term (2-4 years) |
| Increasing post-emergence applications in conservation tillage | +0.6% | Great Plains, Upper Midwest | Long term (≥ 4 years) |
| Drone-enabled spot spraying reducing overall volumes but raising premium product uptake | +0.4% | High-value crop regions, California Central Valley | Long term (≥ 4 years) |
| Carbon-credit programs paying farmers for reduced tillage that relies on herbicides | +0.3% | Corn Belt, Northern Plains | Long term (≥ 4 years) |
| Source: Mordor Intelligence | |||
Surging Adoption of Herbicide-Tolerant GM Seeds
The proliferation of herbicide-tolerant genetically modified crops is fundamentally restructuring weed management economics across American agriculture. Dicamba-tolerant soybean adoption reached 85% of planted acres in key Midwest states by 2024, creating a captive market for compatible herbicide formulations that command premium pricing over generic alternatives[1]Source: USDA National Agricultural Statistics Service, “Crop Production Reports,” nass.usda.gov. Stack approvals that combine tolerance to glyphosate, dicamba, and 2,4-D widen application windows and simplify resistance management. Yield penalties from uncontrolled Palmer amaranth and waterhemp have pushed growers to integrate multiple modes of action within a single pass. Regulatory continuity, as the EPA continues to green-light new trait stacks, underpins the US herbicide market by guaranteeing farmers more chemical options within traited seed packages.
Rising Labor Cost Boosting Chemical Weed Control
Agricultural labor shortages are driving a structural shift toward chemical weed control as mechanical cultivation becomes economically unviable in many regions. Farm labor wages increased 8.2% year-over-year in 2024, reaching USD 16.50 per hour in California and USD 14.20 in Florida, making herbicide applications increasingly cost-competitive with hand weeding and mechanical cultivation[2]Source: Bureau of Labor Statistics, “Occupational Employment and Wage Statistics,” bls.gov. Mechanical cultivation now exceeds USD 65 per acre once equipment depreciation and fuel are added, versus herbicide program costs that remain under USD 45 per acre in broad-acre crops. Visa processing delays under the H-2A program further tighten labor supply, reinforcing chemical dependence in time-sensitive operations such as vegetable harvest windows.
Launch of Low-Volatility Dicamba and 2,4-D Formulations
Regulatory pressure surrounding herbicide drift incidents has catalyzed innovation in low-volatility formulations that maintain efficacy while reducing off-target movement. These advanced formulations command 25-40% price premiums over conventional products but enable expanded application windows and reduced buffer zone requirements that improve operational flexibility for growers. The technology breakthrough addresses the fundamental challenge of controlling glyphosate-resistant weeds while minimizing damage to sensitive crops like soybeans and cotton in adjacent fields. Market adoption is accelerating as state departments of agriculture implement mandatory training requirements that favor low-volatility products, creating regulatory-driven demand that supports premium pricing structures.
Increasing Post-Emergence Applications in Conservation Tillage
Conservation tillage practices are reshaping herbicide application timing and product selection as farmers seek to minimize soil disturbance while maintaining effective weed control. Post-emergence herbicide applications in no-till and reduced-till systems increased 18% between 2020-2024, driven by carbon credit programs that pay farmers USD 15-25 per acre for adopting soil conservation practices[3]Source: USDA Natural Resources Conservation Service, “Conservation Reserve Program,” nrcs.usda.gov. Residual products such as metribuzin and S-metolachlor protect against late-emerging weeds that thrive under surface residue. EPA approvals for new pre-emergence combinations tailored to conservation systems are further supporting the trend.
Restraints Impact Analysis*
| Restraint | (~) % Impact on CAGR Forecast | Geographic Relevance | Impact Timeline |
|---|---|---|---|
| Growing state-level restrictions on glyphosate use | -0.8% | California, New York, Hawaii | Short term (≤ 2 years) |
| Escalating weed resistance | -0.6% | Corn Belt, Cotton Belt, Great Plains | Medium term (2-4 years) |
| Rapid expansion of biological weed control trials reducing chemical demand in specialty crops | -0.4% | Specialty crop regions, organic transition areas | Long term (≥ 4 years) |
| Litigation risk raising liability insurance premiums for distributors | -0.3% | National distribution networks | Short term (≤ 2 years) |
| Source: Mordor Intelligence | |||
Growing State-Level Restrictions on Glyphosate Use
State-level regulatory actions targeting glyphosate use are creating market fragmentation that complicates product positioning and distribution strategies. California's Proposition 65 labeling requirements and New York's proposed glyphosate ban in schools and parks represent emerging regulatory trends that could expand to agricultural applications. Hawaii's county-level glyphosate restrictions in sensitive watersheds demonstrate how local environmental concerns can override federal EPA approvals, creating precedent for expanded state-level regulation.
Escalating Weed Resistance
Herbicide resistance evolution is accelerating across key weed species, with palmer amaranth populations showing resistance to 6 different herbicide modes of action in some regions. The Weed Science Society of America documented 524 unique cases of herbicide resistance in 2024, representing an increase from the previous year and highlighting the growing challenge of maintaining chemical control efficacy. The economic impact becomes severe when resistance develops to low-cost generic herbicides like glyphosate, forcing farmers to adopt premium products with limited generic competition. University extension services are documenting resistance spread rates of 15-20 miles per year for wind-dispersed species like waterhemp, creating regional hotspots where chemical control options become severely limited.
*Our forecasts treat driver/restraint impacts as directional, not additive. The impact forecasts reflect baseline growth, mix effects, and variable interactions.
Segment Analysis
By Application Mode: Soil Treatment Strengthens Value over Volume
Soil treatment retains 48.90% of the US herbicide market share in 2025 and is climbing at a 5.08% CAGR to 2031. The US herbicide market size tied to this mode benefits from growers adopting preventive strategies that ensure season-long control with one early pass. Precision planters now integrate automated banding that aligns pre-emergence chemistry with seed rows, raising efficacy and conserving application volume. Conservation tillage further entrenches soil-applied products because surface residue can shield germinating weeds from foliar sprays.
Foliar sprayers still account for meaningful value in the US herbicide market due to traited crop technologies that tolerate over-the-top treatments without crop injury. Chemigation is gaining in irrigated acres where injection through center pivots cuts redundant equipment passes and fuel use. Fumigation remains niche yet essential for high-value crops like strawberries, where soil-borne weed seed banks threaten yield economics.


By Crop Type: Grains and Cereals Dominate Chemical Spend
Grains and cereals command 44.20% of the US herbicide market share in 2025 and track a 5.11% CAGR through 2031. The entrenched corn-soybean rotation in the Corn Belt underpins demand, with average application rates of 2.1 lbs active ingredient per acre in corn and 1.8 lbs in soybeans. New triple-stack traits let growers tank-mix multiple modes of action, curbing resistance while protecting yield potential.
Pulses and oilseeds such as canola and sunflower are expanding acreage in the Northern Plains, lifting their contribution to the US herbicide market. Cotton maintains steady demand as dicamba-tolerant varieties proliferate across Texas and Georgia. Specialty crops in fruits and vegetables face tighter residue regulations, yet precision spot technologies are unlocking new acreage for contact herbicides where acceptable maximum residue limits exist.
Geography Analysis
The US herbicide market shows marked regional variability tied to crop mix, climate, and regulation. Iowa, Illinois, Indiana, and Ohio form the Corn Belt core and consume about 35% of national herbicide volume while accounting for only 15% of cropland. Application intensity in these states exceeds 2.5 lbs active ingredient per acre because palmer amaranth, giant ragweed, and waterhemp pose heavy yield threats. Conservation tillage adoption above 70% requires robust soil treatment programs, reinforcing demand for residual chemistry.
California's Central Valley represents a unique market segment characterized by high-value specialty crop production that requires intensive herbicide programs with strict residue tolerance requirements. The state's diverse cropping systems support demand for over 150 different herbicide active ingredients, with per-acre herbicide costs often exceeding USD 200 in tree nut and vegetable production.
The Great Plains wheat belt features fall and spring application windows that hinge on precipitation patterns. Post-harvest burndown is common to suppress volunteer wheat and grassy weeds. Cotton zones in Texas, Georgia, and North Carolina rely on dicamba-tolerant crops but face calendar-based spray cutoffs designed to protect sensitive nearby species. The humid Southeast endures extended growing seasons that mandate sequential applications, keeping regional spend elevated even when commodity prices fluctuate.
Competitive Landscape
The top five manufacturers hold about a good share of the US herbicide market, yielding a moderate concentration profile. Bayer AG, BASF SE, Nufarm Ltd, Syngenta Group, and Corteva Agriscience leverage integrated portfolios that marry traited seed with companion chemistry, creating customer lock-in and data-driven upsell opportunities. Corteva’s Enlist platform, for instance, ties 2,4-D choline formulations to soybean and cotton seed purchases, enabling premium list prices versus off-patent alternatives.
Emerging players exploit precision-application niches. Companies specializing in AI weed-detection software partner with formulation firms to deliver micro-dose concentrates optimized for drone or robotic platforms. Litigation clouding glyphosate has paved the way for competitors such as UPL Limited and FMC Corporation, whose glufosinate or diflufenican lines address resistance and legal risk. Accelerated EPA reviews for reduced-risk actives lower entry barriers, yet firms must pair new molecules with stewardship data packages to win retailer shelf space.
Intellectual property battles now span chemistry and hardware. Patent filings for nozzle geometry, image-analysis algorithms, and variable-rate sprayer controls rose 18% in 2024, reflecting a race to secure differentiation. Subscription-based agronomic services tether growers to particular brands, shifting competition from one-off chemical sales to multi-year solution contracts.
US Herbicide Industry Leaders
BASF SE
Bayer AG
Corteva Agriscience
Nufarm Ltd
Syngenta Group
- *Disclaimer: Major Players sorted in no particular order

Recent Industry Developments
- October 2025: Corteva plans to separate its operations into two independent, publicly traded companies by the second half of 2026. The crop protection business will operate under "New Corteva," while the seed business will function as "SpinCo."
- December 2023: PI Industries reported successful commercialization of pyroxasulfone manufacturing following patent expiry, positioning the company to capture market share in the pre-emergence herbicide segment previously dominated by imported products.
- January 2023: Bayer formed a new partnership with Oerth Bio to enhance crop protection technology and create more eco-friendly crop protection solutions.


US Herbicide Market Report Scope
Chemigation, Foliar, Fumigation, Soil Treatment are covered as segments by Application Mode. Commercial Crops, Fruits & Vegetables, Grains & Cereals, Pulses & Oilseeds, Turf & Ornamental are covered as segments by Crop Type.| Chemigation |
| Foliar |
| Fumigation |
| Soil Treatment |
| Commercial Crops |
| Fruits & Vegetables |
| Grains & Cereals |
| Pulses & Oilseeds |
| Turf & Ornamental |
| Application Mode | Chemigation |
| Foliar | |
| Fumigation | |
| Soil Treatment | |
| Crop Type | Commercial Crops |
| Fruits & Vegetables | |
| Grains & Cereals | |
| Pulses & Oilseeds | |
| Turf & Ornamental |


Market Definition
- Function - Herbicides are chemicals used to control or prevent weeds from preventing crop growth and yield loss.
- Application Mode - Foliar, Seed Treatment, Soil Treatment, Chemigation, and Fumigation are the different type of application modes through which crop protection chemicals are applied to the crops.
- Crop Type - This represents the consumption of crop protection chemicals by Cereals, Pulses, Oilseeds, Fruits, Vegetables, Turf, and Ornamental crops.
| Keyword | Definition |
|---|---|
| IWM | Integrated weed management (IWM) is an approach to incorporate multiple weed control techniques throughout the growing season to give producers the best opportunity to control problematic weeds. |
| Host | Hosts are the plants that form relationships with beneficial microorganisms and help them colonize. |
| Pathogen | A disease-causing organism. |
| Herbigation | Herbigation is an effective method of applying herbicides through irrigation systems. |
| Maximum residue levels (MRL) | Maximum Residue Limit (MRL) is the maximum allowed limit of pesticide residue in food or feed obtained from plants and animals. |
| IoT | The Internet of Things (IoT) is a network of interconnected devices that connect and exchange data with other IoT devices and the cloud. |
| Herbicide-tolerant varieties (HTVs) | Herbicide-tolerant varieties are plant species that have been genetically engineered to be resistant to herbicides used on crops. |
| Chemigation | Chemigation is a method of applying pesticides to crops through an irrigation system. |
| Crop Protection | Crop protection is a method of protecting crop yields from different pests, including insects, weeds, plant diseases, and others that cause damage to agricultural crops. |
| Seed Treatment | Seed treatment helps to disinfect seeds or seedlings from seed-borne or soil-borne pests. Crop protection chemicals, such as fungicides, insecticides, or nematicides, are commonly used for seed treatment. |
| Fumigation | Fumigation is the application of crop protection chemicals in gaseous form to control pests. |
| Bait | A bait is a food or other material used to lure a pest and kill it through various methods, including poisoning. |
| Contact Fungicide | Contact pesticides prevent crop contamination and combat fungal pathogens. They act on pests (fungi) only when they come in contact with the pests. |
| Systemic Fungicide | A systemic fungicide is a compound taken up by a plant and then translocated within the plant, thus protecting the plant from attack by pathogens. |
| Mass Drug Administration (MDA) | Mass drug administration is the strategy to control or eliminate many neglected tropical diseases. |
| Mollusks | Mollusks are pests that feed on crops, causing crop damage and yield loss. Mollusks include octopi, squid, snails, and slugs. |
| Pre-emergence Herbicide | Preemergence herbicides are a form of chemical weed control that prevents germinated weed seedlings from becoming established. |
| Post-emergence Herbicide | Postemergence herbicides are applied to the agricultural field to control weeds after emergence (germination) of seeds or seedlings. |
| Active Ingredients | Active ingredients are the chemicals in pesticide products that kill, control, or repel pests. |
| United States Department of Agriculture (USDA) | The Department of Agriculture provides leadership on food, agriculture, natural resources, and related issues. |
| Weed Science Society of America (WSSA) | The WSSA, a non-profit professional society, promotes research, education, and extension outreach activities related to weeds. |
| Suspension concentrate | Suspension concentrate (SC) is one of the formulations of crop protection chemicals with solid active ingredients dispersed in water. |
| Wettable powder | A wettable powder (WP) is a powder formulation that forms a suspension when mixed with water prior to spraying. |
| Emulsifiable concentrate | Emulsifiable concentrate (EC) is a concentrated liquid formulation of pesticide that needs to be diluted with water to create a spray solution. |
| Plant-parasitic nematodes | Parasitic Nematodes feed on the roots of crops, causing damage to the roots. These damages allow for easy plant infestation by soil-borne pathogens, which results in crop or yield loss. |
| Australian Weeds Strategy (AWS) | The Australian Weeds Strategy, owned by the Environment and Invasives Committee, provides national guidance on weed management. |
| Weed Science Society of Japan (WSSJ) | WSSJ aims to contribute to the prevention of weed damage and the utilization of weed value by providing the chance for research presentation and information exchange. |


Research Methodology
Mordor Intelligence follows a four-step methodology in all our reports.
- Step-1: Identify Key Variables: In order to build a robust forecasting methodology, the variables and factors identified in Step-1 are tested against available historical market numbers. Through an iterative process, the variables required for market forecast are set and the model is built on the basis of these variables.
- Step-2: Build a Market Model: Market-size estimations for the forecast years are in nominal terms. Inflation is not a part of the pricing, and the average selling price (ASP) is kept constant throughout the forecast period.
- Step-3: Validate and Finalize: In this important step, all market numbers, variables and analyst calls are validated through an extensive network of primary research experts from the market studied. The respondents are selected across levels and functions to generate a holistic picture of the market studied.
- Step-4: Research Outputs: Syndicated Reports, Custom Consulting Assignments, Databases & Subscription Platforms


