Non-Destructive Testing (NDT) Software Market Size and Share
Market Overview
| Study Period | 2020 - 2031 |
|---|---|
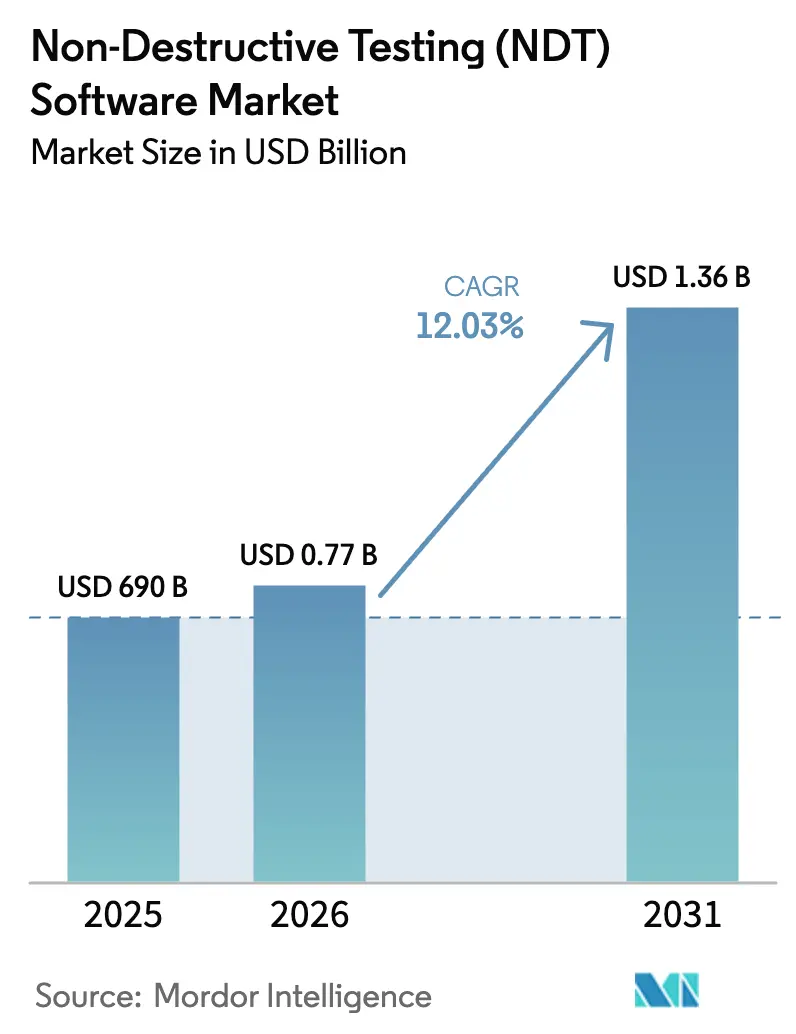
| Market Size (2026) | USD 0.77 Billion |
| Market Size (2031) | USD 1.36 Billion |
| Growth Rate (2026 - 2031) | 12.03% CAGR |
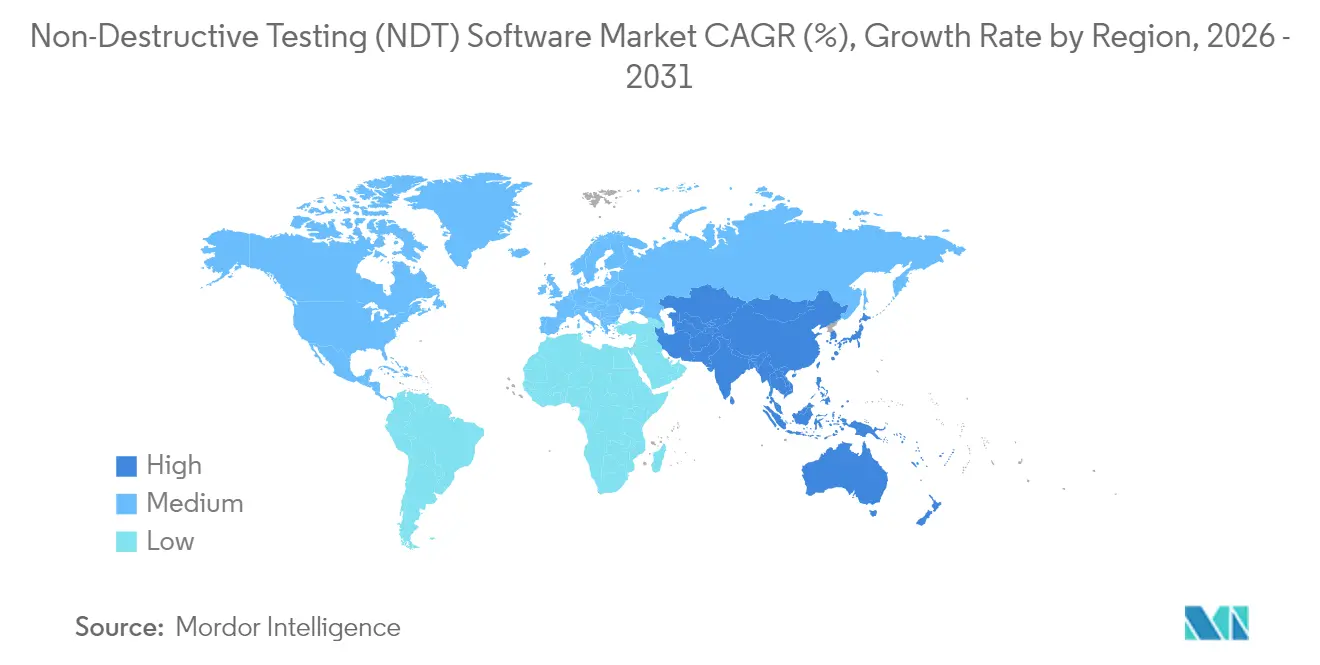
| Fastest Growing Market | Asia Pacific |
| Largest Market | North America |
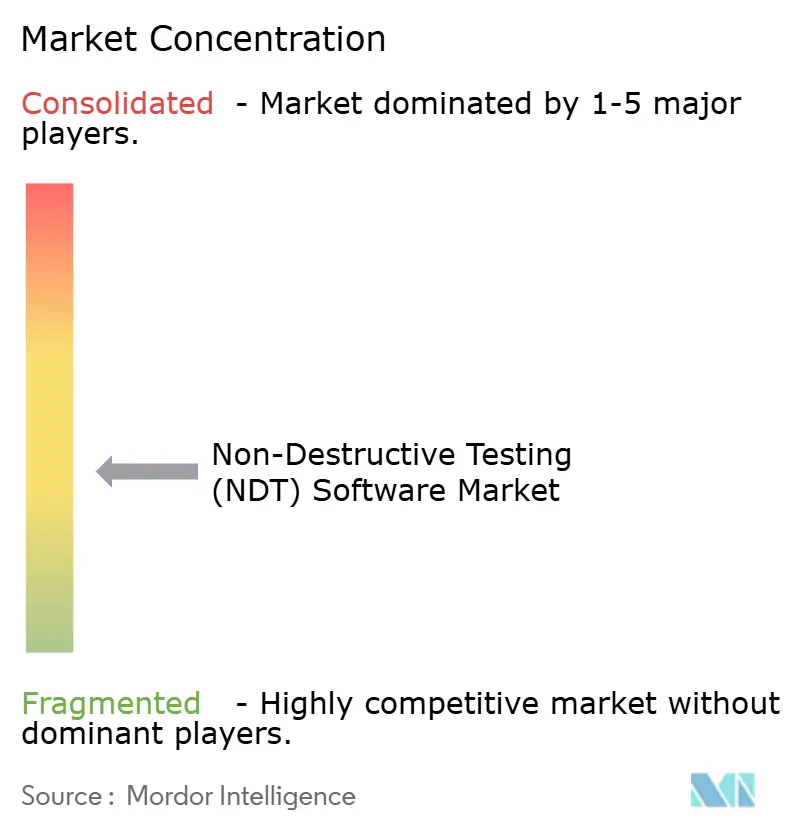
| Market Concentration | Medium |
Major Players *Disclaimer: Major Players sorted in no particular order Image © Mordor Intelligence. Reuse requires attribution under CC BY 4.0. | |
Non-Destructive Testing (NDT) Software Market Analysis by Mordor Intelligence
NDT software market size in 2026 is estimated at USD 772.01 million, growing from 2025 value of USD 690 million with 2031 projections showing USD 1.36 billion, growing at 12.03% CAGR over 2026-2031. Demand accelerates as inspection workflows are digitized, artificial intelligence enhances defect characterization, and cloud analytics become the standard. Aging pipelines, turbines, and pressure vessels necessitate the replacement of manual reports with intelligent platforms that reduce documentation errors, enhance traceability, and monetize historical data. Ultrasonic modules remain dominant, yet eddy-current and radiography programs quickly integrate AI engines that enhance accuracy and reduce cycle times. Competitive intensity increases as equipment manufacturers acquire software start-ups, while pure-play vendors widen hardware compatibility to secure multi-site enterprise deals.[1]“Phoenix Datos|x Digital Radiography System,” Baker Hughes, bakerhughes.com
Key Report Takeaways
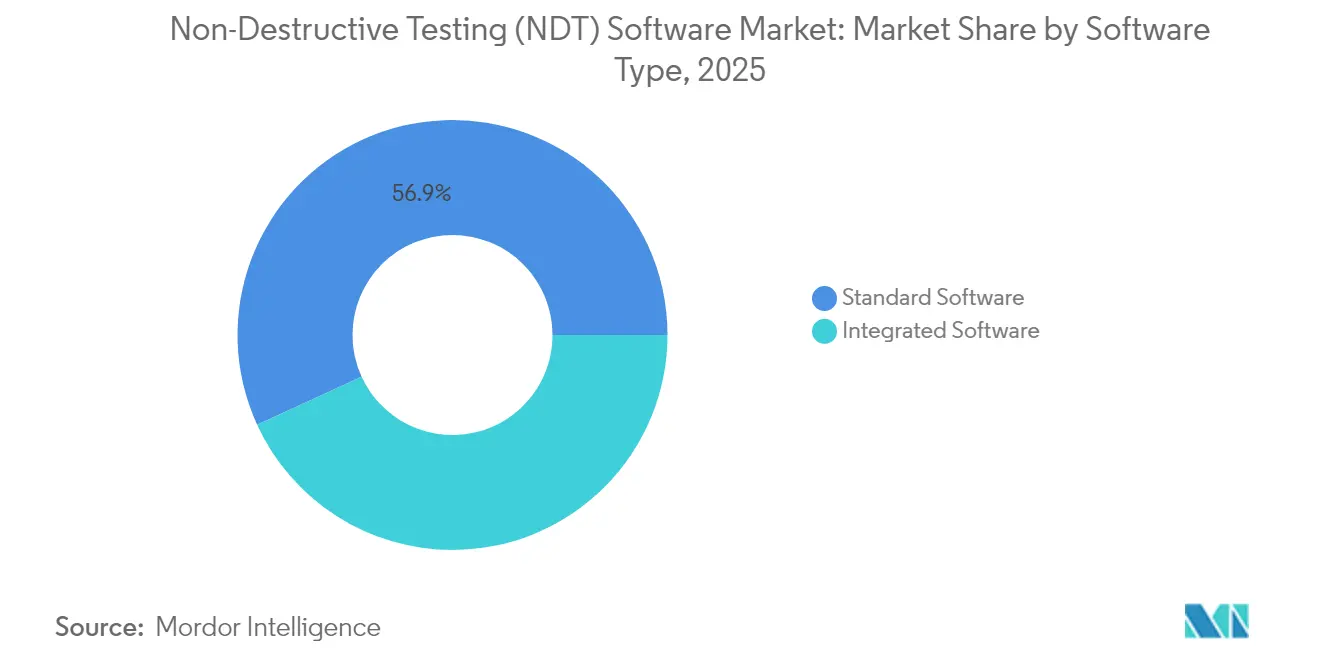
- By software type, standard solutions commanded 56.85% of the NDT software market share in 2025, whereas integrated suites are projected to grow at a 15.05% CAGR to 2031.
- By deployment mode, on-premises platforms held 60.95% of the NDT software market share in 2025; cloud alternatives are expected to advance at a 14.88% CAGR through 2031.
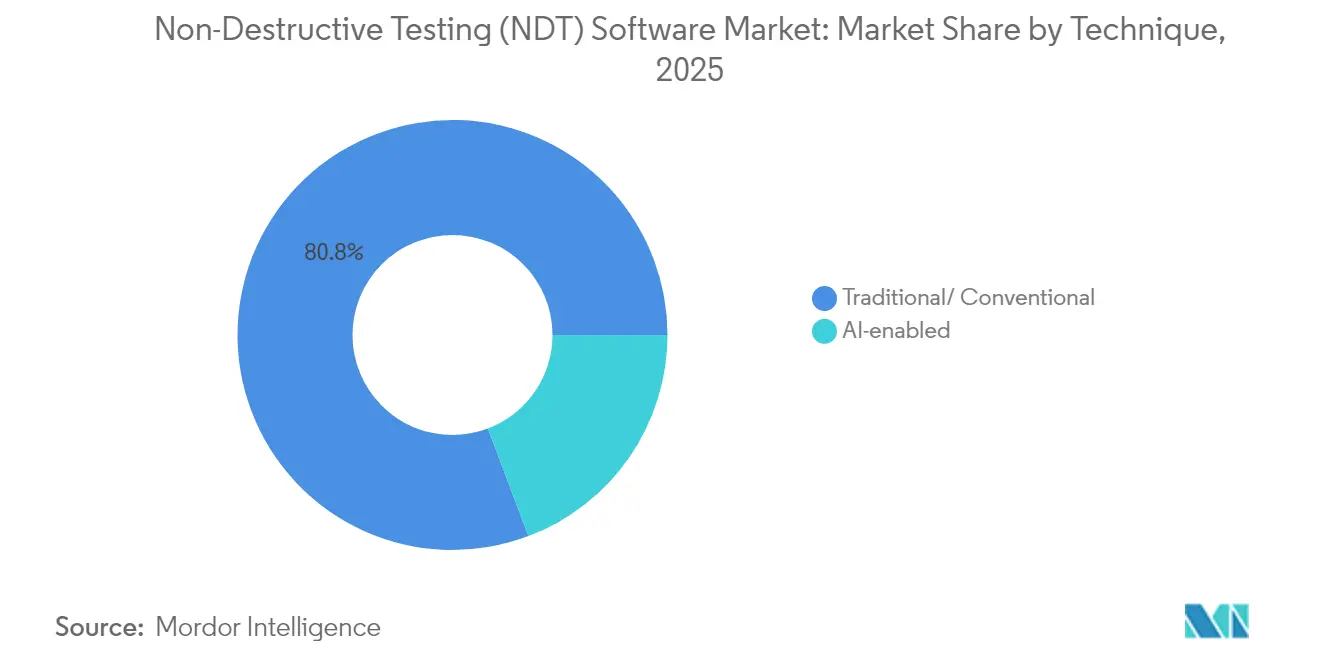
- By technique, conventional programs captured an 80.75% share of the NDT software market in 2025, while AI-enabled modules are expected to expand at a 19.08% CAGR over the forecast period.
- By testing method, ultrasonic solutions led with 36.72% revenue share in 2025; eddy-current systems are set to climb at a 13.55% CAGR to 2031.
- By end-user industry, the oil and gas sector retained 42.55% of the NDT software market share in 2025; however, the automotive and transportation sector is projected to post the fastest CAGR of 14.21% from 2026 to 2031.
- By geography, North America led with a 36.15% share in 2025, while the Asia-Pacific region showed the strongest outlook with a 13.96% CAGR to 2031.
Note: Market size and forecast figures in this report are generated using Mordor Intelligence’s proprietary estimation framework, updated with the latest available data and insights as of 2026.
Global Non-Destructive Testing (NDT) Software Market Trends and Insights
Drivers Impact Analysis*
| Driver | (~) % Impact on CAGR Forecast | Geographic Relevance | Impact Timeline |
|---|---|---|---|
| Rapid digitization of inspection workflows | +2.8% | Global, with North America and Europe leading adoption | Medium term (2-4 years) |
| Increasing adoption of advanced analytics and AI for defect characterization | +3.2% | Global, concentrated in developed markets initially | Long term (≥ 4 years) |
| Stringent regulatory compliance in safety-critical industries | +2.1% | Global, with varying regional intensity | Short term (≤ 2 years) |
| Aging infrastructure requiring frequent inspection cycles | +2.4% | North America and Europe primarily | Long term (≥ 4 years) |
| Shift toward predictive maintenance in Industry 4.0 programs | +1.8% | Global, led by manufacturing hubs in the Asia-Pacific | Medium term (2-4 years) |
| Growth of digital twins integrating NDT data streams | +1.6% | Global, concentrated in advanced manufacturing regions | Long term (≥ 4 years) |
| Source: Mordor Intelligence | |||
Rapid Digitization of Inspection Workflows
Digital transformation pushes inspection software into the center of plant operations. DICONDE-compliant images seamlessly integrate with scanners and asset-management portals, eliminating paper logbooks and reducing transcription errors by 40%. Remote teams log in through secure browsers, annotate findings in real-time, and export audit-ready PDFs that regulators accept without the need for onsite visits. For multi-site operators, central dashboards identify trends such as recurring weld flaws across facilities, enabling timely process improvements.[2]ASTM International, “Standard Practice for Digital Imaging and Communications in Nondestructive Evaluation (DICONDE),” astm.org The result is a fundamentally different work culture, where inspection data shifts from a passive record to a strategic asset.
Increasing Adoption of Advanced Analytics and AI
Convolutional neural networks now exceed 95% accuracy when classifying common casting defects, slashing false positives by 30% in live production trials. Algorithms forecast flaw propagation, allowing planners to schedule weld repairs before cracks breach tolerance. Edge devices process images on scanners, reducing latency and data-sovereignty risk. AI performance hinges on training volume, giving incumbents with decades of archives a head start. New entrants close the gap by licensing public datasets and crowd-sourcing annotations, but large industrial vaults remain a moat for integrated suppliers.
Stringent Regulatory Compliance
Aerospace, nuclear, and pipeline statutes increasingly mandate digital traceability. The United States Federal Aviation Administration now requires electronic maintenance logs for critical components, forcing OEMs to upgrade legacy software.[3]Federal Aviation Administration, “Maintenance Documentation Requirements,” faa.gov European pressure-vessel rules similarly demand cloud-accessible inspection files. Compliance penalties spur rapid procurement cycles that favor proven platforms with audit trails, encryption, and role-based access control. Certification bodies align personnel standards with software skills, prompting technicians to upskill on analytics dashboards as part of ISO 9712 renewals.
Aging Infrastructure Requires Frequent Inspections
Over 60% of U.S. bridges, pipelines, and boilers now exceed design life, triggering tighter risk-based inspection schedules. Complex assets generate terabytes of ultrasonic and radiographic data annually, which conventional spreadsheets cannot effectively parse. Asset owners deploy enterprise NDT suites that automate anomaly tracking, correlate findings against finite-element models, and generate repair forecasts. Total cost of ownership is offset by avoiding unplanned outages that can run into millions of USD per day for refineries and power plants.
Restraints Impact Analysis*
| Restraint | (~) % Impact on CAGR Forecast | Geographic Relevance | Impact Timeline |
|---|---|---|---|
| High upfront software licensing and customization costs | -1.9% | Global, more pronounced in emerging markets | Short term (≤ 2 years) |
| The scarcity of NDT data scientists is hindering AI module adoption | -1.4% | Global, particularly acute in Asia-Pacific and emerging markets | Medium term (2-4 years) |
| Cybersecurity concerns over cloud deployment | -0.8% | Global, with heightened concerns in critical infrastructure sectors | Short term (≤ 2 years) |
| Fragmented standards for data interoperability | -0.7% | Global, affecting cross-platform integration | Medium term (2-4 years) |
| Source: Mordor Intelligence | |||
High Upfront Licensing and Customization Costs
Full-suite deployments often list at USD 100,000-500,000, with integration and training doubling the spend in the first three years. Smaller inspection firms defer purchases or opt for limited-scope modules that delay ROI. Subscription cloud models shift costs to operating budgets, but multiyear fees can ultimately outpace perpetual licenses. Complex ERP interfaces require specialist consultancies, adding USD 50,000 to USD 200,000 to the rollout costs. While mature markets recoup costs through productivity gains, price sensitivity slows adoption across small service providers and emerging economies.
Scarcity of NDT Data Scientists
Only 15% of certified inspectors hold advanced data analytics credentials, leaving vendors to shoulder the responsibility of algorithm tuning and model validation.[4]American Society for Nondestructive Testing, “Introduction to Nondestructive Testing,” asnt.org Universities lag in blending materials science with machine-learning coursework, creating a wage premium for hybrid engineers. As a result, enterprises struggle to operationalize AI modules, which limits their penetration despite pilot successes. Workforce programs sponsored by industry associations and cloud providers are narrowing the gap, but will take several years to scale.
*Our forecasts treat driver/restraint impacts as directional, not additive. The impact forecasts reflect baseline growth, mix effects, and variable interactions.
Segment Analysis
By Software Type – Integrated Suites Accelerate Platform Adoption
Standard programs accounted for 56.85% of 2025 revenue, thanks to their entrenched role in single-method shops. Yet integrated suites are expanding at a 15.05% CAGR as plants consolidate data silos. Large refineries that deploy integrated platforms see a 25% drop in inspection time after linking ultrasonic, radiography, and eddy-current files in a single repository. Integrated environments synchronize with enterprise asset-management systems, allowing maintenance planners to prioritize repairs based on real-time risk scores rather than static calendars. Vendors achieve stickiness by bundling analytics, visualization, and compliance modules that lock in multi-year renewals.
Competition centers on ecosystem breadth. Baker Hughes folded Phoenix software into its scanner lineup, offering customers an end-to-end proposition from probe to dashboard. Pure-play developers counter with hardware-agnostic connectors that import DICONDE files from third-party devices. As more clients demand digital twins, integrated suites position themselves as the backbone for simulation and lifecycle programs. Fragmentation will decline as mergers bundle specialist codebases into broader stacks, creating a clearer divide between platform leaders and niche plugin providers in the NDT software market.


By Deployment Mode – Cloud Migration Gains Momentum
On-premises solutions maintained a 60.95% share in 2025, reflecting the need for security rules in defense and nuclear sites. However, cloud deployments are projected to post a 14.88% CAGR, thanks to elastic storage and remote collaboration. Multinational manufacturers stream terabytes of video radiography to regional data centers, where AI engines classify flaws and push concise alerts to tablets on factory floors. Updated NIST OT-security guidelines outline encryption and access-control blueprints that meet the needs of corporate risk teams. Hybrid strategies will dominate in the near term: sensitive raw images will be kept behind firewalls, while metadata, analytics, and software updates will reside on managed clouds. Latency remains a barrier to real-time phased-array scans in remote oil fields; however, improvements in satellite bandwidth will gradually shift the preference toward cloud-first architectures.
By Technique – AI Reshapes Conventional Workflows
Traditional modules still account for 80.75% of 2025 spending, while AI-enhanced engines grow at a 19.08% CAGR, underscoring a seismic shift from manual interpretation to assisted intelligence. Deep-learning models ingest defect libraries and learn to recognize subtle indications in composites, a task that normally requires decades of technician experience. Operators deploy AI for first-pass screening, then elevate flagged frames to certified evaluators, halving the review hours required for large pipelines. Regulatory bodies monitor the rigor of validation; ASTM convenes working groups to codify AI test protocols, allowing safety cases to cite standardized benchmarks. Over time, AI modes will integrate seamlessly into familiar GUIs, making the transition transparent to frontline inspectors while delivering quantifiable accuracy gains.
By Testing Method – Ultrasonic Dominance Faces Eddy-Current Growth
Ultrasonic suites accounted for 36.72% 2025 revenue due to versatility across welds, forgings, and composites. Continuous improvements in phased-array beamforming raise resolution, extending the life of established ultrasonic ANTE platforms. Eddy-current programs surge at 13.55% CAGR as electric-vehicle battery lines demand high-throughput surface checks on thin aluminum and copper foils. Automotive plants integrate multi-channel eddy-current coils with AI filters that reject non-relevant noise, keeping false-reject rates under 2%. Radiography remains critical for thick-wall castings and pipeline girth welds; however, dose-control regulations are spurring a gradual shift toward digital X-ray panels that reduce exposure and integrate seamlessly with cloud dashboards. Multimodal suites overlay ultrasonic C-scans with eddy-current heat maps in a single viewer, enabling richer root-cause analysis without the need to export files.
By End-User Industry – Oil and Gas Remains Anchor, Automotive Accelerates
Oil and gas held a 42.55% share in 2025, driven by pipeline integrity mandates and refinery turnarounds. Inline inspection data feeds dashboards that forecast corrosion growth, permitting targeted digs that save millions in excavation costs. Automotive and transportation, however, is the sprint segment, rising at a 14.21% CAGR through 2031. Battery gigafactories rely on automated ultrasound and thermography to certify cell welds in milliseconds, a speed unattainable with human review. Aerospace maintains a premium niche, pressuring suppliers to incorporate composite inspection features that detect delamination earlier in the lay-up stages. Power generation continues to maintain a steady demand for turbine blade analytics, while construction and infrastructure teams adopt portable ultrasonic tablets for bridge girder inspections. Cross-industry adoption patterns confirm that once workflows are digitized, users rarely revert, underscoring a compounding network effect for the NDT software market.
Geography Analysis
North America secured 36.15% of 2025 revenue, buoyed by regulations such as the Pipeline and Hazardous Materials Safety Administration's integrity rules, which explicitly require digital archives. Aerospace primes embed AI radiography into production cells, and Canadian pipeline operators deploy multi-modal suites across thousands of miles of transmission network. High software budgets, legacy asset complexity, and strong governance sustain premium license sales.
The Asia-Pacific region is expected to record the fastest growth, with a 13.96% CAGR from 2026 to 2031. China’s smart-factory roll-outs integrate inspection data with MES and ERP layers, creating end-to-end traceability. India’s highways and metro projects are specifying cloud-enabled ultrasound for weld audits, driving the uptake of mobile-first SaaS solutions. Technical societies partner with cloud hyperscalers on boot camps that bridge the skills gap, fostering a domestic ecosystem of implementers. Japan and South Korea pioneer AI eddy-current analytics for electronics solder joints, exporting know-how to regional suppliers.
Europe presents a mature yet stable opportunity, driven by green retrofit programs that prioritize lifecycle health monitoring and maintenance. Germany standardizes DICONDE across automotive suppliers, while the United Kingdom’s Civil Aviation Authority pilots blockchain-secured inspection logs. The Middle East and Africa are expected to grow modestly as operators modernize their offshore rigs. Latin American miners adopt risk-based inspection for slurry pipelines, incrementally enlarging addressable demand.

Competitive Landscape
The NDT software market remains moderately fragmented, with the five largest vendors accounting for a significant share of combined revenue. Global majors differentiate themselves through data-lake-scale and full-suite stacks. Baker Hughes assimilated AI start-ups to embed defect classifiers into scanners, shortening the time to insight for plant operators. Olympus released cloud portals with end-to-end encryption, easing cybersecurity objections among cautious utilities. Zetec continues investing in phased-array algorithms that auto-size cracks in thick sections, catering to nuclear clients. Mid-tier challengers specialize in verticals such as composite aerospace or electric-vehicle batteries, tempting OEMs seeking domain-specific features.
Consolidation will intensify as equipment makers chase recurring revenue streams. Cloud-native newcomers advertise rapid deployment and subscription pricing but must clear trust hurdles in critical infrastructure. Interoperability becomes a key battleground: platforms boasting seamless DICONDE ingestion from rival scanners win contracts where mixed fleets dominate. In additive manufacturing and renewable-energy blades, first movers that couple simulation-ready datasets with inspection feedback loops are well-positioned to carve out defensible niches.
Non-Destructive Testing (NDT) Software Industry Leaders
Zetec Inc.
Eddyfi Technologies Inc.
Baker Hughes Co. (Waygate Technologies)
Mistras Group Inc.
Olympus Corporation
- *Disclaimer: Major Players sorted in no particular order

Recent Industry Developments
- September 2025: Waygate Technologies, the inspection arm of Baker Hughes, has joined forces with Microsoft Azure in a USD 65 million partnership to create cloud-native inspection platforms that marry edge devices with advanced AI models. The system streams pipeline data to the cloud, runs real-time analytics, and feeds actionable insights back to field teams, a workflow that early trials show can cut unplanned shutdowns by 35% on critical oil-and-gas assets
- August 2025: MISTRAS Group widened its European reach by acquiring Germany’s InspectionAI GmbH for USD 42 million. InspectionAI’s deep-learning software spots defects in aerospace composites with 98.5% accuracy and trims inspection time by 60% compared with manual reviews. MISTRAS plans to weave these algorithms into its integrated suite to speed turnaround for airline and defense customers
- July 2025: Eddyfi NDT raised USD 28 million in Series D funding led by Siemens Venture Capital to commercialize quantum-enhanced ultrasonic testing. The hybrid quantum–classical approach digs deeper into nuclear-grade metals, boosting detection sensitivity by 45% while keeping false alarms in check—an advantage for utilities with tight maintenance windows
- June 2025: Carl Zeiss Industrial Quality Solutions launched ZEISS INSPECT Quantum, the first commercial CT-analysis tool powered by quantum algorithms. The software processes tomography data 12 times faster than legacy platforms and finds micro-defects below 10 µm in EV battery components, enabling automakers to predict failures earlier and curb warranty costs


Global Non-Destructive Testing (NDT) Software Market Report Scope
Non-destructive testing (NDT) involves inspecting, testing, or evaluating components, materials, or assemblies. It examines disparities in characteristics or discontinuities without hampering the product's serviceability or part. An NDT software can digitalize different aspects of the NDT workflow, including inspection, testing, and integrity assessment operations. It eliminates the need for paper forms, filing cabinets, and spreadsheets while helping organizations deliver more inspections and tests faster.
The non-destructive testing (NDT) software is segmented by type (standard software, integrated software), end-user industry (oil and gas, power and energy, aerospace and defense, automotive and transportation, electronics, and other end-user industries), and geography (Americas, Europe, Asia-Pacific, and Middle East and Africa). The report offers market forecasts and size in value (USD) for all the above segments.
| Standard Software |
| Integrated Software |
| On-premises |
| Cloud-based |
| Hybrid |
| Traditional/ Conventional |
| AI-enabled |
| Ultrasonic Testing |
| Radiography Testing |
| Eddy-current Testing |
| Magnetic Particle and Dye Penetrant |
| Other Testing Methods (IR, Acoustic, etc.) |
| Oil and Gas |
| Power Generation |
| Aerospace |
| Defense |
| Automotive and Transportation |
| Manufacturing and Heavy Engineering |
| Construction and Infrastructure |
| Chemical and Petrochemical |
| Marine and Ship Building |
| Electronics and semiconductor |
| Mining |
| Medical Devices |
| Other End-user Industries |
| North America | United States | |
| Canada | ||
| Mexico | ||
| South America | Brazil | |
| Argentina | ||
| Rest of South America | ||
| Europe | Germany | |
| United Kingdom | ||
| France | ||
| Italy | ||
| Spain | ||
| Rest of Europe | ||
| Asia-Pacific | China | |
| Japan | ||
| India | ||
| South Korea | ||
| South-East Asia | ||
| Rest of Asia-Pacific | ||
| Middle East and Africa | Middle East | Saudi Arabia |
| United Arab Emirates | ||
| Turkey | ||
| Rest of Middle East | ||
| Africa | South Africa | |
| Nigeria | ||
| Rest of Africa | ||
| By Software Type | Standard Software | ||
| Integrated Software | |||
| By Deployment Mode | On-premises | ||
| Cloud-based | |||
| Hybrid | |||
| By Technique | Traditional/ Conventional | ||
| AI-enabled | |||
| By Testing Method | Ultrasonic Testing | ||
| Radiography Testing | |||
| Eddy-current Testing | |||
| Magnetic Particle and Dye Penetrant | |||
| Other Testing Methods (IR, Acoustic, etc.) | |||
| By End-user Industry | Oil and Gas | ||
| Power Generation | |||
| Aerospace | |||
| Defense | |||
| Automotive and Transportation | |||
| Manufacturing and Heavy Engineering | |||
| Construction and Infrastructure | |||
| Chemical and Petrochemical | |||
| Marine and Ship Building | |||
| Electronics and semiconductor | |||
| Mining | |||
| Medical Devices | |||
| Other End-user Industries | |||
| By Geography | North America | United States | |
| Canada | |||
| Mexico | |||
| South America | Brazil | ||
| Argentina | |||
| Rest of South America | |||
| Europe | Germany | ||
| United Kingdom | |||
| France | |||
| Italy | |||
| Spain | |||
| Rest of Europe | |||
| Asia-Pacific | China | ||
| Japan | |||
| India | |||
| South Korea | |||
| South-East Asia | |||
| Rest of Asia-Pacific | |||
| Middle East and Africa | Middle East | Saudi Arabia | |
| United Arab Emirates | |||
| Turkey | |||
| Rest of Middle East | |||
| Africa | South Africa | ||
| Nigeria | |||
| Rest of Africa | |||


Key Questions Answered in the Report
What is the current value of the NDT software market?
The NDT software market size is expected to reach USD 772.01 million by 2026.
How fast is the NDT software market expected to grow?
It is projected to post a 12.03% CAGR and reach USD 1.36 billion by 2031 (2026-2031).
Which deployment model is expanding most rapidly?
Cloud-based platforms are registering the fastest 14.88% CAGR as enterprises adopt remote analytics.
Which industry shows the fastest new adoption?
The automotive and transportation sector leads with a 14.21% CAGR, driven by the growing need for electric-vehicle battery inspections.
Which region demonstrates the strongest growth outlook?
The Asia-Pacific region is expected to record a 13.96% CAGR through 2031 (2026-2031), driven by industrial digitization in China and India.
What is the primary technology trend influencing product development?
The integration of artificial intelligence and machine learning for automated defect classification is reshaping software development roadmaps.
Page last updated on:


