Philippines Quick Commerce Market Size and Share
Market Overview
| Study Period | 2020 - 2031 |
|---|---|
| Forecast Data Period | 2026 - 2031 |
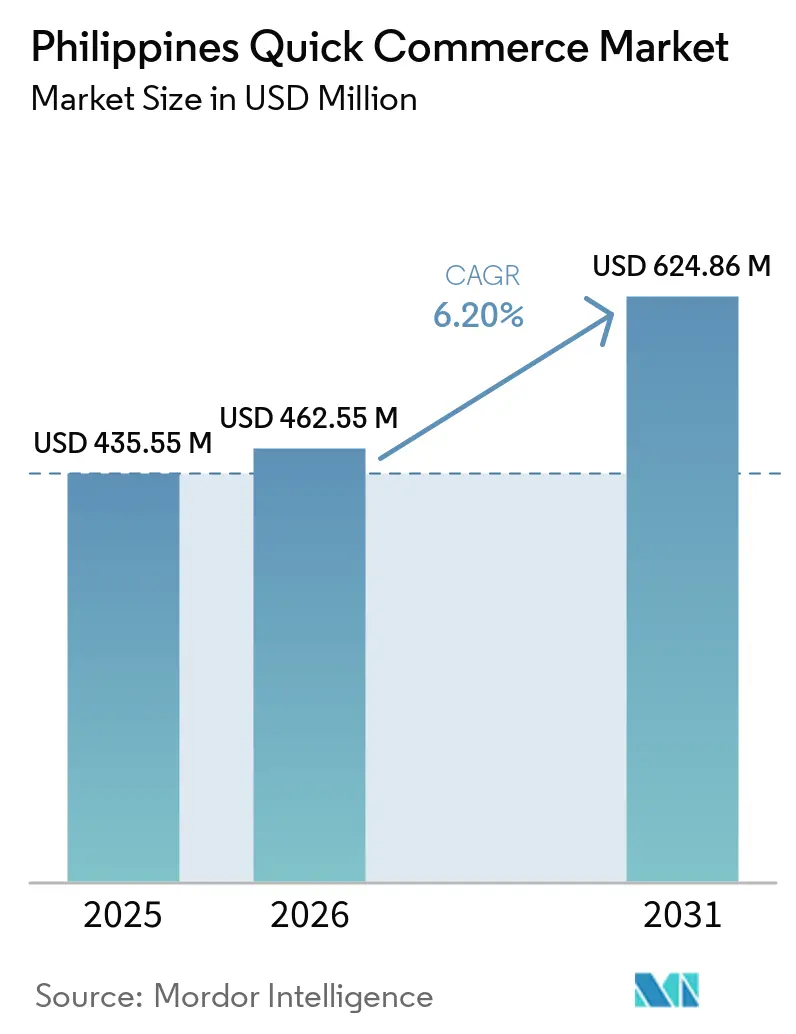
| Base Year Market Size (2025) | USD 435.55 Million |
| Market Size (2026) | USD 462.55 Million |
| Market Size (2031) | USD 624.86 Million |
| Growth Rate (2026 - 2031) | 6.20% CAGR |
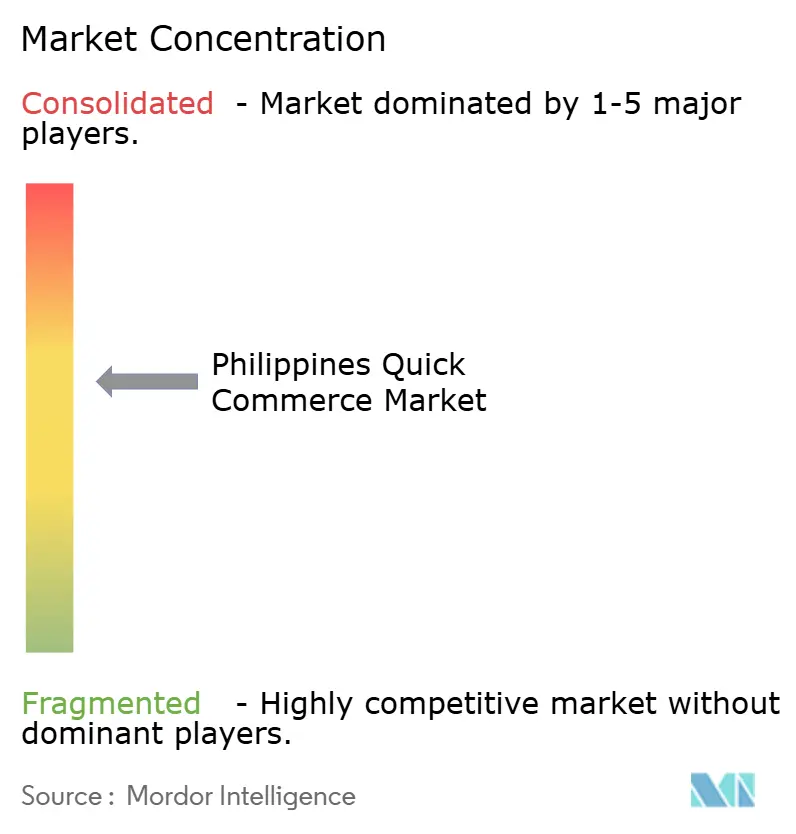
| Market Concentration | Medium |
Major Players *Disclaimer: Major Players sorted in no particular order Image © Mordor Intelligence. Reuse requires attribution under CC BY 4.0. | |
Philippines Quick Commerce Market Analysis by Mordor Intelligence
The Philippines quick commerce market size was valued at USD 435.55 million in 2025 and USD 462.55 million in 2026, and is projected to reach USD 624.86 million by 2031, at a CAGR of 6.20% from 2026 to 2031. Growth is centered in dense urban corridors where short delivery radii, heavy smartphone use, and frequent convenience purchases support repeat ordering. The shift toward digital payments has removed much of the checkout friction that previously slowed impulse-led online grocery and household purchases. Platform operators are also investing in dark stores and retail partnerships at the same time, which shows that control over fulfillment and rapid geographic reach are both important in this market. Social commerce is tightening competition because product discovery and checkout now happen in the same interface for a large share of younger buyers. Cost pressure remains the main structural constraint, since last-mile delivery is still expensive in congested cities and this limits how much operators can scale speed-based models without weakening margins.
Key Report Takeaways
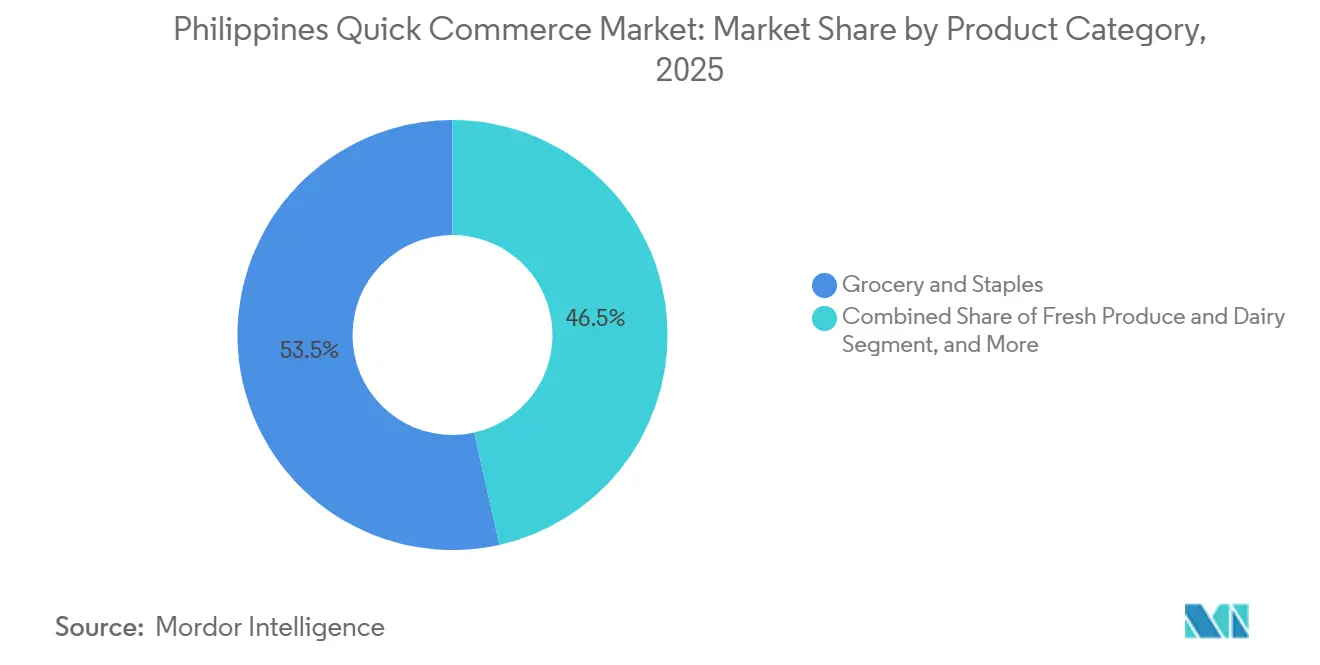
- By product category, Grocery and Staples accounted for 53.48% of the Philippines quick commerce market share in 2025, while Pet Care is forecast to expand at a 6.56% CAGR through 2031.
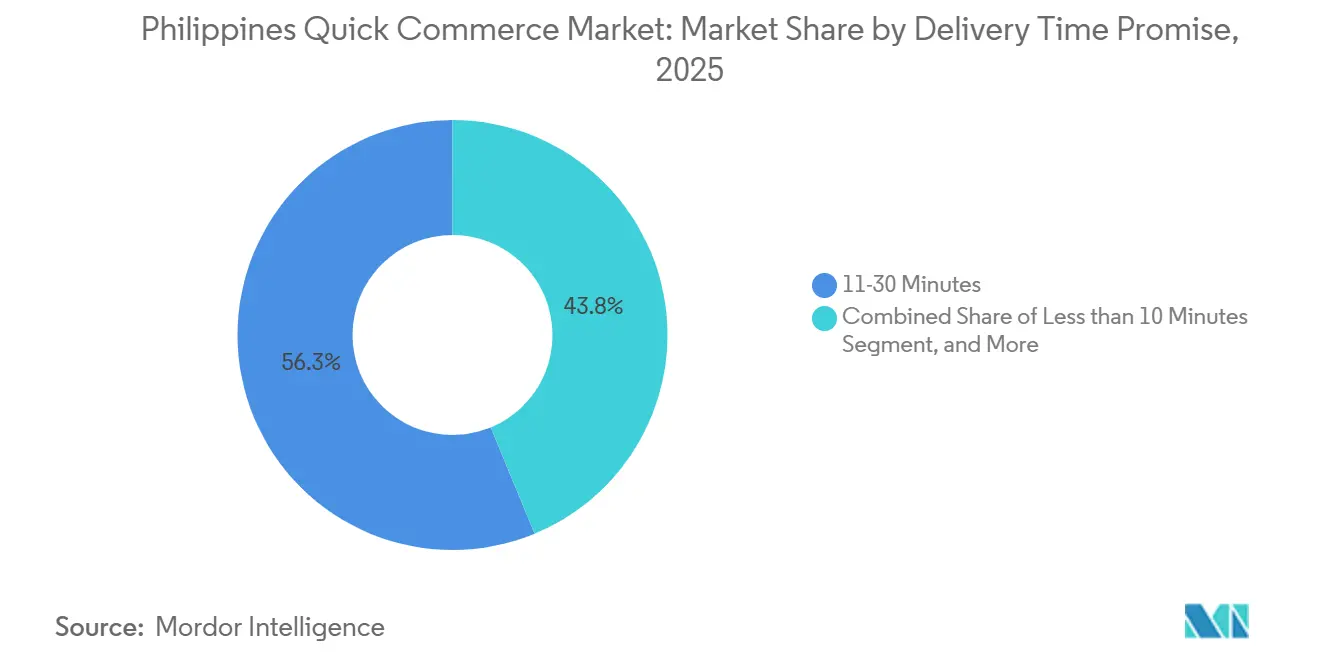
- By delivery time promise, the 11-30 Minutes tier accounted for 56.25% of the Philippines quick commerce market share in 2025, while the Less than 10 Minutes tier is projected to grow at a 6.88% CAGR through 2031.
Note: Market size and forecast figures in this report are generated using Mordor Intelligence’s proprietary estimation framework, updated with the latest available data and insights as of January 2026.
Philippines Quick Commerce Market Trends and Insights
Drivers Impact Analysis*
| Driver | (~) % Impact on CAGR Forecast | Geographic Relevance | Impact Timeline |
|---|---|---|---|
| Rapid Urbanization of Metro Manila and Cebu Boosting Demand | +1.4% | NCR, Metro Cebu, Greater Manila Area | Short term (≤ 2 years) |
| Growing Penetration of Digital Wallets and Cashless Payments | +1.2% | National, with concentration in Metro Manila and Tier I cities | Short term (≤ 2 years) |
| Expansion of Dark-Store Networks by Key Players | +1.0% | Metro Manila, Cebu, Davao, Baguio, Pampanga | Medium term (2-4 years) |
| Rising Disposable Income Among Gen Z and Millennials | +0.8% | Tier I Metros and Tier II Cities | Medium term (2-4 years) |
| Introduction of AI-Powered Demand Forecasting for Micro-Fulfillment | +0.6% | Metro Manila, with spillover to Cebu and Davao | Long term (≥ 4 years) |
| Emergence of Sari-Sari Store Aggregator Partnerships | +0.5% | National, strongest in Tier II and Tier III regions, including BARMM, Negros, and Calabarzon | Long term (≥ 4 years) |
| Source: Mordor Intelligence | |||
Rapid Urbanization of Metro Manila and Cebu Boosting Demand
Metro Manila reached 14,001,751 residents in the 2024 census, reinforcing its position as the country's densest demand center for fast delivery services.[1]Manila Standard Business, “Metro Manila's Population Tops 14 Million Mark, 2024 Census,” Manila Standard, manilastandard.net The Manila urban agglomeration reached 24.7 million people in 2025, and the Philippine urban population crossed 55.8% of the national total, which keeps demand concentrated in corridors where fast fulfillment is easier to sustain. In the Philippines quick commerce market, this concentration improves dark-store economics because shorter catchment radii can serve more households with the same rider base. The same urban pattern also supports higher order frequency because apartment residents and professional households rely more heavily on convenience-led top-up purchases. Cebu adds a second strong urban node for the Philippines quick commerce market because leading operators already treat it as a core city for scale rather than a peripheral expansion market.
Growing Penetration of Digital Wallets and Cashless Payments
Digital payments accounted for 57.4% of total monthly retail transaction volume and 59.0% of retail transaction value in the Philippines in 2024, indicating the country moved beyond the government's target band. InstaPay and PESONet processed PHP 24.7 trillion (USD 431 billion) in 2025, up 42% from PHP 17.42 trillion (USD 306.5 billion) in 2024. QR Ph person-to-merchant transaction volume rose 1,315.9% year over year, indicating that QR-based checkout is now part of regular retail behavior rather than a niche channel. In the Philippines quick commerce market, this means payment adoption is no longer the main barrier in urban households, and order frequency has become a more important lever for gross merchandise value growth.[2]Bangko Sentral ng Pilipinas, “PPDD Payments Bulletin: Data as of December 2025,” Bangko Sentral ng Pilipinas, bsp.gov.phGCash had 94 million registered users as of Q1 2025 and processed more than 18 million daily transactions, while e-wallets accounted for 39% of digital transactions in 2025, surpassing cards.
Expansion of Dark-Store Networks by Key Players
The Philippines quick commerce market is becoming more infrastructure led as operators move from pure marketplace aggregation toward tighter control over inventory and fulfillment. pandamart shifted to 24/7 nationwide dark-store operations in March 2026 and activated nodes across Metro Manila, Baguio, Pampanga, Cebu, and Davao. GrabMart expanded grocery delivery across more than 30 Robinsons Easymart locations in May 2025, which widened reach in Luzon, Visayas, and provincial cities without requiring the same warehouse spending as a fully proprietary network. Asset-light partnerships improve coverage speed, while dark stores offer better control over assortment and margin, so the leading companies are effectively using both models at once in the Philippines quick commerce market. This raises the entry barrier for smaller players because matching density and assortment at the same time requires capital, operational discipline, and city-level execution that are difficult to build quickly.
Rising Disposable Income Among Gen Z and Millennials
Filipino Gen Z consumers accounted for 38% of the population, or 41 million people, and made an average of 6 online purchases per month by mid-2024, with 92% using mobile phones as their primary purchase device and 53% preferring cashless payments. Household consumption growth was forecast at 4.5% in 2025 and is projected to rebound to 6.0% in 2026, lifting total spending to PHP 13.9 trillion (USD 245 billion) at constant 2010 prices. In the Philippines quick commerce market, the spending base matters because younger households place a clear premium on convenience, delivery speed, and app-based product discovery. TikTok's discovery-commerce model shortened the path from browsing to checkout for this group in 2025, which supported more impulse-led baskets in the same delivery corridors used by rapid commerce platforms. The same demand is strongest in Tier I metros and Tier II cities, where income growth, household formation, and mobile-first consumption are all reinforcing one another in the Philippines quick commerce market.
Restraints Impact Analysis*
| Restraint | (~) % Impact on CAGR Forecast | Geographic Relevance | Impact Timeline |
|---|---|---|---|
| High Last-Mile Logistics Costs In Congested Cities | -0.7% | Metro Manila, Cebu City urban core | Short term (≤ 2 years) |
| Limited Cold-Chain Infrastructure For Fresh Produce | -0.4% | National, with acute gaps in Visayas and Mindanao | Medium term (2-4 years) |
| Stringent City-Level Traffic Regulations And Window Hours | -0.3% | Metro Manila, including MMDA, Makati, and Quezon City zones | Short term (≤ 2 years) |
| Consumer Trust Issues Around Order Accuracy In Tier III Towns | -0.2% | Tier III and Below, including provincial towns in Mindanao and Eastern Visayas | Long term (≥ 4 years) |
| Source: Mordor Intelligence | |||
High Last-Mile Logistics Costs In Congested Cities
Philippine logistics costs consumed 27.5% of GDP in 2025, the highest ratio in ASEAN, and logistics-related expenses accounted for 27% of firms' sales revenue. Last-mile delivery already accounts for more than 50% of total shipping costs in the Asia Pacific, so congestion in Metro Manila makes that cost burden even harder to absorb for quick-delivery models. In the Philippines quick commerce market, this squeezes margins most heavily in the 11-30 Minutes tier because it is fast enough to promise convenience but not dense enough to fully neutralize urban traffic penalties. Local traffic rules and delivery window controls also increase riders' idle time, which increases per-order costs in dense city corridors. The Luzon Economic Corridor may improve wider logistics efficiency over time, but it is less likely to solve intra-city last-mile pressure in the near term.
Limited Cold-Chain Infrastructure For Fresh Produce
The Philippine Department of Agriculture allocated PHP 3 billion (USD 52.5 million) in 2025 to build 99 hybrid cold storage facilities across major agricultural regions. That investment supports farm-to-market handling, but it does not fully address the rapid-cycle, small-batch refrigerated dispatch model that the Philippine quick commerce market needs for reliable fresh delivery. Existing gaps, therefore, limit fresh produce and dairy assortment outside Metro Manila and Cebu, where network density is already thinner. Compliance under the Food Safety Act of 2013 and Department of Agriculture accreditation rules also adds cost and time to private cold-chain expansion. In the Philippines' quick commerce market, this keeps repeat-order fresh baskets narrower than they could be and reduces platforms ability to scale higher-frequency grocery trips beyond the largest cities.
*Our forecasts treat driver/restraint impacts as directional, not additive. The impact forecasts reflect baseline growth, mix effects, and variable interactions.
Segment Analysis
By Product Category: Grocery And Staples Anchor Volume While Pet Care Lifts The Growth Profile
Grocery and Staples held 53.48% of the Philippines quick commerce market share in 2025, making essential goods the main habit-forming category across delivery platforms. Filipino households still rely heavily on neighborhood retail for daily essentials, and this behavior has been moving onto digital platforms in metro corridors where convenience and repeat purchasing are strongest. In the Philippines quick commerce industry, this makes Grocery and Staples the core traffic driver because it supports frequent replenishment rather than occasional browsing. Fresh Produce and Dairy remained a high-intent segment, but operators still faced sourcing and handling pressure that reduced price flexibility against wet markets and traditional stores.
Pet Care is projected to grow at a 6.56% CAGR from 2026 to 2031, the fastest pace among product categories in the Philippines quick commerce market. Urban Gen Z and Millennial households are driving this rise because pet ownership is growing in dense residential areas where convenience-led purchasing is already strong. A December 2025 collaboration between Packworks and Ateneo de Manila University found that AI-driven demand forecasting lifted daily GMV by 46% and total sales by 17% across 300-plus sari-sari stores, with Pet Care among the categories most responsive to precision reordering. Home and Cleaning Supplies has also shown steady bundling with Grocery and Staples orders, which means operators that improve SKU-level forecasting can lift profitability even in categories that currently carry thinner margins.


By Delivery Time Promise: The 11-30 Minutes Window Leads Today While Sub-10 Minutes Gains Strategic Weight
The 11-30 Minutes tier captured 56.25% of the Philippines' quick commerce market share in 2025, confirming it as the current operating standard for rapid fulfillment. This window balances consumer expectations with achievable network economics by avoiding the extreme node density required for the shortest delivery promise. Pandamart's 24/7 grocery model and GrabMart's partnership-led expansion both fit naturally into this band across major urban nodes. The Less than 10 Minutes segment is forecast to grow at a 6.88% CAGR through 2031, the fastest rate in this segment of the Philippines' quick commerce market.
This promise depends on a different infrastructure model that uses smaller and more numerous micro-fulfillment points with a tighter assortment. DHL Philippines identified localized delivery hubs and micro-fulfillment centers as a key response to congestion, supported by predictive analytics that position stock before demand peaks. In the Philippines' quick commerce industry, operators pursuing the shortest delivery window also need stronger engagement with local governments, as traffic restrictions and neighborhood access rules shape execution at the street level. That is why sub-10-minute delivery remains a high-potential but selectively scalable format rather than a universal operating model today.
Geography Analysis
Metro Manila reached 14,001,751 residents in the 2024 census, and the Manila urban agglomeration climbed to 24.7 million in 2025, which kept demand concentrated in dense delivery corridors. The same region also benefits from the deepest digital payment penetration, which supports faster checkout and repeat ordering in the Philippines quick commerce market. Pandamart's move to 24/7 dark-store operations and GrabMart's expansion with Robinsons Easymart both confirmed that competitive investment remained concentrated in the capital corridor through 2025 and 2026. Cost remains the main constraint in Metro Manila because the country still carries the highest logistics-cost-to-GDP ratio in ASEAN, which keeps per-order fulfillment pressure elevated.
Cebu has become a core second cluster because Pandamart's 24/7 coverage explicitly includes the city, showing that leading operators already view it as a full operating node rather than a test market. Shopee's February 2026 logistics expansion reduced average delivery times in the Visayas and Mindanao from around 7 days to 3-4 days, lowering the logistics floor for faster commerce formats in those regions. Davao and the broader Mindanao region are also becoming more relevant because regional digitalization is rising and platform support is becoming more local. Lazada Philippines opened a dedicated office in Davao City in early 2025, while Packworks reported sharp 2025 growth in active sari-sari stores.
Baguio, Pampanga, Tarlac, Rizal, and similar corridors are being served through partnership-led models that expand reach without requiring every operator to build a full dark-store network in each city. The archipelagic geography of the Philippines still limits how quickly truly nationwide quick commerce can be achieved because domestic movement across islands remains structurally expensive. This means future scale will depend not only on demand growth, but also on whether operators can align localized fulfillment with a logistics network that remains fragmented beyond the largest urban corridors.
Competitive Landscape
The Philippines quick commerce market remains moderately consolidated at the platform level, with Delivery Hero SE through pandamart and Grab Holdings through GrabMart occupying the leading positions in rapid grocery and household fulfillment. Retail incumbents such as Robinsons Retail Holdings and SM Investments also remain relevant because they can extend digital delivery through existing store networks instead of starting with a fully greenfield model. In the Philippines quick commerce market, that creates a clear split between companies that spend heavily for tighter fulfillment control and companies that accept longer windows in exchange for lower fixed cost. pandamart's nationwide 24/7 dark-store rollout in March 2026 was one of the clearest examples of the asset-heavy approach, while GrabMart's activation across more than 30 Robinsons Easymart stores showed the strength of an asset-light partnership strategy. This keeps rivalry elevated because both approaches can work, but each favors different city densities and cost structures.
TikTok Shop Philippines has added a third competitive format to the Philippines quick commerce market by combining product discovery, checkout, and seller visibility in one interface.[3]Beatriz Marie D. Cruz, “TikTok Shop Philippines Bullish Over Sales Growth This Year,” BusinessWorld Online, bworldonline.com The platform reported more than 200% sales growth for local sellers in 2025 and expanded the reach of its Unlad Lokal MSME program in 2026, which shows that attention and conversion are becoming more tightly linked. White space remains strongest in cold-chain-enabled fresh fulfillment and in provincial aggregation through sari-sari store networks, where no operator has yet secured a clear structural lead outside the top metros. GrowSari and Packworks are important in that second lane because they are building digital rails that could later support broader branded quick commerce activity in smaller cities and towns. This part of the market is still open because local reach, inventory control, and digital payments have not matured at the same pace across the country.
Technology-led differentiation is still underused in the Philippines quick commerce market, which gives early movers room to build defensible advantages. Packworks and Ateneo de Manila University reported that AI-led demand forecasting lifted daily GMV by 46% and total sales by 17% across more than 300 sari-sari stores in 2025, which shows the value of better inventory intelligence at the store level. foodpanda also moved beyond basic delivery in October 2025 through its TabSquare.AI partnership for personalized upselling and its planned co-branded credit card with EastWest Bank, which pointed to a broader loyalty and monetization strategy. The competitive field is therefore likely to remain active, because scale alone is not enough when fulfillment design, payments, social discovery, and inventory intelligence are all shaping consumer retention.
Philippines Quick Commerce Industry Leaders
MetroMart Technologies Inc.
Pick.A.Roo (Hatch Tech Solutions Inc.)
Grab Holdings Inc.
Delivery Hero SE (foodpanda)
Lazada Group
- *Disclaimer: Major Players sorted in no particular order

Recent Industry Developments
- May 2026: TikTok Shop Philippines reaffirmed plans to expand its Unlad Lokal MSME program deeper into Visayas and Mindanao in 2026, following a 200% increase in sales for local sellers in 2025 and having trained over 25,000 Filipino entrepreneurs. The company is investing in regional influencer networks and social commerce infrastructure to sustain discovery-led commerce growth beyond Metro Manila.
- March 2026: Pandamart (foodpanda Philippines / Delivery Hero SE) transitioned to 24/7 nationwide dark-store operations, becoming the first online-only full grocery platform in the Philippines to offer round-the-clock delivery. The service operates across dark-store nodes in Metro Manila, Baguio, Pampanga, Cebu, and Davao, with a full SKU assortment including fresh produce, raw meats, frozen seafood, and household essentials.
- February 2026: Shopee Philippines expanded its Fulfilled by Shopee logistics program into Visayas and Mindanao, reducing average delivery times from approximately 7 days to 3-4 days across the two island groups. The expansion is expected to support approximately 1,500 jobs by end-2026 across platform operations and seller enablement functions.
- January 2026: TikTok Shop Philippines officially reported that Filipino local sellers achieved over 200% sales growth in 2025 through the platform's live commerce and discovery-led model, with the SarilingAtin campaign driving a 230% increase in local product sales. Over 25,000 entrepreneurs participated in TikTok Shop capacity-building programs in partnership with the Department of Trade and Industry.


Philippines Quick Commerce Market Report Scope
The Philippines Quick Commerce Market refers to the rapidly growing sector of ultra-fast, on-demand retail and delivery services, where goods such as groceries, food, household essentials, and small consumer products are ordered online and delivered within a short time frame, often within an hour.
The Philippines Quick Commerce Market Report is Segmented by Product Category (Grocery and Staples, Fresh Produce and Dairy, Snacks and Beverages, Personal Care and OTC Pharma, Home and Cleaning Supplies, Electronics and Accessories, Pet Care, Flowers and Gifts, and More), and Delivery Time Promise (Less than 10 Minutes, 11-30 Minutes, and 31-60 Minutes and More). The Market Forecasts are Provided in Terms of Value (USD).
| Grocery and Staples |
| Fresh Produce and Dairy |
| Snacks and Beverages |
| Personal Care and OTC Pharma |
| Home and Cleaning Supplies |
| Electronics and Accessories |
| Pet Care |
| Flowers and Gifts |
| Other Product Categories |
| Less than 10 Minutes |
| 11-30 Minutes |
| 31-60 Minutes and More |
| By Product Category | Grocery and Staples |
| Fresh Produce and Dairy | |
| Snacks and Beverages | |
| Personal Care and OTC Pharma | |
| Home and Cleaning Supplies | |
| Electronics and Accessories | |
| Pet Care | |
| Flowers and Gifts | |
| Other Product Categories | |
| By Delivery Time Promise | Less than 10 Minutes |
| 11-30 Minutes | |
| 31-60 Minutes and More |


Key Questions Answered in the Report
What is the current size and forecast value of the Philippines quick commerce market?
The Philippines quick commerce market was valued at USD 435.55 million in 2025 and is forecast to reach USD 624.86 million by 2031, growing at a 6.20% CAGR from 2026 to 2031.
Which product category leads demand in the Philippines quick commerce space?
Grocery and Staples led demand with a 53.48% share in 2025, showing that essential goods remain the main order driver for fast delivery platforms.
Which product category is growing the fastest through 2031?
Pet Care is the fastest-growing product category, with a projected CAGR of 6.56% through 2031, supported by rising urban pet ownership and broader SKU expansion.
What delivery window is most common in the Philippines?
The 11-30 Minutes promise tier held the largest share at 56.25% in 2025 because it offers the best balance between speed and operational feasibility.
What is the biggest challenge for operators in this space?
High last-mile logistics costs remain the biggest challenge, especially in congested urban areas, where delivery economics are pressured by traffic, routing inefficiency, and limited ability to pass costs to consumers.
Page last updated on:


