United States Quick Commerce Market Size and Share
Market Overview
| Study Period | 2020 - 2031 |
|---|---|
| Forecast Data Period | 2026 - 2031 |
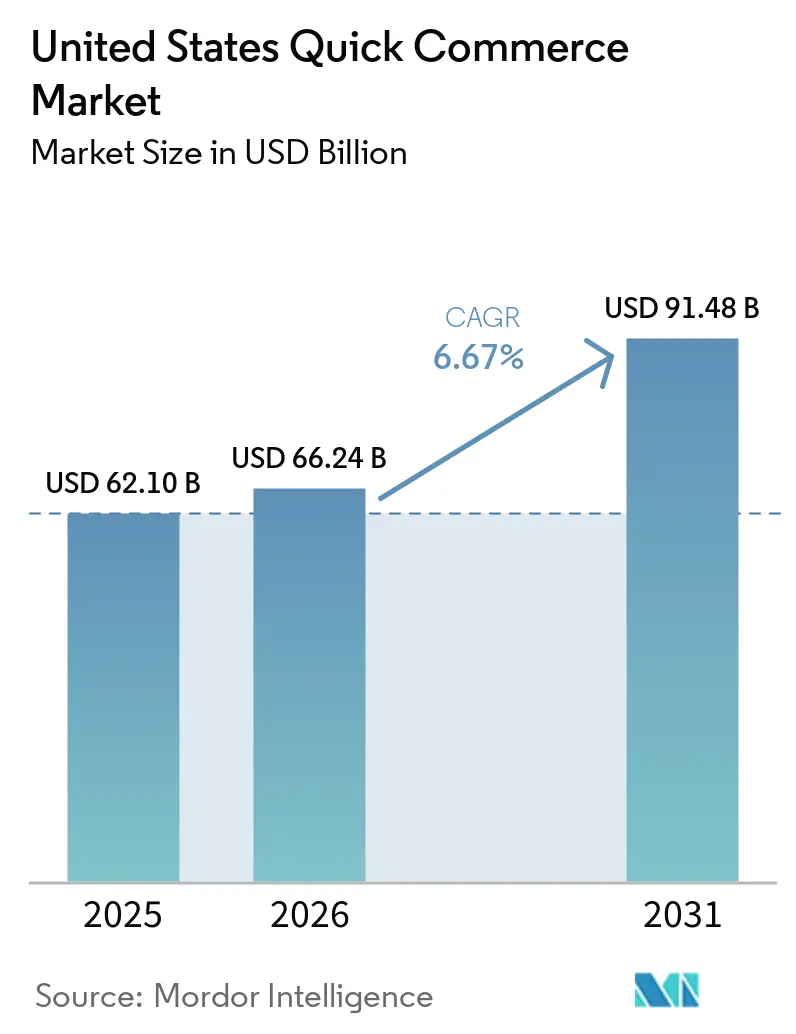
| Base Year Market Size (2025) | USD 62.10 Billion |
| Market Size (2026) | USD 66.24 Billion |
| Market Size (2031) | USD 91.48 Billion |
| Growth Rate (2026 - 2031) | 6.67% CAGR |
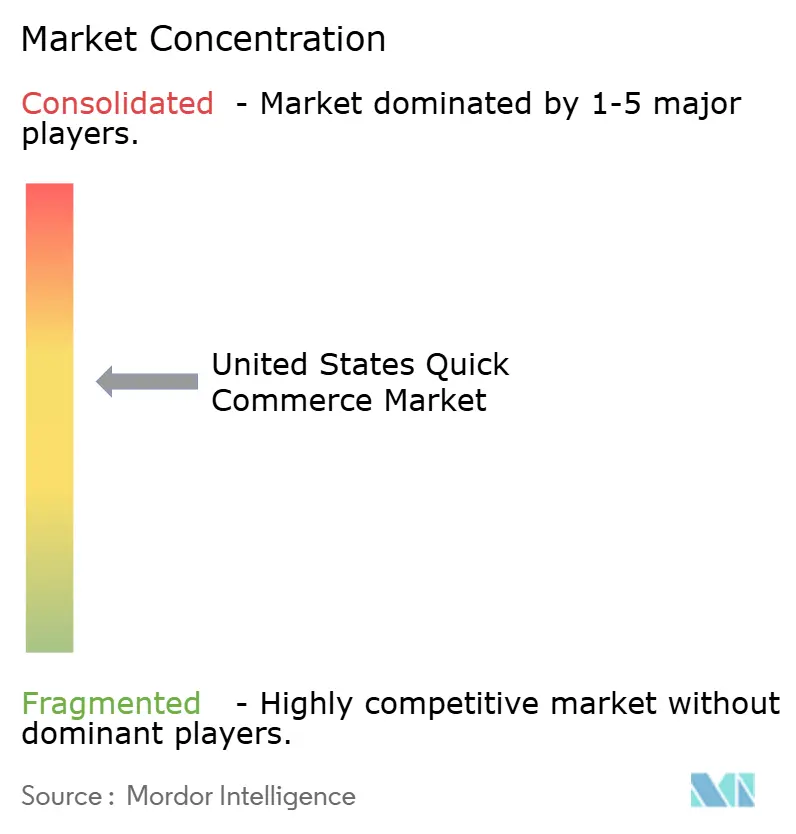
| Market Concentration | Medium |
Major Players *Disclaimer: Major Players sorted in no particular order Image © Mordor Intelligence. Reuse requires attribution under CC BY 4.0. | |
United States Quick Commerce Market Analysis by Mordor Intelligence
The United States quick commerce market was valued at USD 62.10 billion in 2025 and estimated to grow from USD 66.24 billion in 2026 to reach USD 91.48 billion by 2031, at a CAGR of 6.67% during the forecast period (2026-2031). The core shift inside the US quick commerce market is that dark stores are now the operating unit that matters most, because speed depends on where inventory sits rather than on how many shelves a retailer controls. Consumer expectations have also risen, and fast delivery now sits closer to a basic service requirement than a premium add-on for urban households. The market is also moving beyond a simple grocery convenience store, because operators are using the same local networks to support pharmacy, wellness, and higher-margin impulse purchases. Competition remains disciplined by unit economics, which means scale alone is not enough unless order density improves at the store level. That balance between customer expectations, local fulfillment density, and execution quality will continue to shape how the US quick commerce market expands through 2031.
Key Report Takeaways
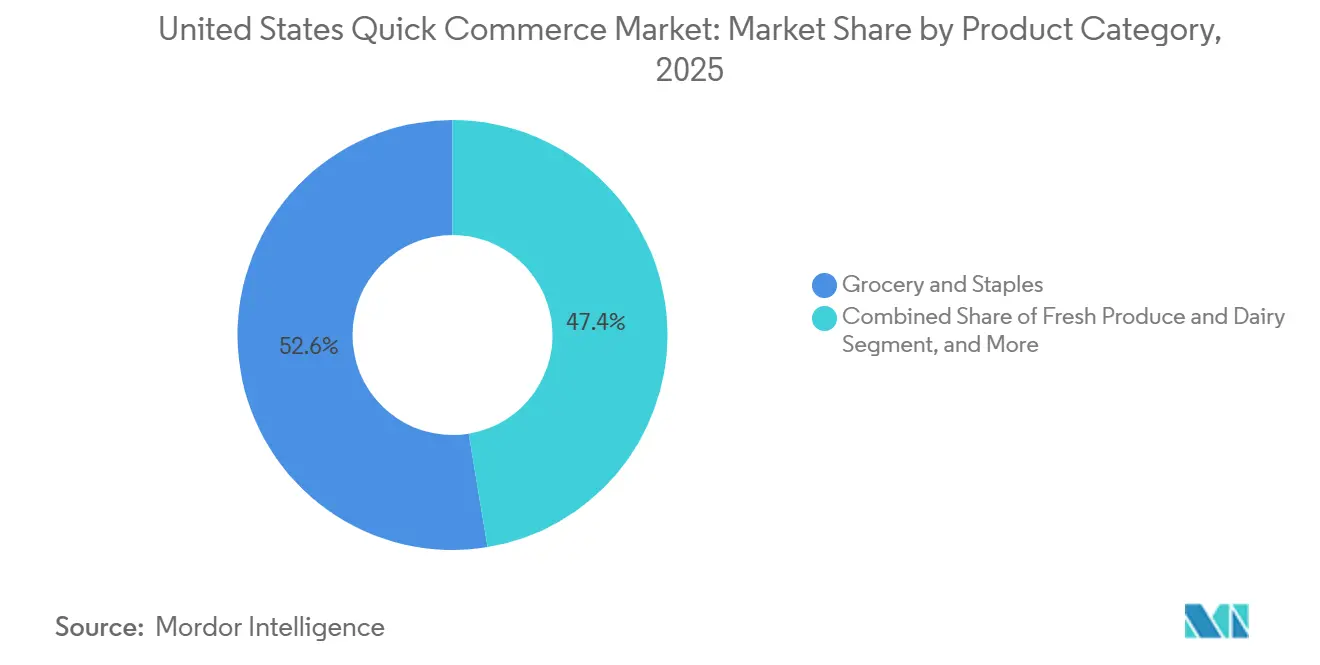
- By product category, Grocery and Staples led the United States quick commerce market with a 52.61% share in 2025, while Electronics and Accessories are projected to record the fastest growth at a 7.08% CAGR through 2031.
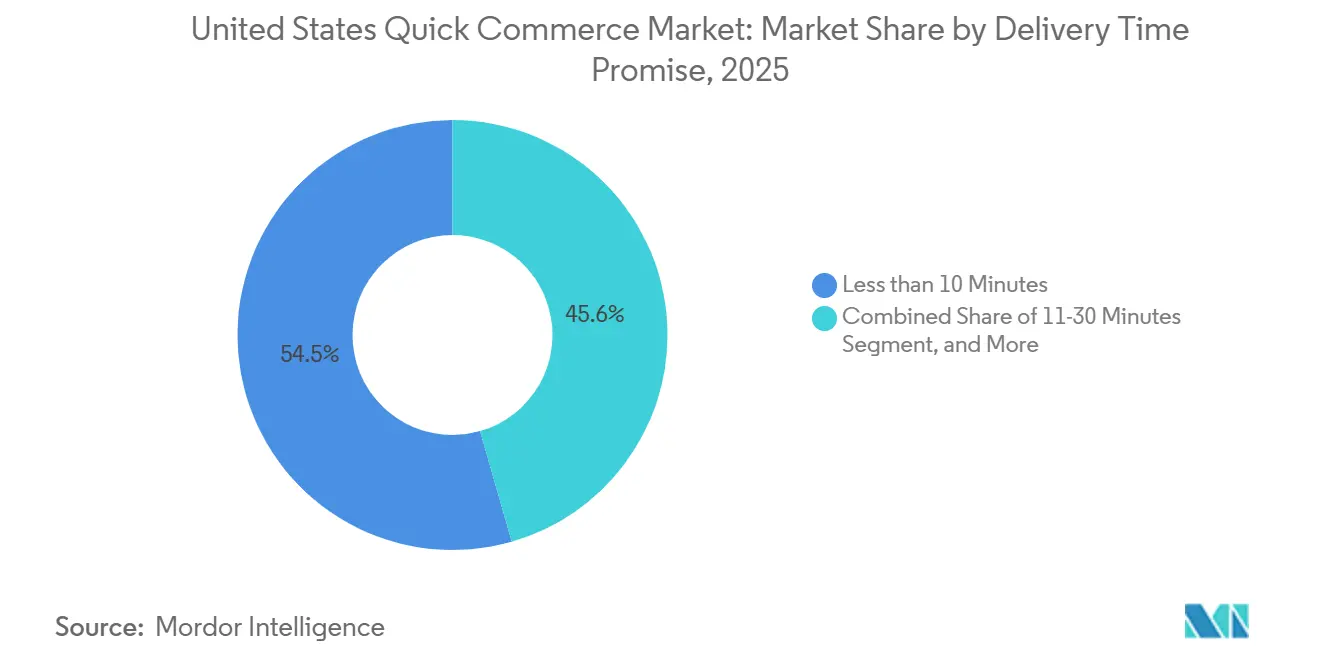
- By delivery time promise, the less-than-10-minute segment held a 54.45% share in 2025, while the 11-30-minute segment is forecast to expand at a 7.12% CAGR through 2031.
Note: Market size and forecast figures in this report are generated using Mordor Intelligence’s proprietary estimation framework, updated with the latest available data and insights as of January 2026.
United States Quick Commerce Market Trends and Insights
Drivers Impact Analysis*
| Driver | (~) % Impact on CAGR Forecast | Geographic Relevance | Impact Timeline |
|---|---|---|---|
| Rising Millennial and Gen Z Preference for Instant Gratification | +2.0% | National, concentrated in high-density metros such as New York, Los Angeles, Chicago, San Francisco, and Boston | Short term (≤ 2 years) |
| Expanding Dark-Store Networks across Major Metros | +1.5% | National, with testbed activity concentrated in Southwest and Southeast metros | Medium term (2-4 years) |
| Integration of AI-Driven Demand Forecasting for Inventory Optimization | +1.2% | National adoption, strongest in Tier I and Tier II tech-adjacent metros | Medium term (2-4 years) |
| Partnerships With C-Stores and Supermarkets to Broaden SKU Count | +0.8% | National, with highest incremental impact in suburban and Tier II markets | Short term (≤ 2 years) |
| Growth of Same-Day Prescription Delivery Regulations | +0.5% | National, with early-mover gains in California, New York, and Texas | Medium term (2-4 years) |
| Venture Capital Inflows Targeting Hyperlocal Logistics | +0.3% | National, with deal activity concentrated in California and New York | Short term (≤ 2 years) |
| Source: Mordor Intelligence | |||
Rising Millennial and Gen Z Preference for Instant Gratification
The United States quick commerce market continues to benefit from a broad shift in consumer behavior toward shorter delivery windows and higher service expectations. Younger urban shoppers now expect routine purchases to arrive with little delay, especially when the order includes groceries, personal care items, and other household items needed the same day. That change is evident in actual order behavior: Amazon stated that Prime members in the United States received more than 8 billion same-day or next-day items in 2025, and groceries and everyday essentials accounted for half of that volume. This creates a stricter service benchmark for the United States' quick commerce market, as speed failures can directly lead to switching behavior in categories with low loyalty barriers. It also raises the value of live order tracking, accurate delivery windows, and simple reorder flows, which help operators hold repeat users even when pricing stays tight. The result is that fulfillment consistency matters as much as assortment depth when platforms compete for younger consumers in the United States quick commerce market.
Expanding Dark-Store Networks Across Major Metros
The United States quick commerce market is also being lifted by a wider dark-store footprint in major metro areas, where fast fulfillment depends on a short distance between stocked inventory and the final address. Amazon Now launched across dozens of US cities in May 2026 and used 5,000- to 10,000-square-foot micro-fulfillment centers to support deliveries in 30 minutes or less. That rollout shows how the United States quick commerce market is moving from pilot activity toward a more durable local infrastructure model. The same buildout changes the real estate equation, because operators can use smaller urban and suburban footprints to serve dense order pockets without relying on large-format retail locations. It also underscores the importance of per-site order density, since the value of a dark store lies in throughput rather than geographic coverage alone. As more networks fill in major metros, competitive advantage will depend less on opening new nodes and more on extracting higher-order volume from each existing site in the United States quick commerce market.
Integration of AI-Driven Demand Forecasting for Inventory Optimization
AI-led inventory planning is becoming a core operating tool in the United States quick commerce market because fast delivery only works when the right items are available at the right time in a limited local assortment. Operators are increasingly treating software as part of the fulfillment stack rather than a back-office add-on, especially when managing high-frequency baskets with a narrow tolerance for substitutions. Gopuff said in November 2025 that fresh capital would support investments in AI, infrastructure, and customer experience, signaling where pure-play operators see their next layer of operating leverage. In practical terms, better forecasting improves in-stock rates for the items customers reorder most often, which directly supports conversion, repeat purchases, and basket confidence. It also reduces waste from overstocking perishables and lowers service friction caused by canceled or partially fulfilled orders. This is why the United States quick commerce market increasingly rewards operators that can align local demand signals, replenishment timing, and assortment planning within a single operating loop.
Partnerships With C-Stores and Supermarkets to Broaden SKU Count
Partnerships with convenience stores, grocers, and adjacent retail chains are widening the product range available through the United States quick commerce market without forcing every platform to own all inventory. These arrangements help solve a basic limitation of the standalone dark-store model, which is that a tightly curated assortment can cap basket size and reduce customer relevance across more shopping missions. DoorDash expanded SNAP and EBT access with Dollar General in March 2026, bringing eligible payment access to more than 16,000 stores on its marketplace and widening essential goods reach through a national retail footprint.[1]DoorDash, “DoorDash and Dollar General Partner to Unlock Unprecedented Food Access for SNAP Customers,” DoorDash, about.doordash.com That kind of partnership also improves suburban reach, where a local store base can support faster coverage than a dedicated micro-fulfillment buildout. It creates a broader cross-sell path as well, because customers who begin with urgent food or household needs can move into adjacent categories without leaving the platform. Over time, those retailer alliances should help the United States quick commerce market support higher order values and better retention without requiring uniform capital intensity across operators.
Restraints Impact Analysis*
| Restraint | (~) % Impact on CAGR Forecast | Geographic Relevance | Impact Timeline |
|---|---|---|---|
| Thin Gross Margins Versus Traditional E-Grocery Models | -2.0% | National, most acute in suburban Tier II and Tier III markets with insufficient order density | Long term (≥ 4 years) |
| High Last-Mile Delivery Costs In Low-Density Suburbs | -1.5% | National, with the structural gap widest in suburban and exurban markets outside major metro rings | Medium term (2-4 years) |
| Persistent Labor Shortages For Gig Drivers | -0.8% | National, most disruptive in coastal metros with stricter gig-worker rules | Short term (≤ 2 years) |
| Municipal Restrictions on Micro-Fulfillment Centers | -0.3% | Northeast and West Coast cities, with spillover risk in Mid-Atlantic and Great Lakes metros | Medium term (2-4 years) |
| Source: Mordor Intelligence | |||
Thin Gross Margins Versus Traditional E-Grocery Models
Thin gross margins remain one of the clearest limits on the United States quick commerce market, because very fast delivery leaves little room to spread labor and routing costs across multiple orders. The basic issue is that speed can raise customer value while still weakening unit economics if orders are dispatched one by one and baskets remain small. This is why several operators are trying to pair delivery income with other revenue streams, such as subscriptions, merchant services, and advertising, rather than relying solely on transaction fees. Gopuff’s November 2025 funding round reflected that pressure, as the company tied new capital directly to AI, infrastructure, and customer experience rather than to simple footprint expansion. The margin problem is even more pronounced when a dark store falls short of the order volume needed to cover fixed operating costs throughout the day. For that reason, the United States quick commerce market is likely to favor models that extend their local networks across grocery, wellness, household essentials, and pharmacy rather than those built around a single, narrow demand mission.
High Last-Mile Delivery Costs In Low-Density Suburbs
High last-mile costs in low-density suburbs are a second major brake on the United States quick commerce market because short routes become less efficient when stops are spread out, and order clusters are inconsistent. Dense urban areas can support rapid dispatch with tighter radii, but suburban areas often require more driver time per completed order. That makes pricing harder, since customers still compare delivery fees against a personal car trip to a nearby store. The problem matters more as operators move outward from Tier I cores into the broader suburban rings where future demand is growing but route density remains uneven. It also helps explain why retailer partnerships matter so much: an existing store network can shorten travel distances and reduce the capital required for new fulfillment nodes. Until those suburban orders reach a more stable volume pattern, the United States quick commerce market will continue to face a clear cost gap between where demand is growing fastest and where fast delivery is easiest to operate.
*Our forecasts treat driver/restraint impacts as directional, not additive. The impact forecasts reflect baseline growth, mix effects, and variable interactions.
Segment Analysis
By Product Category: Grocery Core Supports Order Frequency While Electronics Extends The Mission
Grocery and Staples held 52.61% share of the United States quick commerce market size in 2025, and that category remained the foundation of repeat ordering across the sector. The reason is simple, because milk, bread, eggs, pantry items, and other household basics generate the most dependable replenishment behavior. In the United States quick commerce market, that recurring grocery demand justifies local inventory placement and helps operators hold the order density needed for other categories to ride on the same network. Fresh Produce and Dairy, Snacks and Beverages, and Personal Care and OTC Pharma also benefit from the same convenience logic, but each category has different operating requirements around shelf life, handling, or compliance. Home and Cleaning Supplies and Pet Care add stability because both categories involve recurring needs and customer routines that align with subscription and reorder models.
Flowers and Gifts sit on a different demand curve, but they still fit the United States quick commerce market because urgency often matters more than a wide assortment in last-minute purchase occasions. Electronics and Accessories is forecast to grow at the fastest pace, with a 7.08% CAGR from 2026 to 2031, indicating that the category is moving from a niche add-on to a more normalized quick-delivery purchase. This part of the United States quick commerce industry benefits from replacement urgency, since chargers, cables, earbuds, and small peripherals are often needed immediately and are easy to carry through local networks. It also works well with the broader shift toward wellness and health-related baskets, because platforms are widening their role beyond food-only demand. The FDA’s final rule on Additional Conditions for Nonprescription Use created a new class of nonprescription products that can be marketed with additional conditions, which expands the long-term scope for digitally enabled OTC access and supports adjacent category growth.[2]Food and Drug Administration, “Final Rule on Nonprescription Drug Products With an Additional Condition for Nonprescription Use,” Federal Register, govinfo.gov


By Delivery Time Promise: Sub-10-Minute Scale Leads Revenue While 11-30-Minute Delivery Improves The Model
The less-than-10-minute segment accounted for 54.45% of the United States quick commerce market in 2025, underscoring how strongly dense metro areas rewarded ultra-fast fulfillment. That scale came from a dark-store-first model built to serve short delivery radii, where speed itself is the product. It helped the United States quick commerce market build a clear customer proposition in major cities, especially for urgent grocery and household orders. At the same time, the segment carries a structural cost challenge because very short windows limit batching and keep rider utilization tight. That is why revenue leadership in the fastest window does not automatically translate into the strongest operating model over time.
The 11-30-minutes segment is projected to grow at the fastest pace, with a 7.12% CAGR from 2026 to 2031, making it a part of the United States quick commerce market with the clearest balance between speed and sustainability. Amazon Now launched as a 30-minute-or-less service across dozens of United States cities in 2026, underscoring the commercial logic behind this delivery window. This window gives operators more room to align routing, staffing, and basket economics without stepping too far away from the convenience promise customers still value. It also supports a broader retailer set, because store-based fulfillment and hybrid local models can compete more effectively within a 20-30-minute expectation than within a sub-10-minute one. In that sense, this part of the United States quick commerce industry may become the most practical operating center of gravity as the sector shifts from pure speed signaling to more stable economics.
Geography Analysis
The Southwest led the United States quick commerce revenue in 2024, and that lead came from the combination of California’s digital adoption, Texas’s population momentum, and a large concentration of fulfillment activity. Amazon first piloted Amazon Now in Seattle in late 2025 before expanding the service across major cities, including Dallas-Fort Worth and other fast-growing metros, in 2026. Texas also stood out as a proving ground for faster fulfillment formats, while California remained central because scale, demand density, and retailer presence all supported local delivery expansion. The region’s operating advantage was not uniform, however, because permitting and siting conditions varied by state and changed where operators could place new dark stores at an acceptable cost.
The Southeast is the fastest-growing regional pocket in the United States quick commerce market, supported by population inflows, expanding logistics networks, and demand patterns that extend beyond the traditional urban core. Atlanta’s role in Amazon Now’s early rollout showed that the region is no longer only a follow-on geography for large operators, but an active launch market. DoorDash also highlighted Atlanta among the metros with strong weekday delivery growth in its 2025 State of Local Commerce report, which reinforced the city’s position as a high-frequency local commerce node. Florida adds another layer of demand variability because tourism can raise short-notice purchasing and support longer operating hours for local delivery networks. That matters for the United States quick commerce market because regions with mixed residential and visitor demand can keep couriers and inventory active across more dayparts.
The Northeast remains the most operationally complex region in the United States quick commerce market because cost and land-use rules are more restrictive than in many other parts of the country. New York’s last-mile facility text amendment process advanced through environmental review in April 2025 and targeted larger facilities near residential districts, which shows how municipal policy can shape the placement of urban fulfillment infrastructure. At the same time, the Midwest remains less penetrated than its population base would suggest, and growth there depends on better coverage for lower-income households and more practical suburban delivery formats. DoorDash said in 2025 that more than 99% of its monthly active United States consumers could access at least one SNAP-accepting store on the marketplace, which widened the serviceable base for regions where digital grocery access had been more limited.
Competitive Landscape
The United States quick commerce market shows moderate consolidation, with a limited group of scaled platforms controlling the broadest national reach while several retailer-led and specialized operators still compete effectively in local pockets. DoorDash, Instacart, and Uber Eats remain central platform ecosystems, while Amazon and Walmart bring a different model based on existing logistics assets, membership economics, and store networks. That structure means the United States quick commerce market is not a winner-takes-all arena, but it is also no longer open to lightly funded challengers that lack dense fulfillment coverage. The main divide now sits between operators that can spread local delivery costs across multiple revenue streams and those that still depend mainly on transaction margins.
Amazon’s May 2026 launch of Amazon Now across dozens of United States cities was one of the clearest strategic moves in the market, because it layered a 30-minute promise onto a broader retail and membership system that already had national scale. Amazon also said in February 2026 that Amazon Pharmacy's same-day delivery would expand to nearly 4,500 US cities by the end of the year, which showed how pharmacy and urgent household demand can share the same last-mile network.[3]Amazon.com, Inc., “Amazon Rolls Out Amazon Now to Dozens of Cities Across the U.S., Providing 30-Minute Delivery to Millions of Customers,” Business Wire, businesswire.comGopuff’s USD 250 million funding round in November 2025 was another important move, because management directed the new capital toward AI, infrastructure, and customer experience rather than only toward footprint growth. Those choices show that the United States quick commerce market increasingly values operational depth and retention tools over headline expansion alone. They also reflect a broader understanding that local fulfillment networks must serve more than one demand mission if they are going to hold margins over time.
Walmart’s partnership with IBM through Walmart GoLocal added another competitive angle, because it extended white-label same-day, next-day, and scheduled delivery capabilities to outside retailers through IBM Sterling Order Management. DoorDash’s expansion of SNAP and EBT acceptance through national retail partners also points to a competitive strategy based on access, reach, and recurring household demand rather than on speed alone. In parallel, the DEA’s temporary extension of telemedicine prescribing flexibilities through December 31, 2026 preserved a regulatory path for prescription delivery growth within existing last-mile networks. That creates space for the United States quick commerce market to move deeper into pharmacy, wellness, and regulated fulfillment without forcing every operator to build a separate delivery architecture. As a result, the next phase of competition will likely center on who can combine local density, retailer ties, compliance readiness, and category expansion into a more stable national operating model.
United States Quick Commerce Industry Leaders
DoorDash Inc.
Uber Technologies Inc.
Amazon.com Inc.
GoBrands, Inc.
Maplebear Inc.
- *Disclaimer: Major Players sorted in no particular order

Recent Industry Developments
- May 2026: Amazon launched Amazon Now, a 30-minute-or-less delivery service, across dozens of US cities including Atlanta, Dallas-Fort Worth, Philadelphia, Seattle, Austin, Denver, Houston, Minneapolis, and Phoenix. The service uses a network of 5,000-10,000-square-foot micro-fulfillment centers and operates 24 hours in most markets. Amazon targets tens of millions of customers by year-end 2026.
- March 2026: Amazon celebrated one year of the re-entry of two-hour grocery delivery partnerships with Cardenas Markets across California and Nevada, extending its quick commerce network into Hispanic-focused grocery segments and demonstrating the platform's category diversification strategy at the regional level.
- March 2026: DoorDash and Dollar General launched a partnership enabling SNAP and EBT payments at over 16,000 Dollar General stores on the DoorDash Marketplace, nearly doubling DoorDash's network of SNAP-accepting stores to over 35,000. This expanded food access for approximately 2.4 million DoorDash customers with SNAP or EBT cards linked to their accounts.
- November 2025: Gopuff raised a USD 250 million funding round led by Eldridge Industries and Valor Equity Partners. The company cited record revenue, contribution profit, and sustained core business growth, directing proceeds toward AI, consumer experience, and infrastructure expansion.


United States Quick Commerce Market Report Scope
The United States Quick Commerce Market refers to the rapidly growing sector of ultra-fast delivery services in the United States, characterized by companies that fulfill online orders, primarily groceries, convenience items, and household essentials, within a short time frame, often under 30 minutes.
The United States Quick Commerce Market Report is Segmented by Product Category (Grocery and Staples, Fresh Produce and Dairy, Snacks and Beverages, Personal Care and OTC Pharma, Home and Cleaning Supplies, Electronics and Accessories, Pet Care, Flowers and Gifts, and More), and Delivery Time Promise (Less than 10 Minutes, 11-30 Minutes, and 31-60 Minutes and More). The Market Forecasts are Provided in Terms of Value (USD).
| Grocery and Staples |
| Fresh Produce and Dairy |
| Snacks and Beverages |
| Personal Care and OTC Pharma |
| Home and Cleaning Supplies |
| Electronics and Accessories |
| Pet Care |
| Flowers and Gifts |
| Other Product Categories |
| Less than 10 Minutes |
| 11-30 Minutes |
| 31-60 Minutes and More |
| By Product Category | Grocery and Staples |
| Fresh Produce and Dairy | |
| Snacks and Beverages | |
| Personal Care and OTC Pharma | |
| Home and Cleaning Supplies | |
| Electronics and Accessories | |
| Pet Care | |
| Flowers and Gifts | |
| Other Product Categories | |
| By Delivery Time Promise | Less than 10 Minutes |
| 11-30 Minutes | |
| 31-60 Minutes and More |


Key Questions Answered in the Report
What is the size outlook for the United States quick commerce market through 2031?
The United States quick commerce market stands at USD 66.24 billion in 2026 and is forecast to reach USD 91.48 billion by 2031, growing at a 6.67% CAGR.
Which product category currently leads quick commerce demand in the United States?
Grocery and Staples led with a 52.61% share in 2025 because replenishment purchases create the highest repeat order frequency.
Which delivery window is growing fastest in United States quick commerce?
The 11-30-minute segment is expected to grow the fastest at a 7.12% CAGR through 2031, as it offers a better balance between speed and unit economics.
What is the main profitability challenge for quick commerce platforms in the United States?
Thin margins and high last-mile costs remain the biggest issues, especially outside dense urban cores where delivery routes are less efficient.
How are large companies responding to competition in this space?
Amazon is expanding Amazon Now and same-day pharmacy delivery, DoorDash is widening retail and SNAP access, and Walmart is extending GoLocal capabilities through IBM integration.
Page last updated on:


