Pharmerging Market Size and Share
Market Overview
| Study Period | 2019 - 2030 |
|---|---|
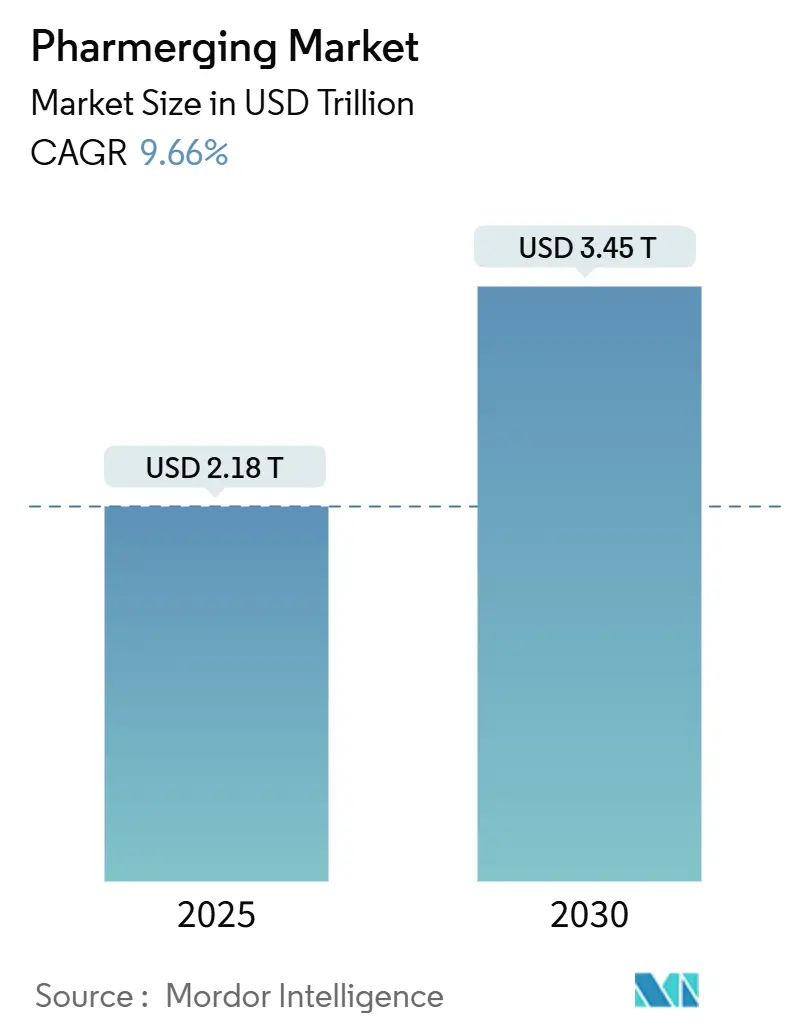
| Market Size (2025) | USD 2.18 Trillion |
| Market Size (2030) | USD 3.45 Trillion |
| Growth Rate (2025 - 2030) | 9.66% CAGR |
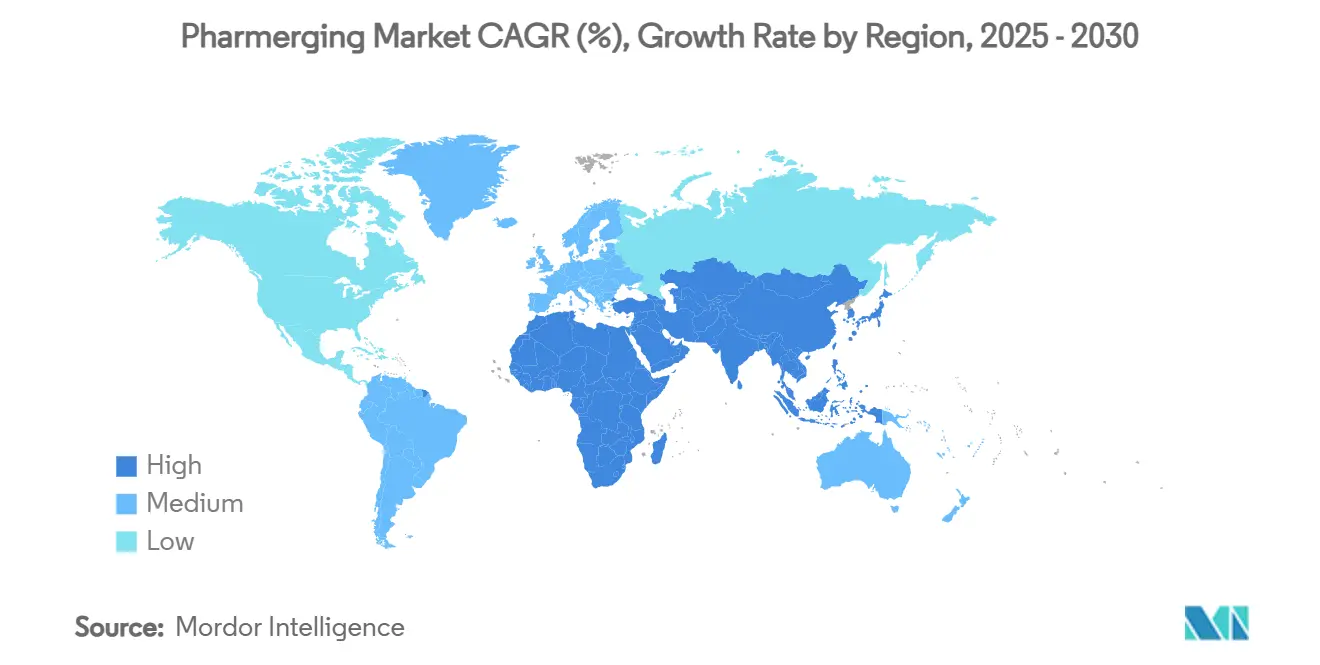
| Fastest Growing Market | Asia Pacific |
| Largest Market | Asia Pacific |
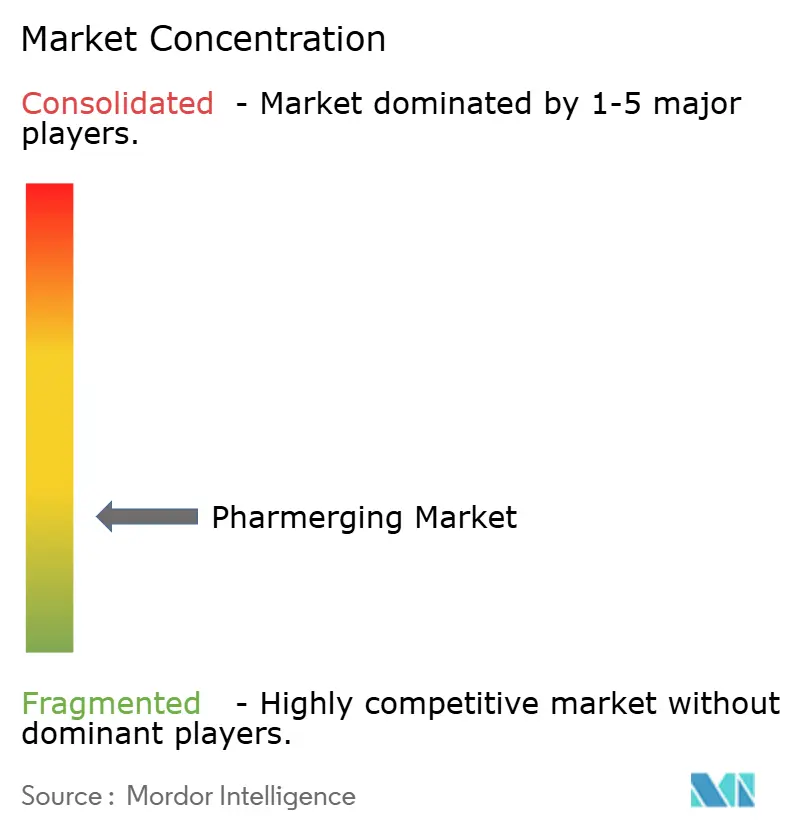
| Market Concentration | Low |
Major Players *Disclaimer: Major Players sorted in no particular order Image © Mordor Intelligence. Reuse requires attribution under CC BY 4.0. | |
Pharmerging Market Analysis by Mordor Intelligence
The Pharmerging Market size is estimated at USD 2.18 trillion in 2025, and is expected to reach USD 3.45 trillion by 2030, at a CAGR of 9.66% during the forecast period (2025-2030).
Economic expansion, expanding healthcare infrastructure, and demographic shifts across emerging economies underpin this trajectory as these nations account for more than 85% of the global population. Policymakers are reinforcing universal health coverage, while multinational corporations relocate manufacturing and R&D to cost-advantaged regions, further intensifying demand. Rapid urbanization fuels chronic-disease prevalence, prompting higher long-term medication use, and digital health adoption widens patient access, especially in rural areas. Cold-chain bottlenecks and price controls temper growth but have spurred innovation in distribution networks and margin management strategies.
Key Report Takeaways
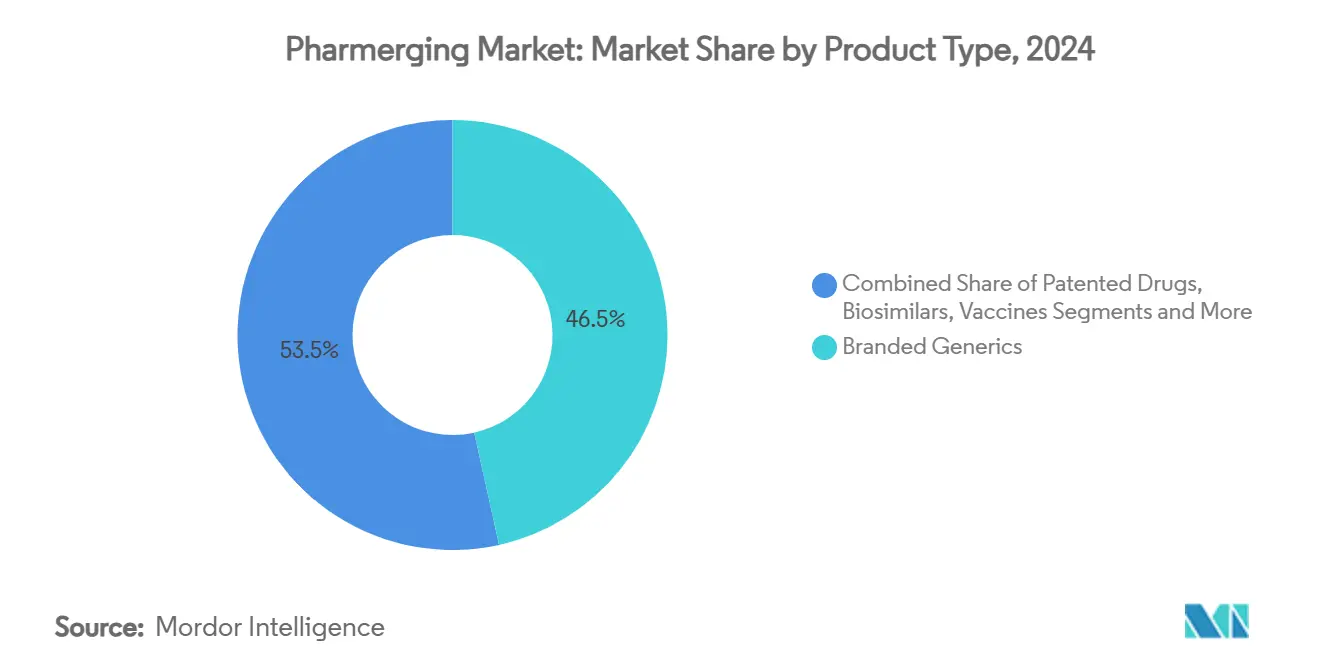
- By product type, branded generics led with 46.53% revenue share in 2024; biosimilars are forecast to expand at a 12.48% CAGR to 2030.
- By therapeutic area, anti-infectives accounted for 21.36% share of the pharmerging market size in 2024, while oncology is advancing at an 11.67% CAGR through 2030.
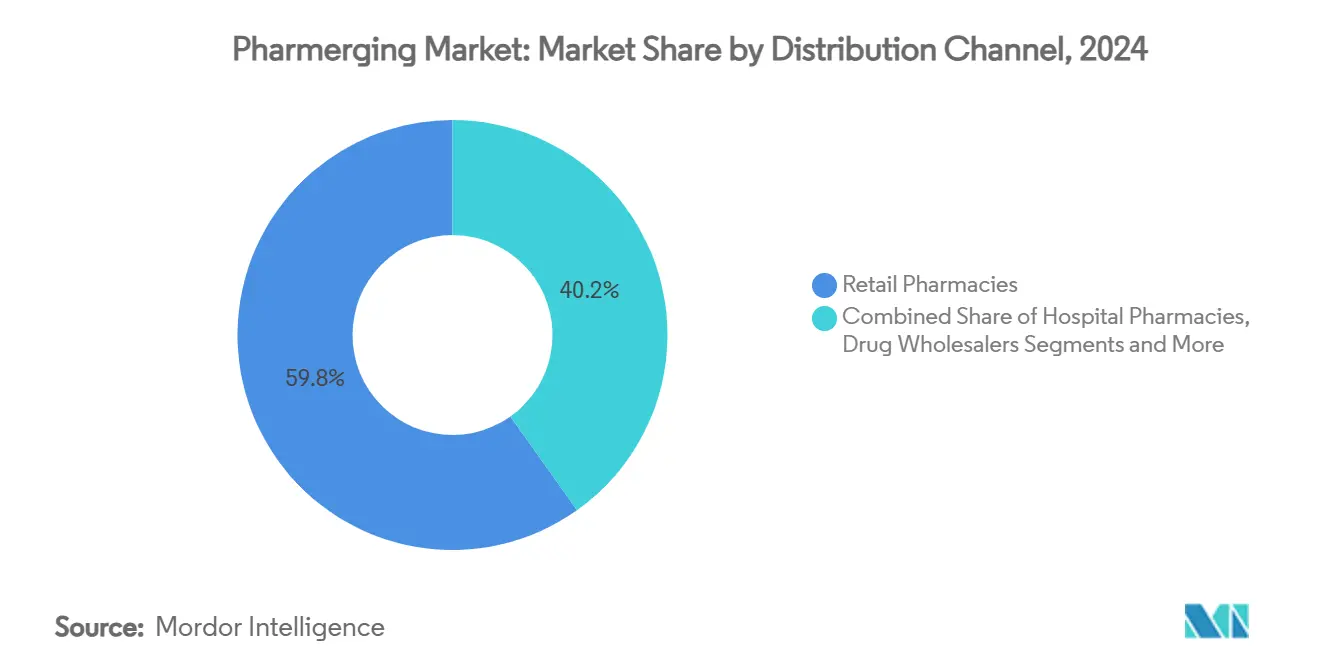
- By distribution channel, retail pharmacies held 59.84% of the pharmerging market share in 2024, whereas e-commerce platforms are projected to grow at 13.08% CAGR to 2030.
- By formulation, solid oral drugs commanded 51.23% share in 2024, but injectables are poised to expand at a 12.01% CAGR through 2030.
- By geography, Asia-Pacific controlled 39.61% of the pharmerging market share in 2024 and is set to post an 11.89% CAGR to 2030.
Global Pharmerging Market Trends and Insights
Drivers Impact Analysis*
| Driver | (~) % Impact on CAGR Forecast | Geographic Relevance | Impact Timeline |
|---|---|---|---|
| Rapid Economic Growth & Rising Healthcare Spend | +2.1% | Global, strongest in APAC and Latin America | Medium term (2-4 years) |
| Growing Chronic-Disease Burden | +1.8% | Global, pronounced in urbanizing regions | Long term (≥ 4 years) |
| Expansion Of Universal Health Coverage | +1.5% | APAC core, spill-over to MEA and Latin America | Long term (≥ 4 years) |
| Shift Of Pharma Manufacturing & R&D To Emerging Markets | +1.3% | APAC manufacturing hubs, R&D in India and China | Medium term (2-4 years) |
| Govt Incentives For Local Vaccine/Biologic Production | +0.9% | Africa, Latin America, selective APAC markets | Medium term (2-4 years) |
| Digital Health & E-Pharmacy Penetration | +0.7% | Urban centers globally, fastest in APAC | Short term (≤ 2 years) |
| Source: Mordor Intelligence | |||
Rapid Economic Growth & Rising Healthcare Spend
Emerging economies are translating steady GDP expansion into higher per-capita health outlays, increasing both insurance coverage and out-of-pocket purchases. The World Bank seeks to extend health services to 1.5 billion people by 2030, emphasizing public-private partnerships that spur local drug production.[1]World Bank Group, “World Bank Group Aims to Expand Health Services to 1.5 Billion People,” worldbank.org Nigeria’s USD 3 billion National Health Sector Renewal plan earmarks more than USD 1 billion for domestic manufacturing, illustrating the multiplier effect between economic vigor and pharmaceutical demand in the pharmerging market. Saudi Arabia expects its localization agenda to create 11,000 jobs by 2030 and add USD 34.6 billion to non-oil GDP, further cementing a stable consumption base. Rising disposable income enables middle-class households to upgrade therapies, reinforcing steady volume expansion even during cyclical downturns.
Growing Chronic-Disease Burden
Lifestyle changes and aging demographics are shifting the disease mix from infectious to chronic conditions that necessitate prolonged medication courses. Pakistan’s coverage gap—one-third of children remain unvaccinated—shows how socioeconomic status shapes health outcomes.[2]Elias Mossialos, “Pakistan's Path to Universal Health Coverage: National and Regional Insights,” International Journal for Equity in Health, doi.org Urban diets and sedentary habits accelerate diabetes, cardiovascular, and respiratory cases, increasing demand for higher-value drugs such as fixed-dose combinations and personalized regimens. Indonesia’s universal health insurance scheme faces a 20 trillion rupiah deficit as claims outpace contributions, underscoring the fiscal weight of chronic ailments. This epidemiologic pivot sustains long-term revenue streams for firms able to meet complex therapy needs, particularly in the pharmerging market.
Expansion of Universal Health Coverage
Governments are institutionalizing pharmaceutical access through national insurance programs, stabilizing volumes and standardizing procurement. Egypt’s Universal Health Insurance beneficiaries report improved satisfaction and access, demonstrating direct linkage between coverage and medication uptake.[3]Ahmed Mahmoud Fouad, “Effect of Universal Health Insurance Implementation on Beneficiaries' Evaluation of Public Health Facilities in Egypt,” International Journal for Equity in Health, doi.org Kenya’s 2020-2030 UHC policy outlines comprehensive care improvements, expanding formularies and tender transparency. Cambodia’s gradual UHC roll-out mirrors many pharmerging market paths: incremental, yet catalytic for predictable drug demand. Harmonized essential-medicines lists simplify market entry and forecasting for manufacturers while supporting budget allocations insulated from private-sector volatility.
Shift of Pharma Manufacturing & R&D to Emerging Markets
Lower production costs, proximity to fast-growing demand centers, and regulatory incentives are redirecting global supply chains. Sanofi’s USD 437 million Hyderabad expansion will more than double headcount to 2,600 by 2026. India’s CRDMO sector is projected to reach USD 25 billion by 2035, fueled by cost-competitive research services. China’s new domestic responsible-person rule reshapes foreign MNC structures, embedding accountability within local subsidiaries. Resulting technology transfer boosts local capacity, shortens lead times, and diversifies global sourcing risk.
Restraints Impact Analysis*
| Restraint | (~) % Impact on CAGR Forecast | Geographic Relevance | Impact Timeline |
|---|---|---|---|
| Price Controls & Mandatory Generics Policies | -1.4% | Global, most pronounced in Latin America and APAC | Long term (≥ 4 years) |
| Weak Intellectual-Property Enforcement | -0.9% | Sub-Saharan Africa, selective APAC markets | Medium term (2-4 years) |
| Fragmented Distribution Networks & Cold-Chain Losses | -0.7% | Rural areas globally, critical in MEA and Latin America | Medium term (2-4 years) |
| Rising Pharmacovigilance Compliance Costs | -0.5% | Global, higher impact on smaller manufacturers | Short term (≤ 2 years) |
| Source: Mordor Intelligence | |||
Price Controls & Mandatory Generics Policies
Ceiling prices and reference-pricing schemes curtail revenue growth for innovative drugs. India’s caps have squeezed smaller local firms, inadvertently advantaging large multinationals able to absorb reduced margins. Brazil’s average 3.8% drug-price increase in 2025, below inflation, intensifies cost pressure. South Korea’s tiered generic pricing lowered entrant counts and widened price disparities, showing unintended consolidation effects. Firms must calibrate portfolios toward cost-effective molecules and biosimilars to offset shrinking spreads and support the pharmerging market growth.
Weak Intellectual-Property Enforcement
Patchy patent protection deters high-value R&D investment and fuels counterfeit proliferation. In China, 73.1% of drugs received approval before patent filing, and 85.1% of generic applications lacked patent listings, encouraging copycat activity. India’s new IP divisions streamline adjudication, yet enforcement consistency remains elusive. Brazil’s Supreme Court rulings on patent duration introduce further uncertainty. Defensive strategies include accelerated life-cycle management and localization of manufacturing to lessen exposure.
*Our forecasts treat driver/restraint impacts as directional, not additive. The impact forecasts reflect baseline growth, mix effects, and variable interactions.
Segment Analysis
By Product Type: Branded Generics Hold Sway While Biosimilars Surge
Branded generics captured 46.53% of the pharmerging market share in 2024, underscoring value-oriented purchasing by governments and consumers. Patent expirations of 117 blockbuster molecules in Brazil by 2028 are set to expand the biosimilar opportunity pool, lifting the segment at a 12.48% CAGR. The pharmerging market size for biosimilars is projected to accelerate as local producers exploit cost advantages, regulatory fast-tracks, and established biologic demand. Vaccines attract policy-driven investment because local supply is viewed as a strategic imperative, exemplified by the USD 750 million African accelerator. Patented drugs continue to command premiums in oncology and rare-disease niches, yet rising price scrutiny encourages lifecycle extensions and co-pay support programs to preserve volumes.
The economics behind biosimilars’ ascent mirror lower development costs—USD 10-20 million and 3-5-year timelines in India—versus originator biologics, fueling rapid capacity build-out. OTC segments grow steadily as middle-class consumers embrace self-medication, further diversifying revenue. Competition intensifies as technology transfer and joint ventures proliferate, prompting brand differentiation through pharmacovigilance quality and patient-support services.


By Therapeutic Area: Oncology Accelerates, Anti-Infectives Retain Scale
Anti-infectives maintained 21.36% share of the pharmerging market size in 2024, reflecting persistent infectious-disease burdens. Simultaneously, oncology outpaced all other areas at an 11.67% CAGR driven by aging populations, earlier diagnostics, and expanded reimbursement. Cardiovascular and diabetes drugs follow closel y, propelled by urban dietary shifts and sedentary lifestyles. Respiratory therapies benefit from rising pollution awareness, while rare-disease treatments move from niche to emerging frontier as regulatory incentives gain traction across the pharmerging market landscape.
China’s approval of Socazolimab underscores growing domestic innovation in immuno-oncology. ViiV Healthcare’s plan to triple long-acting HIV PrEP supply to low-income regions illustrates a pivot to long-term regimens tailored for pharmerging market access. Diversifying pipelines toward chronic-disease management helps firms maintain relevance across therapeutic spectra and hedge against anti-infective commoditization.
By Distribution Channel: Digital Platforms Redefine Reach
Retail pharmacies accounted for 59.84% of the pharmerging market sales in 2024, yet e-commerce channels are set to rise at 13.08% CAGR, spearheaded by smartphone proliferation and convenience-driven consumer habits. The pharmerging market size allocated to online channels is expanding as telemedicine scripts integrate seamlessly with digital fulfillment. Hospital pharmacies secure specialized therapies, particularly biologics, while wholesalers underpin rural penetration by aggregating fragmented outlets. Regulatory clarity remains pivotal: Saudi Arabia’s quick online-adoption underscores growth potential when guidelines evolve to assure product quality.
E-pharmacy ecosystems enable personalized adherence programs, real-time stock monitoring, and data-driven demand planning. Pandemic-era behavior shifts accelerated online onboarding, and continuing investments in cybersecurity and last-mile logistics signal durable changes in channel mix.
By Formulation: Injectables Gain on Biologics Momentum
Solid oral drugs commanded 51.23% of the pharmerging market share in 2024, favored for ease of administration and chronic therapy suitability. Injectables, however, are registering the fastest uptake at 12.01% CAGR as biologic and vaccine volumes swell. The pharmerging market size allocated to injectables grows with innovations like RFID-enabled syringes that improve traceability and simplify cold-chain oversight. Liquid orals cater to pediatric and geriatric needs where swallowing challenges persist, while transdermal and inhalation systems occupy specialized segments that promise patent differentiation.
Global capacity expansions such as Merck’s USD 1 billion North Carolina site and Pfizer’s SGD 1 billion Singapore API plant reinforce supply security for complex formulations. Firms emphasize advanced device-drug combinations, seeking superior adherence and brand stickiness in competitive categories.
Geography Analysis
Asia-Pacific accounted for 39.61% of pharmerging market share in 2024 and is forecast to post an 11.89% CAGR to 2030, leveraging vast populations, policy incentives, and manufacturing ecosystems. China’s reforms streamline approvals and lift domestic R&D capacity, while India’s Production-linked Incentive scheme stimulates greenfield builds and active-ingredient self-reliance. Southeast Asian nations deploy clinical-trial incentives, shortening timelines and localizing data packages.
North America’s emerging component, largely Mexico, benefits from nearshoring trends and NAFTA-aligned regulatory standards that facilitate U.S. export pipelines. South America gains from biosimilar investment waves and strong domestic capacity in Brazil and Argentina, though macro-economic volatility tempers risk appetite. Europe’s fringe markets such as Turkey and Russia navigate geopolitical complexity but exploit strategic positioning between major demand centers. The Middle East and Africa exhibit loftiest growth percentages yet contend with infrastructure gaps; large-scale projects like Saudi Arabia’s Vision 2030 pharma corridor aim to narrow those deficits.

Competitive Landscape
Competitive intensity is rising as local champions scale and multinationals adopt hybrid models combining global science with regional execution. Generics and biosimilar dominance by domestic firms presses incumbent margins, while originator companies defend share through value-added services and accelerated patent-cliff planning. Joint ventures and technology-transfer deals proliferate, exemplified by Boehringer-Fiocruz’s partnership in Brazil, highlighting strategic shifts within the pharmerging market.
Advanced analytics, process digitalization, and AI-guided discovery emerge as decisive differentiators, improving time-to-market and cost profiles. Regulatory harmonization across ASEAN and African blocs encourages cross-border expansion, yet patchy IP enforcement sustains legal risk. White-space opportunities in rare diseases, pediatric formulations, and smart-delivery systems attract venture funding and public-sector incentives. The General Office of China’s 2027 roadmap to modernize drug oversight signals heightened standards that reward quality and penalize laggards.
Pharmerging Industry Leaders
Pfizer Inc.
Novartis AG
Sanofi S.A.
Sun Pharmaceutical Industries Ltd.
Cipla Ltd.
- *Disclaimer: Major Players sorted in no particular order

Recent Industry Developments
- March 2025: Eli Lilly confirmed Mounjaro launches in China, India, Brazil, and Mexico by late 2025 after USD 23 billion global capacity investments since 2020.
- March 2025: Merck inaugurated a USD 1 billion HPV vaccine facility in Durham, North Carolina, integrating 3D printing and real-time analytics.
- March 2025: Bavarian Nordic released VIMKUNYA, the first single-dose chikungunya vaccine approved for individuals aged 12 years and older in the United States.


Global Pharmerging Market Report Scope
| Branded Generics |
| Patented Drugs |
| OTC Pharmaceuticals |
| Biosimilars |
| Vaccines |
| Oncology |
| Cardiovascular |
| Anti-infectives |
| Diabetes |
| Respiratory |
| Others |
| Retail Pharmacies |
| Hospital Pharmacies |
| E-commerce / Online Pharmacies |
| Drug Wholesalers |
| Solid Oral |
| Liquid Oral |
| Injectable |
| Topical & Others |
| North America | United States |
| Canada | |
| Mexico | |
| Europe | Germany |
| United Kingdom | |
| France | |
| Italy | |
| Spain | |
| Rest of Europe | |
| Asia-Pacific | China |
| Japan | |
| India | |
| Australia | |
| South Korea | |
| Rest of Asia-Pacific | |
| Middle East and Africa | GCC |
| South Africa | |
| Rest of Middle East and Africa | |
| South America | Brazil |
| Argentina | |
| Rest of South America |
| By Product Type | Branded Generics | |
| Patented Drugs | ||
| OTC Pharmaceuticals | ||
| Biosimilars | ||
| Vaccines | ||
| By Therapeutic Area | Oncology | |
| Cardiovascular | ||
| Anti-infectives | ||
| Diabetes | ||
| Respiratory | ||
| Others | ||
| By Distribution Channel | Retail Pharmacies | |
| Hospital Pharmacies | ||
| E-commerce / Online Pharmacies | ||
| Drug Wholesalers | ||
| By Formulation | Solid Oral | |
| Liquid Oral | ||
| Injectable | ||
| Topical & Others | ||
| By Geography | North America | United States |
| Canada | ||
| Mexico | ||
| Europe | Germany | |
| United Kingdom | ||
| France | ||
| Italy | ||
| Spain | ||
| Rest of Europe | ||
| Asia-Pacific | China | |
| Japan | ||
| India | ||
| Australia | ||
| South Korea | ||
| Rest of Asia-Pacific | ||
| Middle East and Africa | GCC | |
| South Africa | ||
| Rest of Middle East and Africa | ||
| South America | Brazil | |
| Argentina | ||
| Rest of South America | ||


Key Questions Answered in the Report
1. What is the current size of the pharmerging market?
The pharmerging market size reached USD 2.18 trillion in 2025 and is forecast to hit USD 3.45 trillion by 2030.
2. Which region leads the pharmerging market?
Asia-Pacific holds the largest share at 39.61% and is also the fastest-growing region with an 11.89% CAGR through 2030.
3. Which product segment is expanding fastest?
Biosimilars are projected to grow at a 12.48% CAGR due to widespread patent expirations and supportive regulatory frameworks.
4. How are digital channels affecting pharmaceutical distribution?
E-commerce pharmacies are growing at 13.08% CAGR, leveraging smartphone penetration to broaden access and reduce costs.
5. What major restraint could limit pharmerging market growth?
Price controls and mandatory generics policies can cut margins by limiting pricing flexibility, particularly in Latin America and parts of Asia.
Page last updated on:


