
Market Overview
| Study Period | 2020 - 2031 |
|---|---|
| Forecast Data Period | 2026 - 2031 |
| Base Year Market Size (2025) | USD 3.13 Billion |
| Market Size (2026) | USD 3.2 Billion |
| Market Size (2031) | USD 3.58 Billion |
| Growth Rate (2026 - 2031) | 2.28 % |
| Market Concentration | Medium |
Major Players *Disclaimer: Major Players sorted in no particular order Image © Mordor Intelligence. Reuse requires attribution under CC BY 4.0. | |
Norway Pharmaceutical Market Analysis by Mordor Intelligence
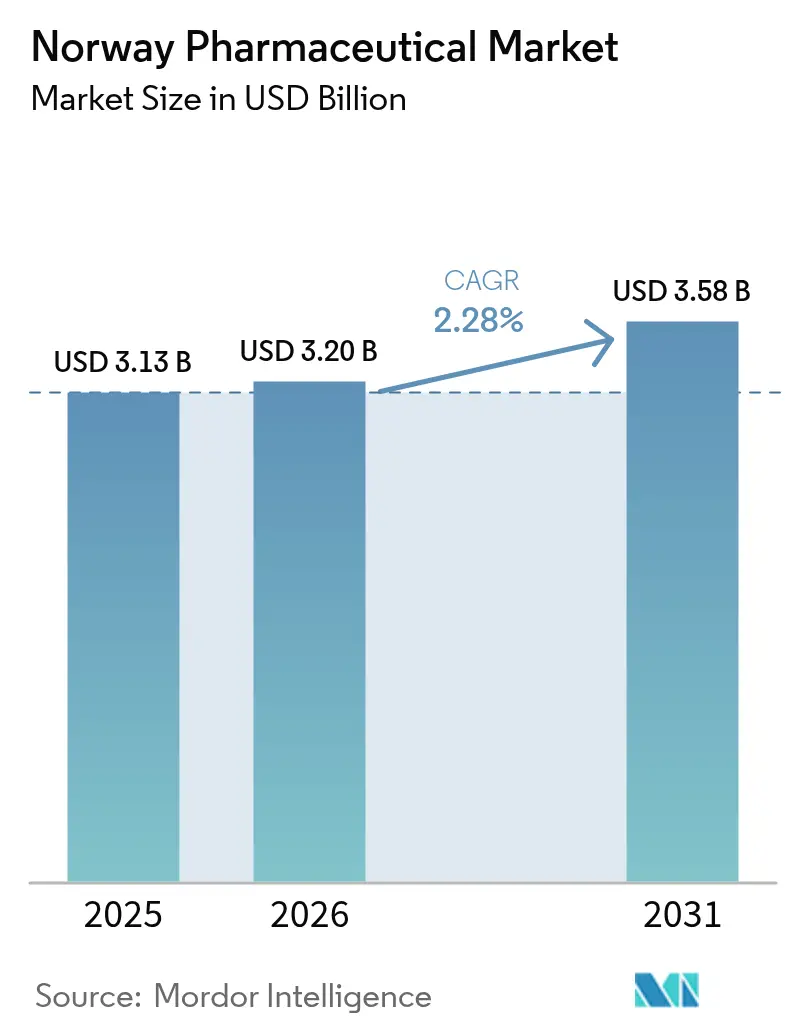
The Norway pharmaceutical market size in 2026 is estimated at USD 3.2 billion, growing from 2025 value of USD 3.13 billion with 2031 projections showing USD 3.58 billion, growing at 2.28% CAGR over 2026-2031. Controlled reimbursement ceilings, an aging population, and generous public funding form the bedrock of this restrained yet reliable growth profile. Digital prescription networks, tender‐based procurement for biologics, and strict cost-effectiveness reviews shape competition patterns while supporting the steady uptake of innovative therapies. A tight retail structure, where three vertically integrated chains run 84% of pharmacies, keeps distribution costs low even as online channels attract tech-savvy consumers. Hospital pharmacies secure high-value specialty drugs, digital pharmacies push convenience, and the NOR-SWITCH biosimilar policy compresses pricing without harming volumes. Further upside stems from early-phase clinical trial inflows into Oslo and Bergen, bio-manufacturing upgrades driven by ESG mandates, and growing demand for oncology and diabetes care.
Key Report Takeaways
- By therapeutic class, cardiovascular medicines led with 15.31% of Norway pharmaceutical market share in 2025; antineoplastic and immunomodulating agents are projected to advance at a 3.32% CAGR through 2031.
- By drug type, branded products accounted for 60.92% of the Norway pharmaceutical market size in 2025, whereas generics are expanding at a 2.74% CAGR to 2031.
- By prescription type, prescription medicines dominated with an 87.12% share in 2025; the over-the-counter segment is forecast to grow at a 2.6% CAGR up to 2031.
- By distribution channel, hospital pharmacies captured 51.05% revenue share in 2025, while online pharmacies are expected to record the fastest 3.02% CAGR to 2031.
- By route of administration, oral formulations held 54.21% of the Norway pharmaceutical market size in 2025; parenteral delivery is expanding at a 3.1% CAGR to 2031.
Note: Market size and forecast figures in this report are generated using Mordor Intelligence’s proprietary estimation framework, updated with the latest available data and insights as of 2026.
Norway Pharmaceutical Market Trends and Insights
Drivers Impact Analysis*
| Driver | (~) Impact on CAGR Forecast | Geographic Relevance | Impact Timeline |
|---|---|---|---|
| Ageing population & universal reimbursement | +0.8% | National (rural focus) | Long term (≥ 4 years) |
| Chronic-disease prevalence surge | +0.6% | National (urban burden) | Medium term (2-4 years) |
| High public spending on innovative drugs | +0.4% | Nationwide hospitals | Medium term (2-4 years) |
| Nationwide e-prescription penetration | +0.3% | National metros | Short term (≤ 2 years) |
| Biosimilar-friendly procurement reforms | +0.2% | Hospital networks | Medium term (2-4 years) |
| Rising early-phase clinical-trial inflows | +0.1% | Oslo, Bergen | Long term (≥ 4 years) |
| Source: Mordor Intelligence | |||
Ageing Population & Universal Reimbursement
Norway’s 67-plus cohort is rising steadily, lifting chronic medicine volumes as the state reimburses roughly 75% of prescription costs [1]European Observatory on Health Systems and Policies, “Norway: health system summary 2024,” eurohealthobservatory.who.int. An 85% public-funding ratio cushions demand against economic swings, and the 2025 co-payment ceiling of NOK 3,040 ensures predictable out-of-pocket spending. Drug consumption per capita climbed 29% from 2015 to 2024, with seniors accounting for the bulk of the 1.7 daily doses consumed nationwide. Blue-prescription coverage for serious illnesses further entrenches utilization, anchoring the Norway pharmaceutical market even under pricing pressure.
Chronic-Disease Prevalence Surge
Cancer projections indicate that 40% of Norwegians may develop the disease by age 80, magnifying demand for oncology biologics. Obesity affects 25% of adults, prompting high-profile reimbursement bids for drugs such as tirzepatid, priced near NOK 30,000 annually. Academic breakthroughs, including UiT’s oral-insulin program entering human trials in 2025, promise fresh growth avenues. Combination therapy in diabetes, CVD, and respiratory care is raising per-patient prescription counts, sustaining the Norway pharmaceutical market.
High Public Spending on Innovative Drugs
Cancer treatments are set to absorb 13% of total healthcare spending through 2050, with Norway’s 69% reimbursement rate for new oncology drugs outstripping the EU mean [2]OECD/European Commission, “EU Country Cancer Profile: Norway 2025,” oecd.org . The 2025 EU HTA Regulation will speed joint clinical assessments, smoothing market entry for gene and cell therapies. Precision-medicine trials such as IMPRESS-Norway embed innovation within public hospitals, keeping pipeline incentives high for multinational and domestic firms alike.
Nationwide E-Prescription Penetration
A fully integrated e-prescription system has eliminated paper scripts, simplified renewals, and improved adherence monitoring. Market leader Farmasiet posted sales above NOK 500 million in 2023, spotlighting Norway’s appetite for digital pharmacy models. AI modules governing drug–drug interaction checks and refill alerts lower medication errors, supporting higher chronic-therapy compliance and broadening the Norway pharmaceutical market.
Biosimilar-Friendly Procurement Reforms
Since 2007, annual biologic tenders have sliced therapy costs, with NOR-SWITCH validating safe interchangeability in IBD. Current guidance mandates biosimilar first-line use for new IBD patients, freeing budget for novel oncology agents. Value-based criteria now reward total-treatment savings, encouraging service packages around biosimilar delivery.
Rising Early-Phase Clinical-Trial Inflows
Phase I and II studies—from N-DOSE in Parkinson’s to INSIGHT-1 in leukemia—are proliferating, aided by Norway’s cohesive biobank system and streamlined EU Regulation 536/2014 approval paths. The resulting R&D visibility lures contract research spending and underpins future product launches, reinforcing the Norway pharmaceutical industry over the long term.
Restraints Impact Analysis*
| Restraint | (~) Impact on CAGR Forecast | Geographic Relevance | Impact Timeline |
|---|---|---|---|
| Stringent reference-price ceilings | –0.4% | National | Short term (≤ 2 years) |
| Patent-cliff revenue erosion | –0.3% | High-value classes | Medium term (2-4 years) |
| Tough API-emission regulations | –0.2% | Manufacturing, import | Medium term (2-4 years) |
| Shrinking rural pharmacy footprint | –0.1% | Northern municipalities | Long term (≥ 4 years) |
| Source: Mordor Intelligence | |||
Stringent Reference-Price Ceilings
Maximum-price rules peg drug prices to averages across nine EU peers, squeezing margins and dampening launch enthusiasm. A stepped generic-price model depresses profits further as soon as follow-ons appear. Low volumes plus tight caps compelled several pediatric antibiotics to exit the market in 2024, curbing choice and restraining the Norway pharmaceutical market.
Patent-Cliff Revenue Erosion
Twenty-seven branded molecules—from tapentadol to vismodegib—lose exclusivity between 2024–2025. Generic entry accelerates through automatic substitution, shifting revenue to low-price competitors while forcing originators to lean on pipeline assets, with knock-on effects for the Norway pharmaceutical market size outlook.
*Our forecasts treat driver/restraint impacts as directional, not additive. The impact forecasts reflect baseline growth, mix effects, and variable interactions.
Segment Analysis
By Therapeutic Class: Cardiovascular Dominance Drives Market Stability
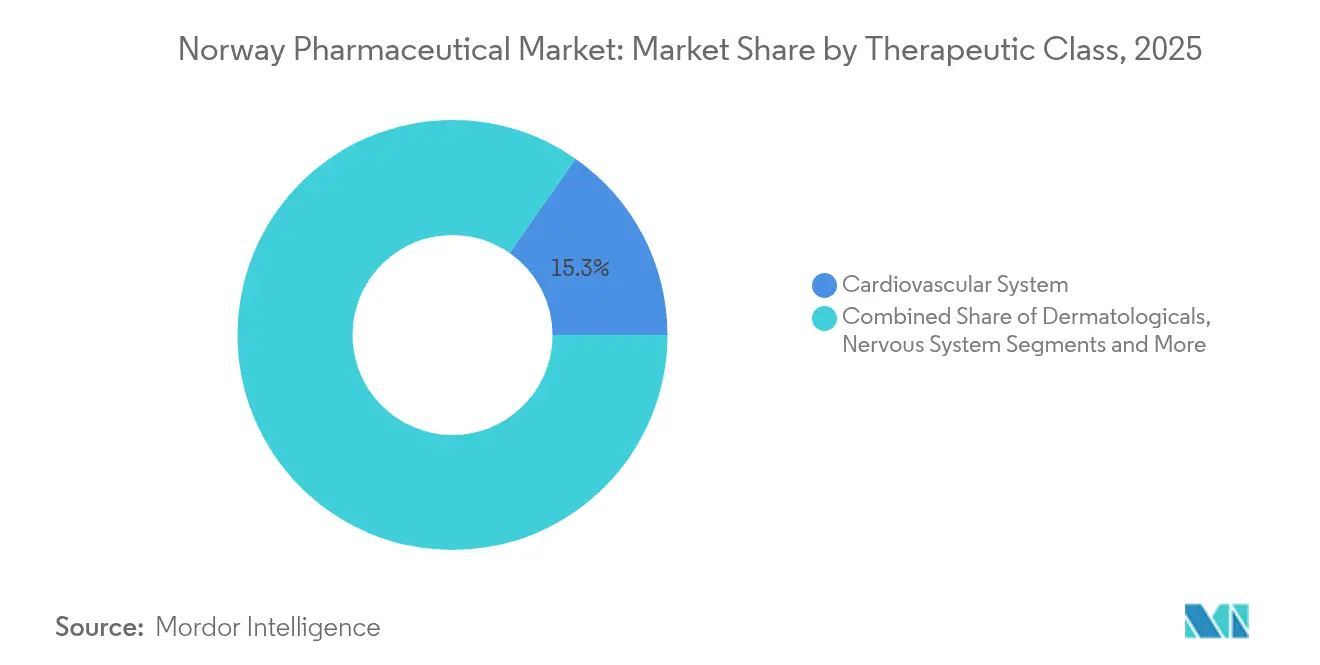
Cardiovascular drugs occupied 15.31% of the Norway pharmaceutical market in 2025, riding on widespread hypertension and lipid-control protocols. The Norway pharmaceutical market size attached to oncology and immunomodulating medicine is the fastest climber, growing at a 3.32% CAGR as full public funding for cancer therapies channels spending toward checkpoint inhibitors and CAR-T infusions. Dermatology retains stable double-digit shares through chronic eczema and psoriasis care, whereas anti-infectives feel stewardship pressure but hold hospital niches. Musculoskeletal therapies serve both active younger adults and osteoarthritis in seniors. Nervous-system prescriptions expand alongside mental-health initiatives, and respiratory products benefit from early childhood asthma management. National NORRISK 2 guidelines cement statin and ACE-inhibitor volumes, keeping cardiovascular demand predictable .
Expanded precision-oncology budgets reinforce biologic use, and public funding for gene-panel diagnostics accelerates targeted regimen adoption. Stepped generic pricing squeezes older cardiovascular brands, propelling generic ARBs yet sustaining overall revenue due to volume resilience. Norwegian oncologists quickly integrate EMA-approved biologics once HTA procedures endorse cost-effectiveness, boosting antineoplastic units.



By Drug Type: Branded Leadership Faces Generic Pressure
Branded medicines still command 60.92% of the Norway pharmaceutical market share in 2025, buoyed by specialty indications that lack substitutes. Yet the value captured by generics is climbing at a 2.74% CAGR as hospital tenders pit biosimilar infliximab and adalimumab against legacy biologics. Automatic pharmacy substitution, in force since 2001, channels most off-patent scripts to generics within weeks of entry, shrinking the Norway pharmaceutical market size controlled by originator firms. Branded players now wrap therapies with adherence apps and nurse helplines to justify premiums. Meanwhile, biosimilar producers leverage NOR-SWITCH data to secure clinician confidence, escalating uptake in rheumatoid arthritis, dermatology, and gastroenterology.
By Prescription Type: Clinical Focus Dominates Consumer Health
Prescription drugs made up 87.12% of 2025 sales, underpinning the clinical orientation of the Norway pharmaceutical market. Universal reimbursement encourages prescriber-led medication choices, whereas OTC growth at a 2.6% CAGR stems from consumer wellness and digital consults that direct minor ailments toward self-care. Pharmacy e-portals seamlessly log both categories, but blue-prescription schemes covering cancer and chronic diseases overwhelmingly favor the Rx channel.
By Distribution Channel: Hospital Networks Lead Digital Transformation
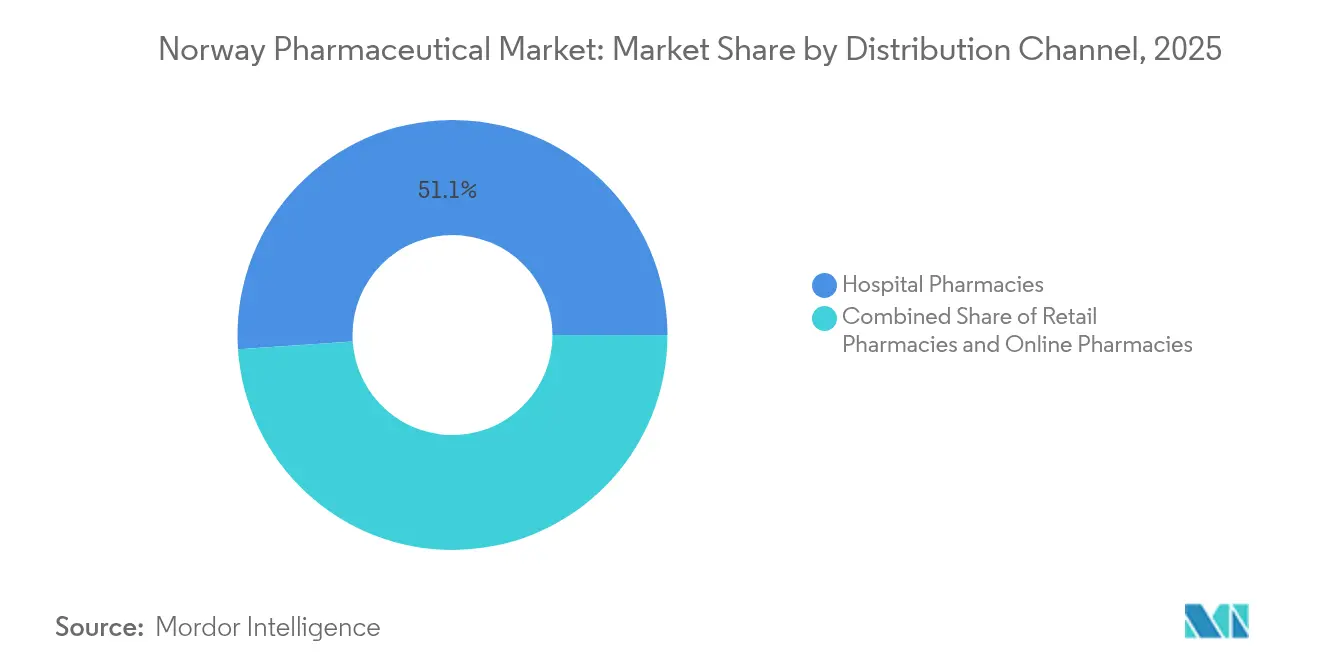
Hospital pharmacies captured 51.05% of 2025 revenues as they dispense high-cost biologics under centralized tenders. Retail chains adjust by offering medication reviews and vaccination services. Online pharmacy turnover, rising at a 3.02% CAGR, mirrors e-prescription simplicity and last-mile delivery innovations. Vertical integration between Apotek 1, Boots, and Vitusapotek streamlines wholesaling but narrows entry windows for independents, concentrating the Norway pharmaceutical market.
By Route of Administration: Oral Delivery Maintains Preference
Oral dosage forms hold 54.21% share because of patient convenience and generically crowded chronic-care classes. Parenteral volumes grow at 3.1% CAGR on biologics, radiopharmaceuticals, and long-acting injectables. UiT’s oral insulin candidate may erode insulin-pen demand post-2028, but until then, infusion centers are expanding inside hospital pharmacies. Home IV antibiotic protocols extend parenteral therapy beyond institutional walls, backed by tele-monitoring.
Geography Analysis
A uniform national payer regime minimizes regional pricing variations, yet utilization patterns diverge. Oslo and Akershus cluster tertiary hospitals, life-science incubators, and 20 Helse Sør-Øst hospital pharmacies, funneling the largest slice of the Norway pharmaceutical market. Western cities Bergen and Stavanger benefit from university-linked clinical trials, raising high-cost therapy penetration. Northern counties, although covered by the same reimbursement rules, struggle with lower pharmacy density that lengthens travel time for prescriptions. Acute-care call-out frequency is more than double the urban rate, prompting drone-delivery pilots to safeguard continuity of care. The government’s EUR 6 billion life-science plan, including Oslo’s new university hospital, will further centralize specialty treatment volumes. Nevertheless, e-prescription ubiquity allows any resident to collect medicines nationwide, smoothing disparities.
Regulatory Landscape
Norway applies medicines oversight within the EU/EEA framework, with the Norwegian Medical Products Agency (DMP, formerly NoMA) overseeing marketing authorisation, clinical trials, pharmacovigilance, and price setting. Before a product can be sold, market authorisation is required, and dossiers can be submitted through national, decentralised, or EU centralised procedures, with eCTD submission requirements shaping compliance and launch readiness.
Pricing and access are managed through DMP maximum-price decisions alongside national HTA and reimbursement processes. Maximum prices for prescription-only medicines use international reference pricing (based on selected EEA countries) with an administrative timeline designed to provide predictability for price applications, while joint European HTA work under the EU HTA Regulation is increasingly reflected in DMP-facing procedures. In January 2026, the regulatory amendment (Forskrift 2026-01-21-205) was adopted with effect from February 7, 2026, continuing alignment of Norwegian rules with EEA developments.
Value Chain Analysis
Norway relies heavily on imports for finished medicines and APIs, while domestic activity focuses on selected niches and localization of services around specialist care, tenders, and digital dispensing. The upstream chain is led by multinational R&D and manufacturing, supported by local clinical research infrastructure, particularly around Oslo and Bergen, which helps sustain early-phase trials and hospital adoption of specialty therapies.
Midstream and downstream functions are centralized. DMP controls marketing authorisation, pharmacovigilance, and regulated price-setting, while Sykehusinnkjop HF runs national procurement for hospital medicines and biologics through tenders that drive switching and price competition. Distribution is structured around a limited set of wholesalers linked to the major pharmacy groups, which supports scale efficiencies and restricts independent wholesale entry. This feeds into a payer-led model where roughly four-fifths of prescription medicine costs are financed by the state via reimbursement. In 2026, DMP operational updates, including guidance activity around shortage reporting and supplier-facing sustainability and stockpile discussions, further link supply continuity and compliance into the value chain.
Competitive Landscape
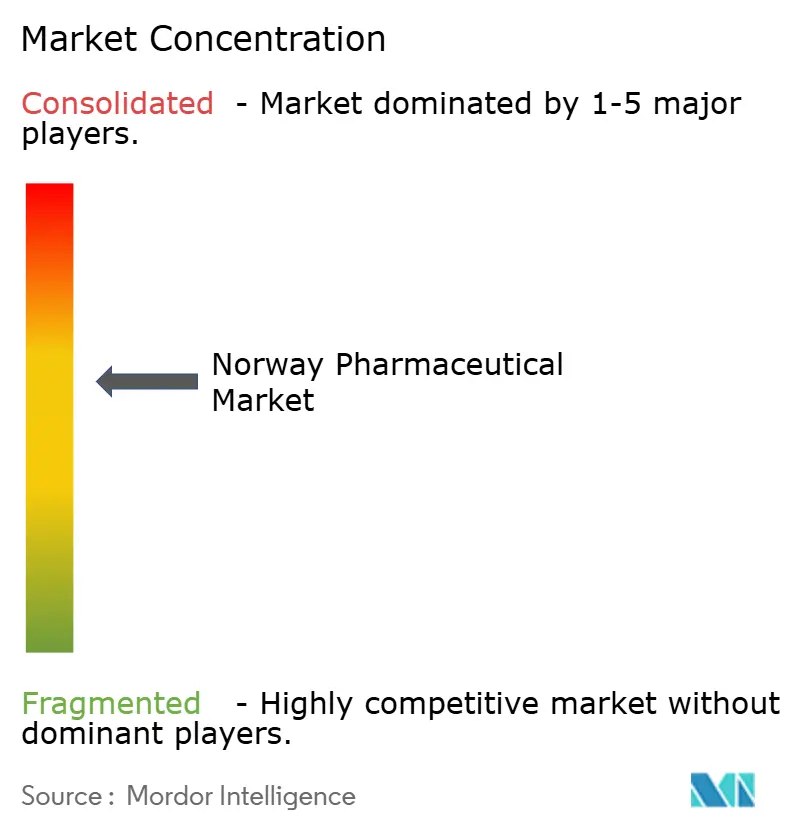
Moderate concentration defines distribution while therapeutic competition varies. Three chains’ 84% retail hold confers scale for IT investments yet draws antitrust scrutiny. Biosimilar arenas feature aggressive price drops—up to 70% below originators—through annual tenders, intensifying rivalry.
Oncology innovation pits multinationals against Norwegian biotech such as Ultimovacs and Photocure, with cross-licensing and co-development deals gaining traction. AI diagnostics and supply-chain cloud suites create ancillary competitive fronts, letting tech firms enter medicine workflows.
Environmental compliance pushes manufacturers toward low-emission production, handing first-mover advantage to plants retrofitted with heat-recovery systems. Spin-outs from Oslo Science City enlarge the pool of niche competitors across radiopharmaceuticals and anti-infectives.
Norway Pharmaceutical Industry Leaders
AbbVie Inc.
Bayer AG
Boehringer Ingelheim
GSK plc
AstraZeneca
- *Disclaimer: Major Players sorted in no particular order

Market Opportunities and Future Outlook
Clinical research expansion is a near-term opportunity lever, supported by national programs and measurable targets. NorTrials presented a national action plan for clinical studies (2026-2036) that prioritizes digital solutions, artificial intelligence, and activity-based funding for specialist health services. Separately, the government cancer strategy (Joint Effort Against Cancer 2025-2035) sets a goal to double cancer patient participation in clinical trials to around 15% of patients, which can increase the share of industry-sponsored studies and site partnerships.
Hospital-centered demand growth and supply-security priorities also create opportunity spaces across specialty medicines, procurement services, and localized production. In June 2026, Norway implemented a new national purchasing plan for hospital medicines that integrates access, security of supply, and sustainability criteria into procurement, improving the value of suppliers that can document resilience and environmental performance alongside price. On the manufacturing and imaging-adjacent side, GE HealthCare announced a NOK 550 million investment (May 2026) to expand its contrast agent production footprint in Norway, reflecting continued appetite for strategically relevant in-country capacity. Public infrastructure funding adds further pull-through for high-cost hospital therapies, with the 2026 National Budget proposing about NOK 26 billion in loan authorizations to start five new hospital projects in 2026.
Recent Industry Developments
- June 2026: Amgen secured an extension of its cholesterol medication agreement in Norway, keeping the product positioned as a first-line option through 2028. The continuation reinforces how negotiated access arrangements can lock in volume in a tender-influenced environment, shaping competitive behavior for cardiometabolic portfolios. It also highlights the role of payer and procurement decisions in sustaining branded therapies alongside generic and biosimilar pressure.
- May 2026: GE HealthCare announced a NOK 550 million investment to expand its contrast agent production footprint in Norway, underscoring ongoing in-country capacity expansion and the importance of imaging contrast supply for hospital systems. The project signals heightened attention to strategic manufacturing capacity and resilience within the Norwegian medical supply chain.
- March 2024: Prange Group finalized the acquisition of Fresenius Kabi's Halden plant, retaining staff and maintaining output commitments. The transaction preserves local manufacturing capability and can support supply continuity in a market where procurement and reimbursement systems reward reliable availability. It also reflects ongoing portfolio reshaping among suppliers serving Norway and the broader Nordic region.


Research Methodology Framework and Report Scope
Market Definition and Coverage
This market covers the total value of medicines sold in Norway across prescription and over-the-counter demand, covering branded and generic products supplied through hospital, retail pharmacy, and online channels.
Scope exclusions: Medical devices, diagnostics, dietary supplements, and pure healthcare services are not counted as part of the pharmaceuticals market value.
Segmentation Overview
- By Therapeutic Class
- Cardiovascular System
- Dermatologicals
- Genito-urinary & Sex Hormones
- Anti-infectives (Systemic)
- Antineoplastic & Immunomodulating
- Musculoskeletal System
- Nervous System
- Respiratory System
- Other Classes
- By Drug Type
- Branded
- Generic
- By Prescription Type
- Prescription (Rx)
- Over-the-Counter (OTC)
- By Distribution Channel
- Hospital Pharmacies
- Retail Pharmacies
- Online Pharmacies
- By Route of Administration
- Oral
- Parenteral
- Topical
- Others
Data Sources, Market Sizing, and Validation
Desk Research
Desk research was used to set the country context and the rules of the market, so the model stays consistent with how medicines are priced, reimbursed, and distributed in Norway. We referred to public sources such as the Norwegian Institute of Public Health, the Norwegian Medicines Agency, Statistics Norway, OECD Health Statistics, and selected EU-level health technology assessment material, which help confirm demand drivers and policy-led price effects.
We also reviewed company filings and investor presentations for signals on product launches and portfolio exposure, followed by association websites and reputable press to sense-check major shifts such as tendering outcomes and biosimilar uptake. When a public series had gaps, we used paid subscriptions for company financials and intelligence, shipment-level import or export checks where relevant, and patent databases to clarify innovation pipelines. These examples are not exhaustive, and many other sources were used for data collection, validation, and research clarification.
Primary Interviews and Surveys
Expert interviews and surveys with CXOs, functional/unit leaders, and managers in Norway test channel flows, tender behavior, substitution, reimbursement, and launches. Respondents help clarify how retail and hospital purchasing differs, where generic and biosimilar substitution affects demand, and which reimbursement or tender changes may not yet appear in secondary data. We use this input to investigate material variances before final analysis.
Distribution of primary research fieldwork respondents
| Company type | Respondent position |
|---|---|
| Top tier: 27% | CXOs: 20% |
| Mid tier: 48% | Functional/Unit leaders: 30% |
| Smaller Players: 25% | Managers: 50% |
Market-Sizing & Forecasting
The core sizing starts from a top-down build that reconstructs Norway medicine demand using therapeutic class splits and channel exposure, and then maps that to country pricing and reimbursement realities. To keep the totals practical, we corroborated results with selective bottom-up checks, such as sampled product-level price and volume math, supplier revenue roll-ups where disclosures exist, and channel checks for hospital versus retail mix.
Inputs that matter most in Norway include the split between Rx and OTC demand, the branded versus generic mix, biosimilar substitution patterns in hospitals, tender timing and coverage, and the shift of dispensing toward online pharmacies. Route-of-administration and therapeutic class movement were also used to avoid over-weighting a single area when policy changes affect one category more than others.
For forecasting, we primarily used scenario analysis supported by short trend models (including exponential smoothing on stable series), because policy-driven price steps and tender resets can cause non-linear changes in value. When a bottom-up cross-check could not cover a niche class, the gap was filled using conservative share assumptions that were then confirmed through follow-up discussions with local experts.
Data Validation & Update Cycle
Validation is done through multiple checks so a single data point does not steer the outcome. We compare the modeled totals with independent signals such as public market size references, observed policy events, channel structure realities, and company-level revenue direction, and then any abnormal jumps are reviewed back to the driver assumptions.
Before sign-off, the work goes through a multi-step analyst review where calculations, units, and currency treatment are rechecked, followed by a final consistency pass across all sections. Reports are refreshed annually, and interim updates are triggered when material events occur, such as reimbursement rule changes, major tender shifts, or meaningful therapy-area launch activity. Right before delivery, an analyst performs a fresh pass so clients receive the latest updated view.
Mordor Intelligence's Norway Pharmaceutical Market Size Versus Other Published Estimates
Published Norway pharma market values can look different because not every publisher uses the same boundary for what counts as pharma value and the same point in the pricing chain. Even when the country is the same, the choice of Rx versus OTC coverage, hospital tender treatment, and currency timing can change the final number.
Public evidence such as Trade.gov's USD 3.5 B estimate for 2025 and policy signals on price ceilings and the step-price scheme are used as checks that tie Mordor Intelligence's 2025 value to a realistic Norway demand pool, instead of mixing in adjacent health spending. Differences also come from whether figures are stated at ex-manufacturer pricing or closer to retail value, and whether hospital tenders are captured as net prices or list prices, which affects years with large biosimilar switches.
Benchmark comparison
| Source | Market Size | Gaps in Research Methodology |
|---|---|---|
| Mordor Intelligence | USD 3.13 B (2025) | |
| Government Trade Brief A | USD 3.50 B (2025) | The estimate is presented as a single country total without a clear price-basis definition, and it does not explain how Rx, OTC, and tendered hospital medicines are netted for discounts. |
| Industry Media B | USD 3.00 B (2021) | The value is given as a range for one historical year and is heavily shaped by distribution and tender structure commentary, which limits reproducibility for a consistent multi-year model. |
Across the three figures, the spread is mainly explained by price-basis choices and how hospital tender netting is handled, followed by the year used and currency timing. By keeping scope tight to medicines and anchoring the model to observable Norway-specific purchasing signals, the final number stays traceable to clear inputs and can be repeated when assumptions are updated.


Key Questions Answered in the Report
How big is the Norway Pharmaceutical Market?
The Norway Pharmaceutical Market size is expected to reach USD 3.2 billion in 2026 and grow at a CAGR of 2.28% to reach USD 3.58 billion by 2031.
Which therapeutic class commands the biggest revenue?
Cardiovascular drugs held 15.31% of sales in 2025.
Who are the key players in Norway Pharmaceutical Market?
AbbVie Inc., Bayer AG, Boehringer Ingelheim, GSK plc and AstraZeneca are the major companies operating in the Norway Pharmaceutical Market.
What CAGR is expected for Norway’s online pharmacy channel?
Online pharmacies are forecast to grow at a 3.02% CAGR to 2031.
Page last updated on:





