Pharma 4.0 Market Size and Share
Market Overview
| Study Period | 2019 - 2030 |
|---|---|
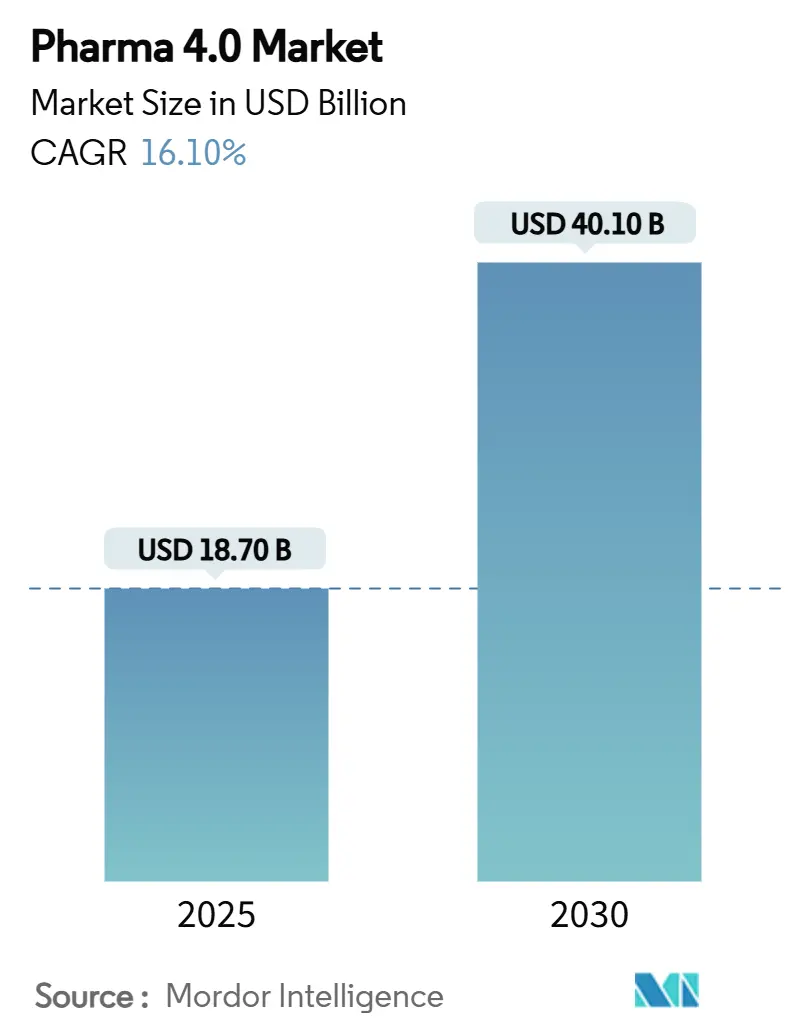
| Market Size (2025) | USD 18.70 Billion |
| Market Size (2030) | USD 40.10 Billion |
| Growth Rate (2025 - 2030) | 16.10% CAGR |
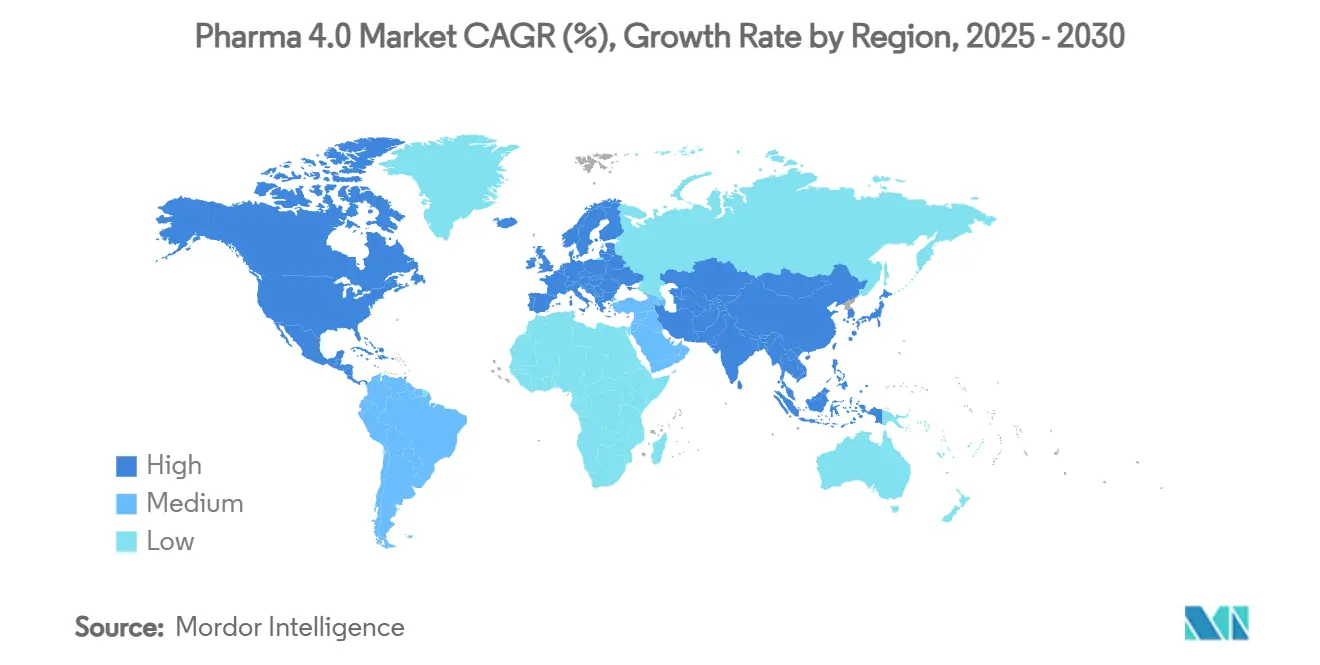
| Fastest Growing Market | Asia Pacific |
| Largest Market | North America |
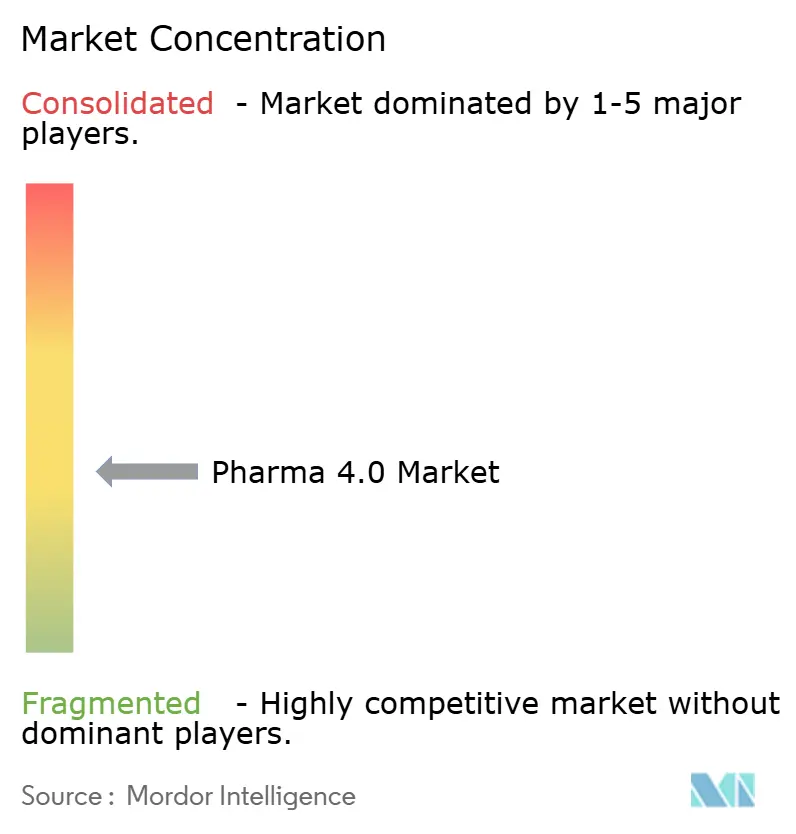
| Market Concentration | Medium |
Major Players *Disclaimer: Major Players sorted in no particular order Image © Mordor Intelligence. Reuse requires attribution under CC BY 4.0. | |
Pharma 4.0 Market Analysis by Mordor Intelligence
The Pharma 4.0 market size stood at USD 18.7 billion in 2025 and is projected to widen to USD 40.1 billion by 2030, translating into a 16.1% CAGR over the forecast period. Government incentives, regulatory pressure for data integrity, and maturing cloud-native validation frameworks are aligning to accelerate digital investments that shorten tech-transfer cycles, lower batch-release latency, and enable patient-centric production at scale. Software-defined plants, predictive asset analytics, and digital twin environments are converging to reduce deviation investigations while unlocking multi-product flexibility.[1]US Congress, “Biotechnology Funding Appropriations,” congress.gov Competitive intensity is rising as incumbents extend automation portfolios into quality, supply-chain, and AI-driven decision layers, while cloud hyperscalers court life-science workloads with pre-validated GxP blueprints. As innovation migrates from machinery to data orchestration, economies of scope are beginning to eclipse traditional scale advantages, reshaping long-term cost curves across the Pharma 4.0 market.
Key Report Takeaways
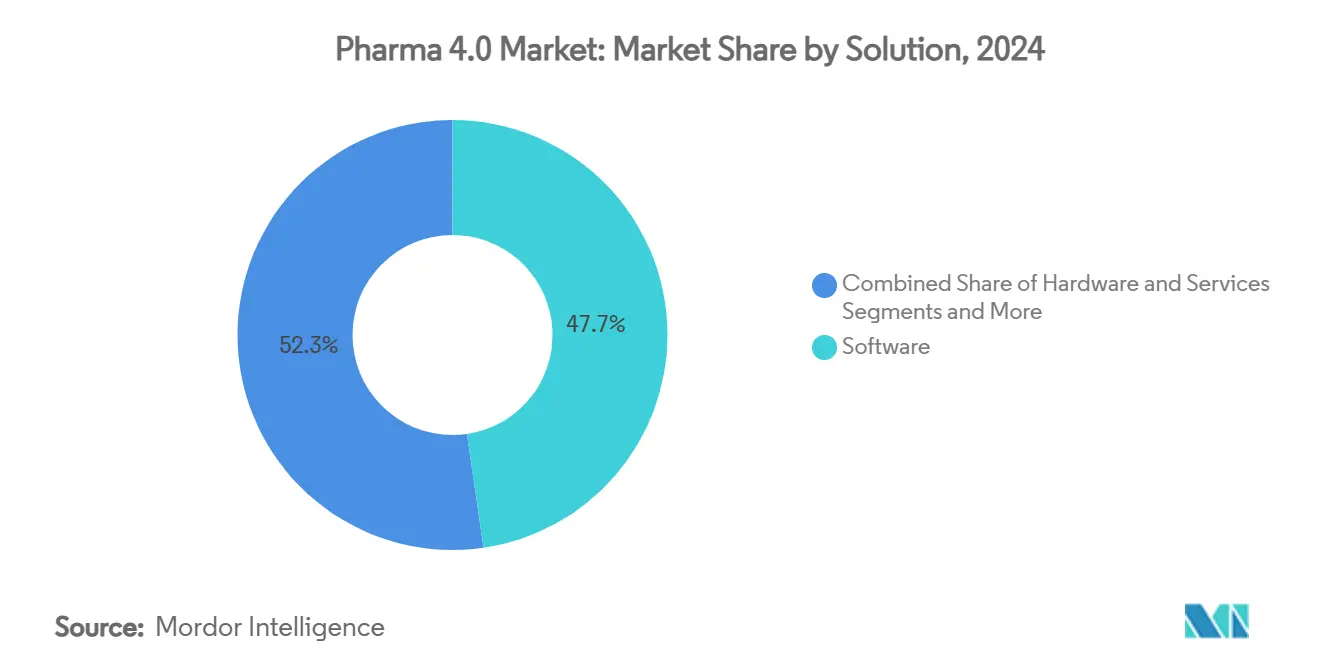
- By solution, software held 47.7% revenue share in 2024, whereas services are forecast to climb at an 18.2% CAGR through 2030.
- By technology, IIoT commanded 29.5% of the Pharma 4.0 market share in 2024; digital-twin platforms are projected to expand at a 22.4% CAGR to 2030.
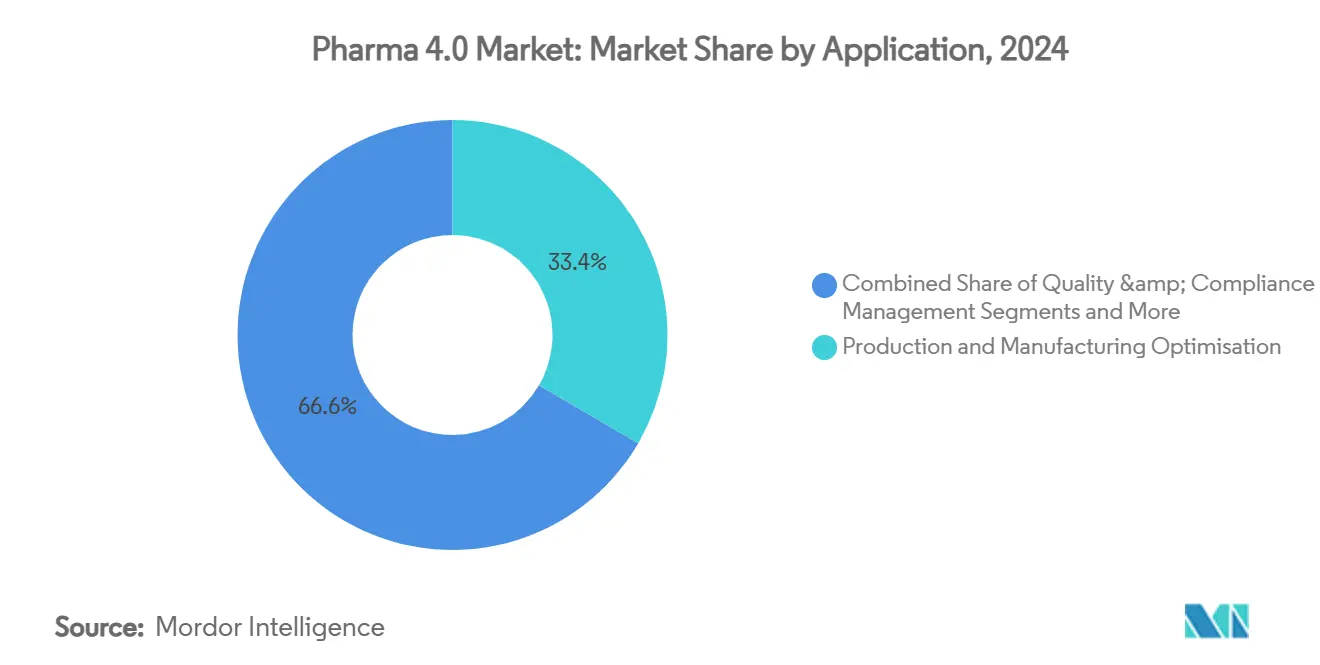
- By application, production and manufacturing optimization accounted for a 33.4% share of the Pharma 4.0 market size in 2024 and is advancing at an 8.0% CAGR through 2030.
- By end user, large pharmaceutical companies led with 38.4% market share in 2024, while CDMOs are poised for the fastest 17.5% CAGR to 2030.
- By deployment model, cloud-based systems captured 60.8% share in 2024 and also record the top-line 21.5% CAGR outlook.
- By geography, North America dominated at 35.8% in 2024; Asia Pacific is projected to post the quickest 14.6% CAGR to 2030.
Global Pharma 4.0 Market Trends and Insights
Drivers Impact Analysis*
| Driver | (~) % Impact on CAGR Forecast | Geographic Relevance | Impact Timeline |
|---|---|---|---|
| Regulatory push for end-to-end data integrity and traceability | +2.80% | North America, EU early adopters | Medium term (2-4 years) |
| Rising adoption of personalized medicine requiring flexible manufacturing | +2.10% | North America, EU, expanding APAC | Long term (≥ 4 years) |
| Growing investments in smart-factory infrastructure by large pharmaceutical firms | +1.90% | Global pharma hubs | Short term (≤ 2 years) |
| Expansion of CDMOs driving digital standardization | +1.70% | Global, APAC surge | Medium term (2-4 years) |
| Rapid maturation of cloud-native GxP platforms lowering adoption barriers | +1.40% | North America leadership | Short term (≤ 2 years) |
| Government incentives for domestic pharma-manufacturing modernization | +1.20% | US, EU, India | Medium term (2-4 years) |
| Source: Mordor Intelligence | |||
Regulatory Push for End-to-End Data Integrity and Traceability
Demand for serialized, real-time product provenance is forcing companies to adopt common data models that eliminate paper reconciliation and batch-packet lag. The FDA’s DSCSA final guidance, combined with the EMA’s emphasis on continuous-manufacturing validation, is shifting compliance costs from documentation labor to digital-platform investment. Blockchain pilots now demonstrate secure peer-to-peer data exchange across packaging, distribution, and recall workflows. Firms that fuse serialization, quality, and ERP layers achieve audits in hours rather than weeks, freeing capacity for rapid launch programs and tender bids.
Rising Adoption of Personalized Medicine Requiring Flexible Manufacturing
As gene, cell, and RNA therapies move into commercial volumes, batch sizes collapse while variant complexity rises. Modular clean-room skids and single-use assemblies are paired with MES rules that auto-configure recipes per patient, trimming change-over downtime to minutes. 3-D-printed dose forms extend the concept to oral therapeutics, with ink-jet platforms producing regimen-specific tablets in hospital pharmacies. The shift transfers value from line-rate output to adaptive scheduling algorithms that can juggle hundreds of micro-lots with GMP precision.
Growing Investments in Smart-Factory Infrastructure by Large Pharmaceutical Firms
Tier-one manufacturers are channeling multibillion-dollar capex into sensor-rich plants that feed advanced-process-control models. Eli Lilly’s US expansion earmarks robotics and AI as core enablers for insulin and oncology portfolios. Similarly, several WEF Lighthouse facilities have documented double-digit output gains after deploying closed-loop scheduling, in-line release testing, and predictive maintenance. These proofs-of-concept de-risk larger rollouts and establish benchmark ROIC cases for the wider Pharma 4.0 market.
Expansion of Contract Development and Manufacturing Organizations Driving Digital Standardization
CDMOs manage a mosaic of client quality systems and, therefore, gravitate to open, cloud-based stacks that speed tech transfer and lot genealogy reporting. Novo Holdings’ acquisition of Catalent exemplifies the strategic premium placed on digitally unified multi-tenant facilities. As outsourcing share rises, sponsor firms must align with CDMO data protocols or forfeit agility, making inter-company interoperability a competitive baseline.
Restraints Impact Analysis*
| Restraint | (~) % Impact on CAGR Forecast | Geographic Relevance | Impact Timeline |
|---|---|---|---|
| High upfront capital expenditure for plant digitalization | -2.30% | Emerging markets hardest hit | Short term (≤ 2 years) |
| Interoperability challenges among proprietary OT and IT systems | -1.80% | Multi-site networks worldwide | Medium term (2-4 years) |
| Stringent validation and compliance processes prolong deployment cycles | -1.50% | Global | Medium term (2-4 years) |
| Limited ROI visibility for SMEs in emerging regions | -1.10% | APAC, LATAM, MEA | Long term (≥ 4 years) |
| Source: Mordor Intelligence | |||
High Upfront Capital Expenditure for Plant Digitalization
When factoring in equipment, cybersecurity, and workforce reskilling, total digital retrofit budgets for a large biologics site can exceed USD 100 million. While big pharma secures multi-year investment envelopes, mid-size manufacturers often defer projects, perpetuating productivity gaps. Financial incentive programs soften capex shock yet still require companies to justify five-year paybacks against existing line utilization.
Interoperability Challenges Among Proprietary Automation and IT Systems
Decades of vendor-specific DCS and MES deployments create data silos that resist plug-and-play integration. O-PAS initiatives and OPC UA extensions promise open networks, but pharma’s zero-downtime tolerance slows field adoption.[3]NAMUR, “Open Process Automation Standards Initiative,” namur.net Parallel validation during migration elevates project cost and complexity, tempering near-term momentum in the Pharma 4.0 market.
*Our forecasts treat driver/restraint impacts as directional, not additive. The impact forecasts reflect baseline growth, mix effects, and variable interactions.
Segment Analysis
By Solution: Software Consolidation Reshapes Operating Models
Software captured 47.7% of 2024 revenue as manufacturers prioritized data orchestration over hardware refresh cycles. Integrated MES, QMS, and advanced-analytics suites now anchor platform roadmaps, creating sticky multi-year engagements that shield vendors from price erosion. At the same time, the services sub-segment is accelerating at an 18.2% CAGR, reflecting client preference for outcome-based contracts that bundle implementation, validation, and continuous optimization. These trends collectively cement the Pharma 4.0 market’s pivot toward recurring revenue streams and drive consolidation among independent software providers.
Growing reliance on managed services lifts the burden of in-house data-science capabilities, allowing firms to scale pilots globally without derivative head-count spikes. Consequently, strategic vendors deploy centers of excellence close to major clusters, reinforcing switching costs. Merck’s global agreement with Siemens illustrates how single-vendor frameworks can harmonize batch-record workflows and robotics control within one governance architecture. Such alliances make platform incumbency a central competitive lever in the Pharma 4.0 market.


By Technology: IIoT Foundations Enable Digital-Twin Breakthroughs
IIoT held a 29.5% revenue lead in 2024, providing the sensor density and protocol layer underpinning smart-factory ambitions. Edge gateways translate control-system data into time-series feeds consumable by cloud analytics, closing visibility gaps that historically masked performance drag. Meanwhile, digital-twin environments are forecast to surge at a 22.4% CAGR, enriching virtual commissioning, real-time deviation prediction, and scale-up modeling. This shift embeds simulation inside day-to-day production governance, reducing engineering-change requests and CAPA cycles.
Artificial-intelligence toolchains further elevate predictive power, enabling no-touch release based on inline spectroscopy and multivariate PK/PD modeling. Sanofi’s virtual-patient simulations, for instance, have cut clinical-trial design time while guiding continuous-manufacturing parameter windows. As twin fidelity improves, firms iterate faster across molecule lifecycles, rooting digital-first thinking deep within the Pharma 4.0 industry.
By Application: Production Optimization Leads Predictive-Maintenance Upswing
Production and manufacturing optimization represented 33.4% of 2024 expenditure, underlining demand for yield improvement, recipe agility, and right-first-time metrics. Multilayer schedulers orchestrate single-use bioreactors, roll-fed blister lines, and cold-chain logistics in one command plane, shaving lead-times for priority therapeutics. On the horizon, predictive-maintenance solutions are poised for a 19.0% CAGR as cost-of-downtime metrics escalate in continuous-manufacturing setups.
AI models trained on vibration, temperature, and dissolved-oxygen data now flag deviations hours before spec variance, allowing planned intervention during cleaning windows. Facilities that marry maintenance alerts to e-logbook workflows avoid cross-system re-entry, trimming compliance overhead. Integrating these capabilities further cements the competitive moat around data-rich operators within the Pharma 4.0 market.
By End User: Large Pharma Anchors CDMO Expansion Curve
Large pharmaceutical companies accounted for 38.4% of 2024 demand, capitalizing on cash-rich balance sheets to convert legacy lines into intelligent nodes. Yet the CDMO community is expanding at 17.5% CAGR, fueled by multi-tenant platforms that deliver validated capacity without sponsor capex. This structural outsourcing lifts utilization rates and spreads best practice across dozens of molecules, creating a feedback loop that accelerates digital-standard adoption.
For sponsor firms, partnering with digitally mature CDMOs reduces tech-transfer friction, permits late-stage customization, and de-risks global supply obligations. As CDMOs refine common data architectures, they set de facto standards that ripple across the Pharma 4.0 market size and reshape vendor roadmaps.
By Deployment Model: Cloud Governance Unlocks Global Scalability
Cloud deployments seized 60.8% of 2024 outlays and retained the highest growth trajectory at 21.5% CAGR, propelled by hardened GxP blueprints and zero-downtime patch regimes. Native services such as event streaming and managed machine learning expedite plant-wide use-case rollout without on-premises licensing friction. Architecture also enables federated analytics, letting multi-site operators benchmark OEE, energy, and reject rates in near real-time.
On-premises instances persist where data-sovereignty or latency constraints dominate, but hybrid hubs increasingly bridge control networks to cloud analytics via edge clusters. This coexistence minimizes rip-and-replace risk while ensuring companies can iterate swiftly as regulatory guidance evolves, further entrenching cloud as the reference standard within the Pharma 4.0 market.
Geography Analysis
North America retained a 35.8% revenue share in 2024, buoyed by USD 15 billion in biotechnology appropriations and Inflation-Reduction-Act credits that subsidize domestic automation investments. Multi-state production corridors leverage harmonized FDA and Health-Canada guidance, enabling continuous-manufacturing filings that cut review cycles. Puerto Rico’s 40% machinery tax-credit deepens the region’s biologics specialization, amplifying its export footprint into Latin America. Rising biologic approvals keep utilization high, ensuring the Pharma 4.0 market size advantage persists through the medium term.
Asia Pacific is forecast to record the fastest 14.6% CAGR, underpinned by China’s Market-Authorization-Holder reforms that unlock scale for mid-tier innovators and by India’s PLI outlays that reward GMP digitalization. Japan and South Korea contribute via high-precision robotics, while Singapore’s pharma estates set talent-development benchmarks. As regional supply chains target vaccine self-sufficiency, unified data platforms become essential for cross-border QP release, solidifying Asia-Pacific’s long-term contribution to the Pharma 4.0 market.
Europe holds a notable position thanks to the July 2025 Life-Sciences Strategy, which channels funding to advanced-therapy production nodes and multi-country trials.[2]European Commission, “Building the Future with Nature: Boosting Biotechnology and Biomanufacturing in the EU,” eur-lex.europa.eu Germany and the Nordics pioneer renewable-energy-powered plants, aligning digital investment with ESG commitments. The Corporate-Sustainability-Reporting Directive nudges firms to deploy real-time carbon dashboards within MES layers, elevating transparency expectations across the Pharma 4.0 market share dialogue.

Competitive Landscape
The vendor arena sits in a moderate-fragmentation band, where the top five suppliers collectively hold just under 45% of total sales. Siemens, Rockwell, and Emerson extend PLC heritage into AI scheduling and electronic batch-record modules, leveraging installed-base stickiness to cross-sell analytics. Conversely, AWS, Microsoft, and Google embed validated landing zones, database orchestration, and model-risk-management suites tailored to cGMP contexts, eroding the gap between IT and OT ecosystems.
Partnerships anchor growth: Merck’s agreement with Siemens consolidates 50 sites under one digital spine, promising unified deviation management and predictive resource allocation. NVIDIA teams with Novo Nordisk will train foundation models that forecast protein-folding bottlenecks and guide upstream process tweaks, illustrating hardware-AI co-creation. Cyber-security specialists now bundle zero-trust blueprints with OT patch-management consoles, a necessary adjunct as plants expose APIs to third-party CDMOs and regulators.
White space remains in plug-and-play interoperability layers able to harmonize legacy DCS tags with cloud schema without re-validation. Vendors tackling this pain point stand to capture disproportionate share as the Pharma 4.0 market migrates toward evergreen software cycles and integrated life-cycle governance.
Pharma 4.0 Industry Leaders
Siemens AG
Rockwell Automation
IBM Corporation
Emerson Electric Co.
Honeywell International
- *Disclaimer: Major Players sorted in no particular order

Recent Industry Developments
- June 2025: NVIDIA partnered with Novo Nordisk and DCAI on the Gefion supercomputer, which accelerates generative AI model training for research and clinical data sets.
- April 2025: Pfizer and Flagship Pioneering launched a multi-target discovery pact that uses Valo Health’s Logica platform to accelerate autoimmune-therapy pipelines.
- January 2025: NVIDIA unveiled pharma collaborations at the JP Morgan Healthcare Conference with IQVIA and Illumina, aiming to tap AI for drug design, patient identification, and commercial analytics.
- June 2024: TraceLink submitted Trace-Histories, a blockchain-based DSCSA pilot proposal that supports interoperable supply-chain traceability.


Global Pharma 4.0 Market Report Scope
| Hardware |
| Software |
| Services |
| Industrial Internet of Things (IIoT) |
| Artificial Intelligence & Big Data |
| Cloud & Edge Computing |
| Augmented/Virtual Reality |
| Blockchain |
| 3-D Printing / Additive Manufacturing |
| Cyber-Security Solutions |
| Production & Manufacturing Optimisation |
| Quality & Compliance Management |
| Supply-Chain & Logistics |
| Drug Discovery & Development |
| Clinical Trial Management |
| Packaging & Labelling |
| Maintenance & Asset Management |
| Pharmaceutical and Biotechnology Companies |
| Contract Development & Manufacturing Organizations (CDMOs) |
| Research Laboratories |
| Academic & Government Institutes |
| On-premise |
| Cloud-based |
| North America | United States |
| Canada | |
| Mexico | |
| Europe | Germany |
| United Kingdom | |
| France | |
| Italy | |
| Spain | |
| Rest of Europe | |
| Asia Pacific | China |
| Japan | |
| India | |
| South Korea | |
| Australia | |
| Rest of Asia Pacific | |
| Middle East & Africa | GCC |
| South Africa | |
| Rest of Middle East & Africa | |
| South America | Brazil |
| Argentina | |
| Rest of South America |
| By Solution | Hardware | |
| Software | ||
| Services | ||
| By Technology | Industrial Internet of Things (IIoT) | |
| Artificial Intelligence & Big Data | ||
| Cloud & Edge Computing | ||
| Augmented/Virtual Reality | ||
| Blockchain | ||
| 3-D Printing / Additive Manufacturing | ||
| Cyber-Security Solutions | ||
| By Application | Production & Manufacturing Optimisation | |
| Quality & Compliance Management | ||
| Supply-Chain & Logistics | ||
| Drug Discovery & Development | ||
| Clinical Trial Management | ||
| Packaging & Labelling | ||
| Maintenance & Asset Management | ||
| By End User | Pharmaceutical and Biotechnology Companies | |
| Contract Development & Manufacturing Organizations (CDMOs) | ||
| Research Laboratories | ||
| Academic & Government Institutes | ||
| By Deployment Model | On-premise | |
| Cloud-based | ||
| By Geography | North America | United States |
| Canada | ||
| Mexico | ||
| Europe | Germany | |
| United Kingdom | ||
| France | ||
| Italy | ||
| Spain | ||
| Rest of Europe | ||
| Asia Pacific | China | |
| Japan | ||
| India | ||
| South Korea | ||
| Australia | ||
| Rest of Asia Pacific | ||
| Middle East & Africa | GCC | |
| South Africa | ||
| Rest of Middle East & Africa | ||
| South America | Brazil | |
| Argentina | ||
| Rest of South America | ||


Key Questions Answered in the Report
What is the current size of the Pharma 4.0 market?
The Pharma 4.0 market size reached USD 18.7 billion in 2025 and is forecast to grow to USD 40.1 billion by 2030.
Which region holds the largest share of the Pharma 4.0 market?
North America led with 35.8% market share in 2024, supported by federal incentives and early adoption of continuous-manufacturing regulations.
What segment is growing the fastest within Pharma 4.0?
Digital-twin technology is projected to expand at the highest 22.4% CAGR through 2030 as manufacturers integrate virtual modelling into process control.
Why are CDMOs important to Pharma 4.0 adoption?
CDMOs accelerate digital standardisation by operating multi-tenant, cloud-based platforms that support diverse sponsor quality systems, thereby lowering integration barriers.
How are government policies influencing Pharma 4.0 investments?
Initiatives such as the US Inflation-Reduction-Act credits and the EU Life-Sciences Strategy offer tax breaks and funding that directly subsidise smart-factory equipment and digital infrastructure.
What is the biggest challenge for smaller companies entering Pharma 4.0?
High upfront capital expenditure and uncertain ROI make it difficult for SMEs, particularly in emerging markets, to finance full-scale digital-plant upgrades.
Page last updated on:


