
Pharmacovigilance Automation Market Size and Share
Market Overview
| Study Period | 2020 - 2031 |
|---|---|
| Market Size (2026) | USD 3.03 Billion |
| Market Size (2031) | USD 5.68 Billion |
| Growth Rate (2026 - 2031) | 13.42 % |
| Fastest Growing Market | Asia-Pacific |
| Largest Market | North America |
| Market Concentration | Medium |
Major Players *Disclaimer: Major Players sorted in no particular order Image © Mordor Intelligence. Reuse requires attribution under CC BY 4.0. | |
Pharmacovigilance Automation Market Analysis by Mordor Intelligence
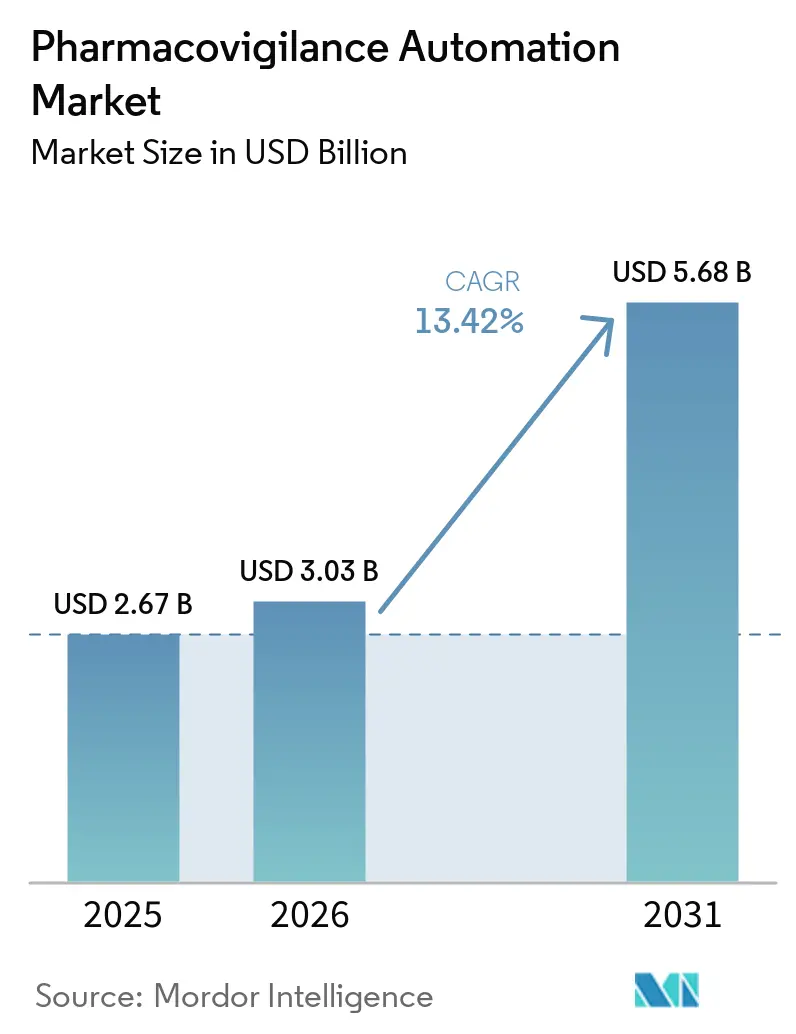
The Pharmacovigilance Automation Market size is projected to be USD 2.67 billion in 2025, USD 3.03 billion in 2026, and reach USD 5.68 billion by 2031, growing at a CAGR of 13.42% from 2026 to 2031.
Growing regulatory demands, escalating adverse-event volumes, and pressure to lower per-case costs are steering safety teams toward AI-centric case-intake platforms that deliver real-time processing, audit-ready traceability, and labor savings. Sanofi’s multi-year Project ARTEMIS run with IQVIA shows how large sponsors can absorb annual safety-case growth of 5-20% without proportional staff increases, targeting a 50% cost reduction by 2027. New ICH E2D(R1) and M14 guidelines, effective March 2026, mandate structured electronic formats, nudging buyers toward vendors with pre-validated connectors to regional portals. At the same time, the FDA–EMA joint principles for AI-enabled pharmacovigilance, published in January 2026, provide clarity on change-control, boosting sponsor confidence in self-learning algorithms. Together, these forces underpin sustained double-digit expansion for the pharmacovigilance automation market during the forecast window.
Key Report Takeaways
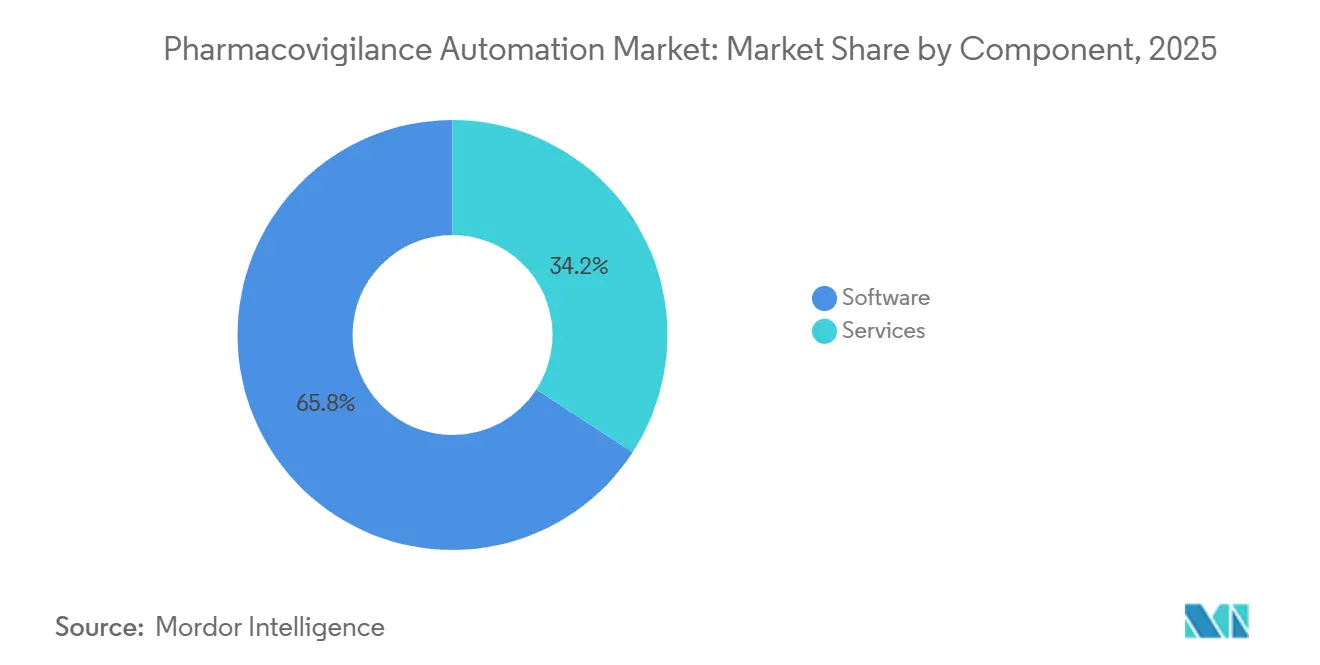
- By component, software commanded 65.82% of the pharmacovigilance automation market share in 2025, while services are advancing at a 14.31% CAGR through 2031.
- By technology, AI & ML platforms accounted for 45.17% of deployments in 2025; natural-language processing is the fastest-growing technology segment at 15.92% CAGR to 2031.
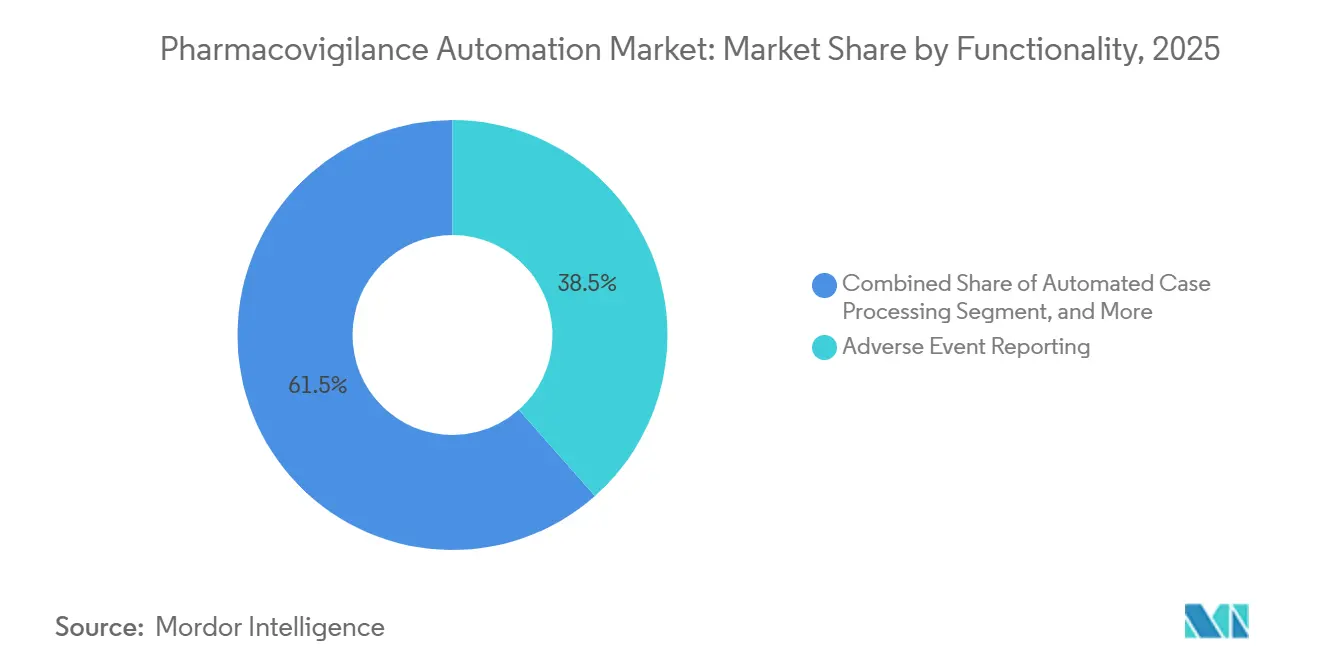
- By functionality, adverse-event reporting held a 38.46% slice of the pharmacovigilance automation market size in 2025, but signal detection is set to expand at 13.79% through 2031.
- By deployment mode, cloud solutions captured 53.94% of installations in 2025, whereas hybrid architectures are pacing the field with a 16.36% CAGR.
- By end user, pharmaceutical companies generated 45.16% of 2025 revenue, yet contract research organizations are on track for a 17.61% CAGR to 2031.
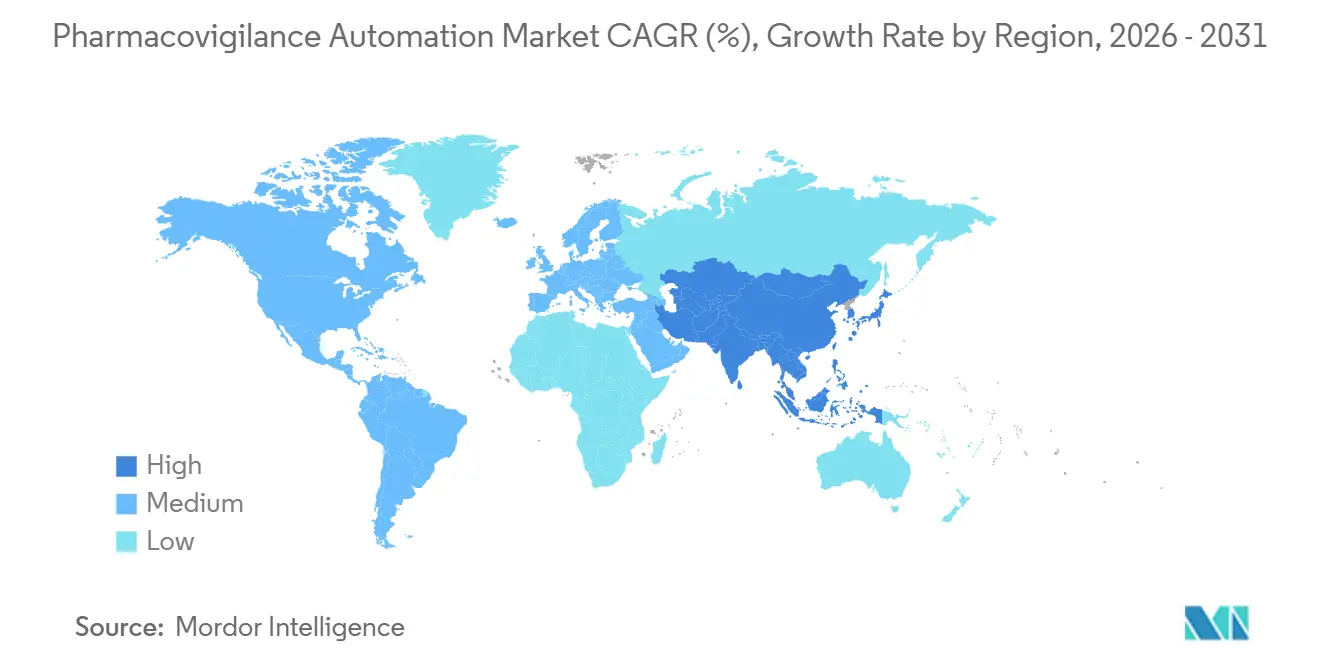
- By geography, North America led with 36.48% share in 2025, but Asia-Pacific is forecast to grow at 19.34% CAGR the fastest among all regions.
Note: Market size and forecast figures in this report are generated using Mordor Intelligence’s proprietary estimation framework, updated with the latest available data and insights as of January 2026.
Market Trends and Insights
Drivers Impact Analysis of Pharmacovigilance Automation Market*
| Driver | (~) % Impact on CAGR Forecast | Geographic Relevance | Impact Timeline |
|---|---|---|---|
| Rising Regulatory Pressure for Drug-Safety Compliance | +2.8% | Global, peak enforcement in North America and Europe | Short term (≤ 2 years) |
| Increasing AE-Data Volumes From Multi-Channel Sources | +3.1% | Global, fastest in Asia-Pacific | Medium term (2-4 years) |
| Rapid Adoption of AI/ML-Centric Safety Platforms | +2.5% | North America and Europe lead | Medium term (2-4 years) |
| Cost-to-Serve Reduction Mandates by Big Pharma | +1.9% | Global, concentrated in top-20 pharma hubs | Long term (≥ 4 years) |
| Automation Demand From Cell & Gene Therapy Surveillance | +1.2% | North America and Europe | Long term (≥ 4 years) |
| Expansion of Real-World-Data Networks | +1.4% | Asia-Pacific core, spill-over worldwide | Medium term (2-4 years) |
| Source: Mordor Intelligence | |||
Rising Regulatory Pressure for Drug-Safety Compliance
Global regulators have shortened reporting timelines and tightened data-quality thresholds, forcing sponsors to automate validation checks that human teams cannot repeat at scale. The FDA and EMA issued joint principles in January 2026 that treat algorithmic duplicate detection, narrative summarization, and causality coding as medical-device functions, requiring pre-market validation and post-market surveillance. EMA pilots that began in September 2025 across 12 marketing-authorization holders are already highlighting compliance gaps in legacy systems.[1] These mandates reward vendors whose platforms ship with audit trails, version control, and ISO 13485 certification, thereby lifting the pharmacovigilance automation market. CIOMS reinforced the trend in December 2025 by recommending that AI model training datasets and bias-mitigation steps appear in periodic safety reports.[2] Collectively, these measures accelerate investment while increasing entry barriers for solutions without embedded compliance tooling.
Increasing AE-Data Volumes From Multi-Channel Sources
Adverse-event counts are exploding as reports move beyond physician submissions to include mobile apps, social media, and wearables. India logged 4.8 million cases in 2024 via its mobile reporting app, nearly doubling 2020 figures.[3] Academic work shows 40% of social-media events never reach formal reporting systems, yet 15% surface sooner when mined algorithmically.[4] Decentralized trials feed electronic patient-reported outcomes that regulators expect sponsors to screen within 24 hours, an unrealistic task for manual reviewers. Europe’s DARWIN EU network will add 150 million electronic records by 2027, overwhelming traditional safety desks. Automated ingestion and NLP triage, therefore, become essential, further expanding the pharmacovigilance automation market.
Rapid Adoption of AI/ML-Centric Safety Platforms
Sponsors are shifting from brittle rule sets to self-learning models that handle duplicate detection and MedDRA coding while lowering false positives. EVERSANA’s ORCHESTRATE PV, launched July 2025, claims 50% faster processing and 40% less manual labor through pre-trained models. The FDA’s predetermined change-control framework lets companies update algorithms inside approved performance corridors without new filings, reducing compliance drag. Japan’s MIHARI Project scans 100 million EHRs and cuts signal-detection lags by six months, validating machine-learning efficacy for real-world surveillance. Vendors are now localizing models to counter dataset bias flagged by CIOMS, creating region-specific variants and transparency dashboards. These innovations feed sustained growth for the pharmacovigilance automation market.
Cost-To-Serve Reduction Mandates by Big Pharma
Patent cliffs and pricing pressure are squeezing margins, so safety teams must prove per-case savings. Sanofi’s Project ARTEMIS aims to cut operating expenses by 50% by 2027 while handling 700,000 cases annually. WNS showed robotic process automation, trimming data-entry time from 45 minutes to 12 minutes. CROs such as PrimeVigilance migrated to Oracle Argus Cloud in July 2025 and now sell tiered, per-case packages that small biotechs prefer. The strategy gains traction even as cell-and-gene safety follow-up introduces sparse, complex events that current algorithms still struggle to contextualize. Yet the overall efficiency narrative keeps capital flowing into the pharmacovigilance automation market.
Restraints Impact Analysis of Pharmacovigilance Automation Market*
| Restraint | (~) % Impact on CAGR Forecast | Geographic Relevance | Impact Timeline |
|---|---|---|---|
| Data-Privacy & Cross-Jurisdiction Compliance Hurdles | -1.6% | Global, acute in EU and China | Short term (≤ 2 years) |
| Legacy Safety-Database Integration Complexity | -1.1% | North America & Europe | Medium term (2-4 years) |
| Vendor-Lock-in Concerns From Proprietary AI Models | -0.7% | Global, sharper for mid-tier biotechs | Long term (≥ 4 years) |
| Multilingual NLP Model Bias | -0.5% | APAC & Latin America | Medium term (2-4 years) |
| Source: Mordor Intelligence | |||
Data-Privacy & Cross-Jurisdiction Compliance Hurdles
The EU’s GDPR blocks data transfers to non-adequate jurisdictions unless complex safeguards exist, complicating cloud deployments headquartered in the United States. China’s PIPL enforces strict localization, obliging multinationals to run isolated databases inside the country. The FDA still requires 21 CFR Part 11 compliance for outsourced hosting, adding audit overhead for small sponsors. These overlapping statutes fragment data lakes, inflate validation costs, and slow the migration pace, limiting near-term addressable revenue for the pharmacovigilance automation market.
Legacy Safety-Database Integration Complexity
Decades of proprietary case data reside in systems such as Oracle Argus and ArisGlobal LifeSphere that store fields differently, making one-click migration impossible. Sponsors must reconcile duplicate linkages, MedDRA hierarchy versions, and free-text narratives to preserve regulatory history tasks that stretch projects beyond 18 months on average. ICH E2B(R3) introduced structured fields many legacy builds lack, so most organizations run costly parallel systems during cutover. This drag tempers adoption velocity, even as newer entrants promise turnkey connectors, thereby capping short-term gains for the pharmacovigilance automation market.
*Our forecasts treat driver/restraint impacts as directional, not additive. The impact forecasts reflect baseline growth, mix effects, and variable interactions.
Pharmacovigilance Automation Market Segment Analysis
By Component:
Services Gain as Biotechs Outsource AnalyticsServices are winning share even as software retains a dominant revenue base. In 2025, software captured 65.82% of the pharmacovigilance automation market share. Growth tilts toward managed offerings, however, with services posting a 14.31% CAGR to 2031 on the back of per-case outsourcing contracts that wrap technology, labor, and regulatory submissions into a single invoice. EVERSANA’s July 2025 launch of ORCHESTRATE PV epitomizes this pivot by letting mid-tier biotechs bypass licenses altogether.
Adoption of hybrid engagement models is also fostering service revenue. Sponsors lean on consultants for 12–18 month migrations that demand data mapping, validation scripting, and regulator-facing documentation. Niche firms such as Nextrove specialize in multilingual case translation, addressing the restraints outlined earlier. Over the horizon, deeper automation could cannibalize human services, but complexities tied to cell-and-gene follow-up and real-world-evidence ingestion suggest sustained room for blended tech-plus-people packages inside the pharmacovigilance automation industry.
By Technology:
NLP Surges on Multilingual and Social-Media DemandsArtificial intelligence and machine learning are expected to account for 45.17% of deployments in 2025. Meanwhile, NLP is experiencing the fastest growth, with a 15.92% CAGR, fueled by the adoption of decentralized trial narratives, patient-reported outcomes, and analysis of social media data. Transformer architectures deliver an impressive 92% extraction accuracy for English, significantly outperforming traditional rule-based systems.
Vendors are pouring R&D into multilingual corpora to narrow the bias gap flagged as a restraint. Robotic process automation remains foundational but is flattening as capabilities embed directly into broader suites. Early pilots involving blockchain audit trails and graph-database signal maps are tucked in the “Others” bucket, signaling future adjacency plays rather than near-term revenue swings for the pharmacovigilance automation market.
By Functionality:
Signal Detection Accelerates Amid Regulatory ScrutinyAdverse-event reporting delivered 38.46% revenue in 2025, mirroring universal submission mandates. Signal detection and risk management, however, is forecast to outpace at 13.79% CAGR, spurred by regulators citing delayed identification in 2024 warning letters that rose 23% year over year. Automated case processing delivers hard savings WNS cut handling time to 12 minutes but its growth moderates as early adopters complete rollouts.
Medical-literature monitoring remains difficult to monetize because fewer than 1% of screened articles yield reportable cases. Yet vendors fold it into full-suite license deals to keep buyers inside a single console. Real-world signal engines like Japan’s MIHARI underline shifting expectations: proactive screening is becoming table stakes, pulling yet more investment into the pharmacovigilance automation market.

By Deployment Mode:
Hybrid Architectures Reconcile Compliance and AgilityCloud installations account for 53.94% of the market, while hybrid models are gaining momentum with a 16.36% CAGR, driven by the intersection of data-localization regulations and global analytics objectives. A split architecture that keeps identifiers on-premise while moving de-identified sets to the cloud satisfies GDPR and PIPL without forfeiting machine-learning horsepower.
On-premise footprints persist among large sponsors bound by conservative IT rules, yet vendor roadmaps now signal end-of-life for many legacy versions. The FDA’s 2025 draft guidance softened concern over cloud storage of regulated data once 21 CFR Part 11 controls are proven. Taken together, hybrid and cloud models will dominate new contracts, shaping future revenue patterns inside the pharmacovigilance automation industry.
By End User:
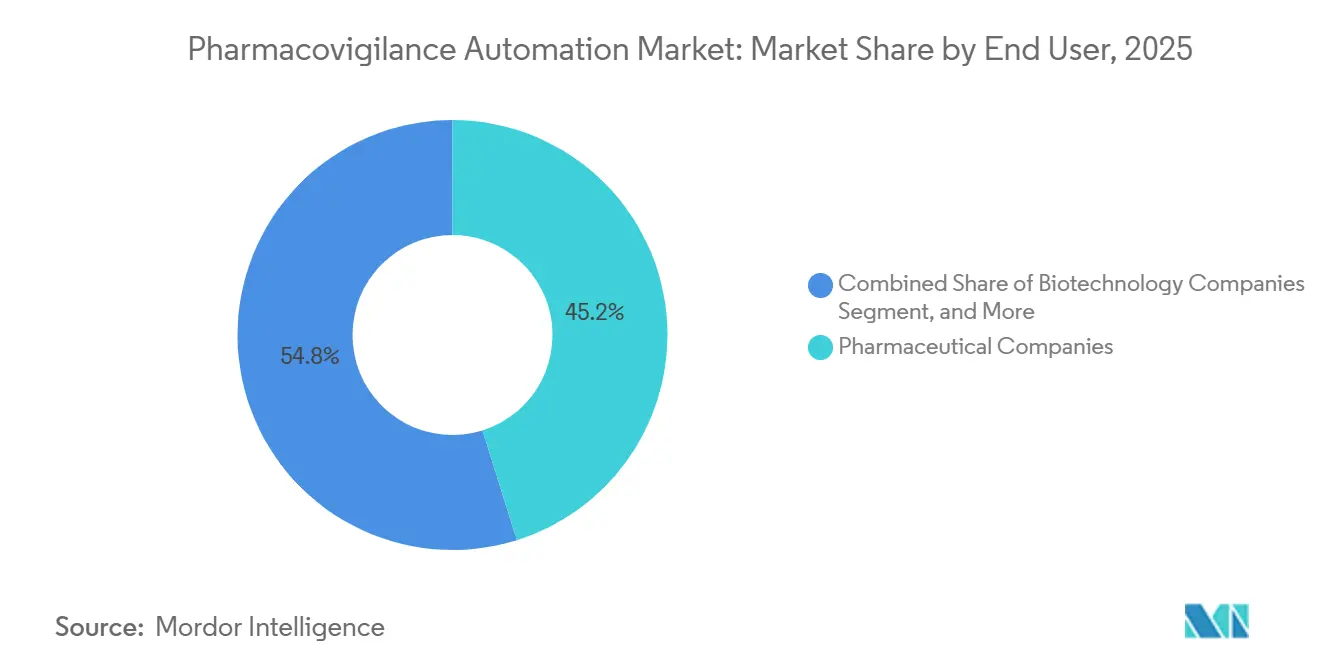
CROs Capitalize on Outsourcing WavePharmaceutical companies owned 45.16% of 2025 revenue, still the single-largest block of spending. CROs, however, are sprinting ahead at 17.61% CAGR, aided by tiered, volume-based pricing after PrimeVigilance’s Argus-Cloud migration in July 2025. Biotechs juggling small pipelines lean heavily on managed-service bundles to avoid fixed headcount.
Device makers, academia, and health authorities contribute modestly but provide specialized requirements such as registry interfaces for post-market surveillance that vendors increasingly productize. Whether large pharma reinsources work to oversee complex gene-therapy follow-up could shift the trajectory, but through 2031, CRO uptake remains a cornerstone growth lever for the pharmacovigilance automation market.
Geography Analysis
North America Pharmacovigilance Automation Market
North America generated 36.48% of 2025 revenue due to the FDA’s aggressive enforcement and early AI uptake. Form 483 observations tied to safety deficiencies jumped 23% in 2024, pushing sponsors toward automated duplicate checking and narrative summarization. The January 2026 FDA–EMA AI principles further embolden investment by clarifying validation expectations. Canada and Mexico, though smaller, benefit from USMCA alignment that encourages centralized case-intake hubs. Integration headaches with entrenched Argus databases slow cloud conversions, sustaining a parallel demand stream for service consultants inside the pharmacovigilance automation market.
Europe Pharmacovigilance Automation Market
Europe ranks second in revenue and benefits from EMA initiatives such as DARWIN EU and the Pharmacovigilance Risk Assessment Committee’s 2026 compliance-monitoring pilots. Germany, the United Kingdom, France, Italy, and Spain host dense pharma clusters driving license activity. GDPR’s tough stance shapes deployment choices, explaining why hybrid architectures grow quickly. Recent ICH updates dovetail with European e-submission gateways, reducing customization overhead for vendors and making the region an attractive early-mover playground for the pharmacovigilance automation market.
APAC, MEA and LATAM Pharmacovigilance Automation Market
Asia-Pacific is the fastest mover with a 19.34% CAGR through 2031, encouraged by China’s 2024 e-submission mandate and India’s mobile-app surge. Japan’s MIHARI demonstrates tangible ROI by catching signals six months earlier, inspiring copycats in South Korea and Australia. Localization rules like China’s PIPL foster domestic-cloud partnerships with Alibaba and Tencent, spawning a region-specific ecosystem inside the broader pharmacovigilance automation market. Middle East, Africa, and South America remain nascent but could accelerate post-2028 as GCC regulators build digital infrastructure and Latin American countries harmonize with ICH standards.
Competitive Landscape
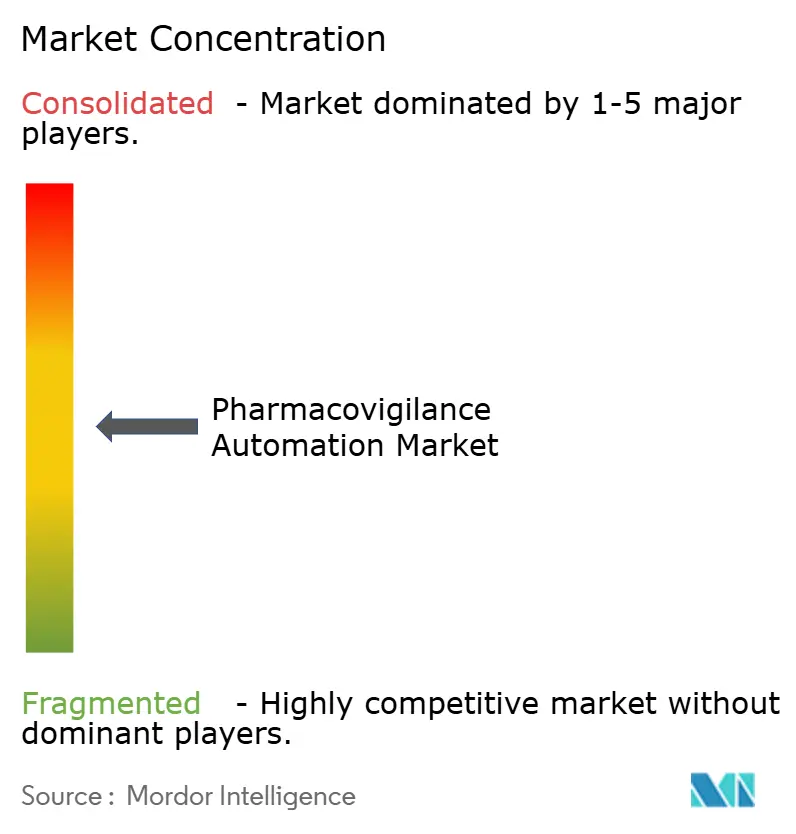
The pharmacovigilance automation market remains moderately concentrated. Oracle, ArisGlobal, Veeva Systems, and IQVIA command sizable installed bases among the top-20 pharma, benefiting from embedded workflows and multi-year validation locks. IQVIA’s August 2025 rapprochement with Veeva links Vigilance to Vault Safety, removing a long-standing data-flow bottleneck and helping sponsors simplify compliance stacks.
Niche vendors such as AB Cube, EXTEDO, and RxLogix carve regional or functional beachheads by offering modular APIs that bolt onto legacy databases without ripping and replacing. White-space opportunities include ePRO adverse-event triggers for decentralized trials, an area where Medidata is active, and blockchain audit trails being piloted by two US-based majors. Consulting giants Accenture, Cognizant, Genpact, and TCS bundle technology implementation with managed services, leveraging offshore labor to undercut CRO pricing but facing scrutiny over domain depth.
Pharmacovigilance Automation Industry Leaders
-
ArisGlobal
-
IBM Watson Health
-
IQVIA
-
Veeva Systems
-
AB Cube
- *Disclaimer: Major Players sorted in no particular order
Pharmacovigilance Automation Market Companies Covered in this Report
- AB Cube
- Accenture
- Aris Global
- BioClinica (Clario)
- Capgemini
- Cognizant
- Ennov
- EXTEDO
- Genpact
- IBM
- IQVIA
- Kinapse (Syneos Health)
- Oracle
- Parexel International
- ProductLife Group
- RxLogix
- Sparta Systems (Honeywell)
- TCS
- United BioSource (UBC)
- Veeva Systems
- Wipro
Recent Industry Developments in Pharmacovigilance Automation Market
- January 2026: The FDA and EMA released joint principles demanding medical-device-grade validation for AI functions such as duplicate detection, narrative summarization, and causality coding, raising the compliance bar for vendors.
- August 2025: IQVIA and Veeva Systems formed a long-term alliance integrating IQVIA Vigilance with Veeva Vault Safety to eliminate manual data transfers.
- July 2025: EVERSANA introduced ORCHESTRATE PV, pledging 50% faster case handling and 40% lower manual labor through pre-trained AI models.
Global Pharmacovigilance Automation Market Report Scope
As per the scope of the report, pharmacovigilance automation refers to the use of advanced technologies such as artificial intelligence (AI), machine learning (ML), natural language processing (NLP), and robotic process automation (RPA) to streamline and automate drug safety monitoring processes. It enables efficient handling of adverse event reporting, case processing, signal detection, and regulatory compliance activities. Reducing manual intervention improves accuracy, speed, and consistency in pharmacovigilance workflows. This ultimately enhances patient safety and supports faster regulatory decision-making.
The pharmacovigilance automation market is segmented by component, technology, functionality, deployment mode, end user, and geography. By component, the market is segmented into software and services. By technology, the market is segmented into artificial intelligence & machine learning, natural language processing, robotic process automation, and others. By functionality, the market is segmented into automated case processing, adverse event reporting, signal detection & risk management, medical literature monitoring, and others. By deployment mode, the market is segmented into cloud-based, on-premise, and hybrid. By end user, the market is segmented into pharmaceutical companies, biotechnology companies, contract research organizations (CROs), and others. By geography, the market is segmented into North America, Europe, Asia-Pacific, the Middle East and Africa, and South America. The market report also covers estimated market sizes and market trends for 17 countries across major regions worldwide. The report offers market value (in USD) for the above segments.
Segmentation Overview
| Software |
| Services |
| Artificial Intelligence (AI) & Machine Learning (ML) |
| Natural Language Processing (NLP) |
| Robotic Process Automation (RPA) |
| Others |
| Automated Case Processing |
| Adverse Event Reporting |
| Signal Detection & Risk Management |
| Medical Literature Monitoring |
| Others |
| Cloud-based |
| On-premise |
| Hybrid |
| Pharmaceutical Companies |
| Biotechnology Companies |
| Contract Research Organizations (CROs) |
| Others |
| North America | United States |
| Canada | |
| Mexico | |
| Europe | Germany |
| United Kingdom | |
| France | |
| Italy | |
| Spain | |
| Rest of Europe | |
| Asia-Pacific | China |
| India | |
| Japan | |
| Australia | |
| South Korea | |
| Rest of Asia-Pacific | |
| Middle East and Africa | GCC |
| South Africa | |
| Rest of Middle East and Africa | |
| South America | Brazil |
| Argentina | |
| Rest of South America |
| By Component | Software | |
| Services | ||
| By Technology | Artificial Intelligence (AI) & Machine Learning (ML) | |
| Natural Language Processing (NLP) | ||
| Robotic Process Automation (RPA) | ||
| Others | ||
| By Functionality | Automated Case Processing | |
| Adverse Event Reporting | ||
| Signal Detection & Risk Management | ||
| Medical Literature Monitoring | ||
| Others | ||
| By Deployment Mode | Cloud-based | |
| On-premise | ||
| Hybrid | ||
| By End User | Pharmaceutical Companies | |
| Biotechnology Companies | ||
| Contract Research Organizations (CROs) | ||
| Others | ||
| By Geography | North America | United States |
| Canada | ||
| Mexico | ||
| Europe | Germany | |
| United Kingdom | ||
| France | ||
| Italy | ||
| Spain | ||
| Rest of Europe | ||
| Asia-Pacific | China | |
| India | ||
| Japan | ||
| Australia | ||
| South Korea | ||
| Rest of Asia-Pacific | ||
| Middle East and Africa | GCC | |
| South Africa | ||
| Rest of Middle East and Africa | ||
| South America | Brazil | |
| Argentina | ||
| Rest of South America | ||
Key Questions Answered in the Report
How fast is the pharmacovigilance automation market expected to grow through 2031?
The pharmacovigilance automation market is forecast to expand at a 13.42% CAGR between 2026 and 2031.
Which component segment is expanding the quickest?
Services are projected to grow at 14.31% CAGR through 2031 as sponsors outsource analytics and case processing.
What region will register the highest growth?
Asia-Pacific is set to record a 19.34% CAGR to 2031 on the back of China’s e-submission mandate and Japan’s MIHARI real-world-data network.
Which technology is gaining momentum the fastest?
Natural-language processing leads with a 15.92% CAGR due to demand for unstructured narrative parsing across multiple languages.
Why are hybrid deployments increasing?
Organizations adopt hybrid models to reconcile strict data-residency laws like GDPR and PIPL with the scalability of cloud analytics.
What is driving CRO growth in the space?
Contract research organizations benefit from variable-cost outsourcing models that appeal to biotechs and large pharma seeking flexibility in safety operations.