Pharmacovigilance Market Size and Share
Market Overview
| Study Period | 2020 - 2031 |
|---|---|
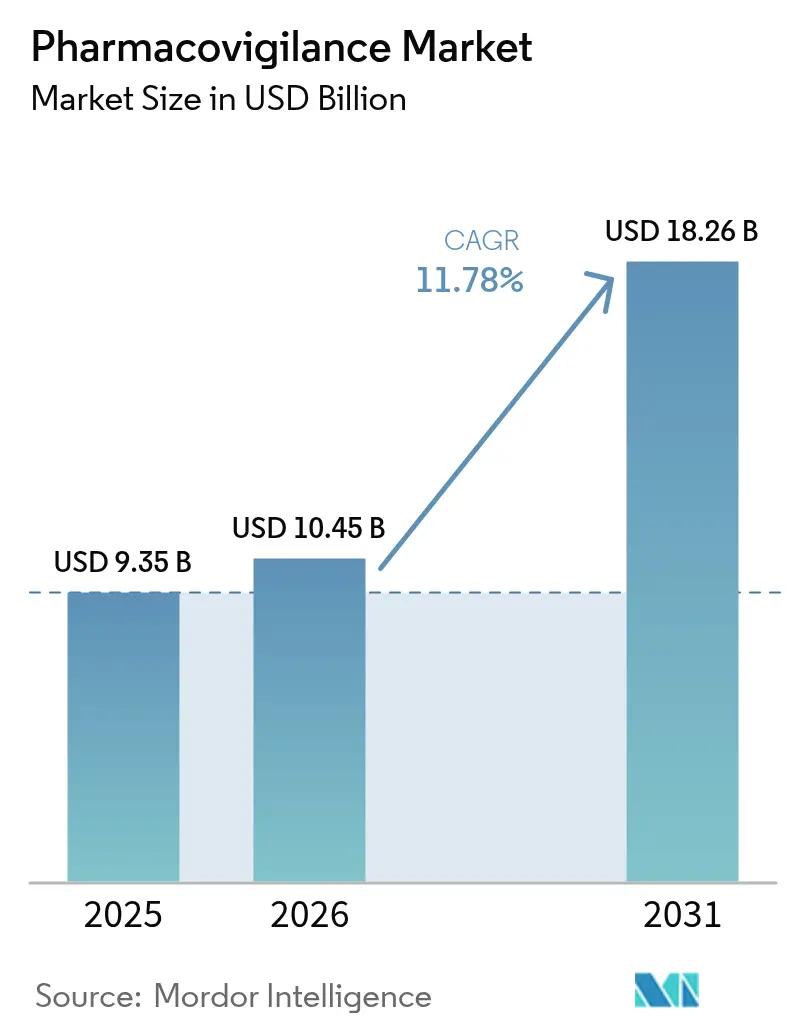
| Market Size (2026) | USD 10.45 Billion |
| Market Size (2031) | USD 18.26 Billion |
| Growth Rate (2026 - 2031) | 11.78% CAGR |
| Fastest Growing Market | Asia Pacific |
| Largest Market | North America |
| Market Concentration | Medium |
Major Players*Disclaimer: Major Players sorted in no particular order Image © Mordor Intelligence. Reuse requires attribution under CC BY 4.0. | |
Pharmacovigilance Market Analysis by Mordor Intelligence
The pharmacovigilance market size was valued at USD 9.35 billion in 2025 and estimated to grow from USD 10.45 billion in 2026 to reach USD 18.26 billion by 2031, at a CAGR of 11.78% during the forecast period (2026-2031). Expanding drug pipelines, stricter post-marketing surveillance rules and rapid adoption of artificial intelligence (AI) across safety-monitoring workflows sustain this momentum.[1]European Medicines Agency, “Guidance on the Application of the Amended Variations Regulation,” ema.europa.eu Pharmaceutical companies are redirecting resources toward proactive safety management as biologics, gene therapies and other complex modalities enter commercial use. Contract research organizations (CROs) equipped with cloud-based AI platforms offer cost-efficient compliance, accelerating the outsourcing shift. Post-marketing surveillance obligations enlarge data volumes, making electronic health record (EHR) mining the fastest-growing reporting method. North America retains leadership owing to mature regulatory science, but harmonization initiatives in Asia-Pacific (APAC) propel that region’s double-digit growth.[2]Food and Drug Administration, “International Regulatory Harmonization,” fda.gov
Key Report Takeaways
- By service provider, contract outsourcing led with 54.88% revenue share in 2025; the segment is expanding at a 13.48% CAGR to 2031.
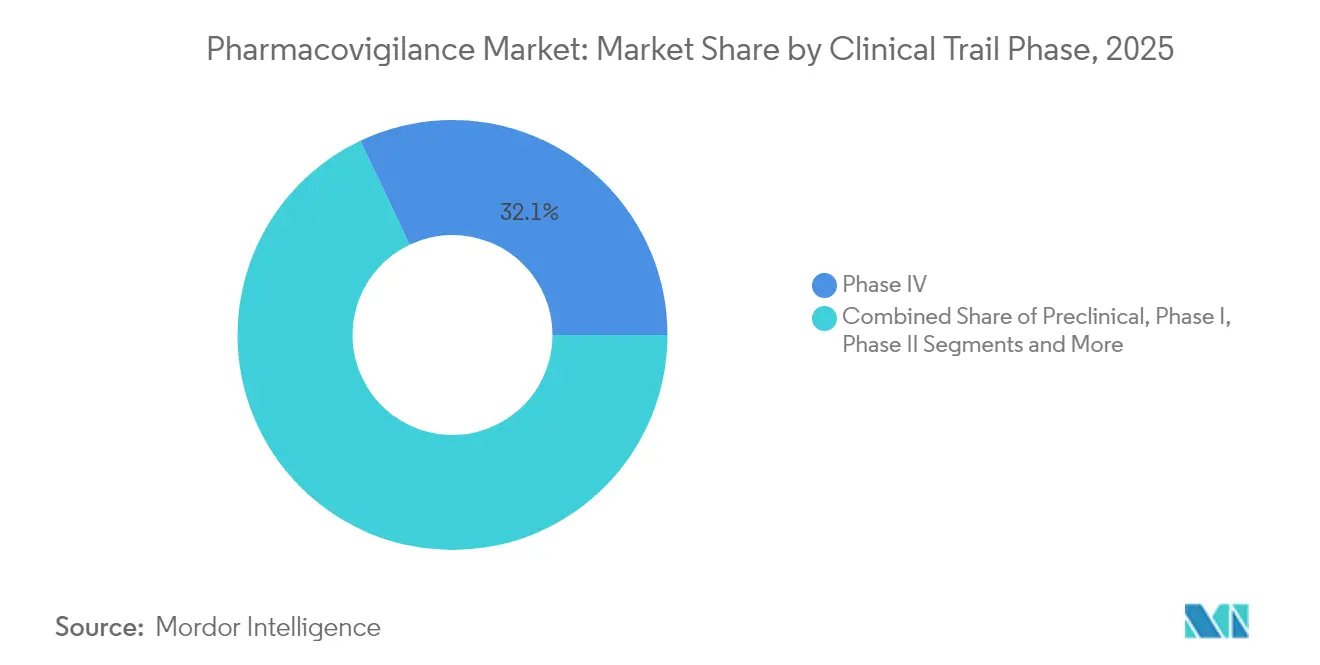
- By clinical trial phase, Phase IV post-marketing studies held 32.05% of pharmacovigilance market share in 2025, while pre-clinical activities post the highest 12.88% CAGR through 2031.
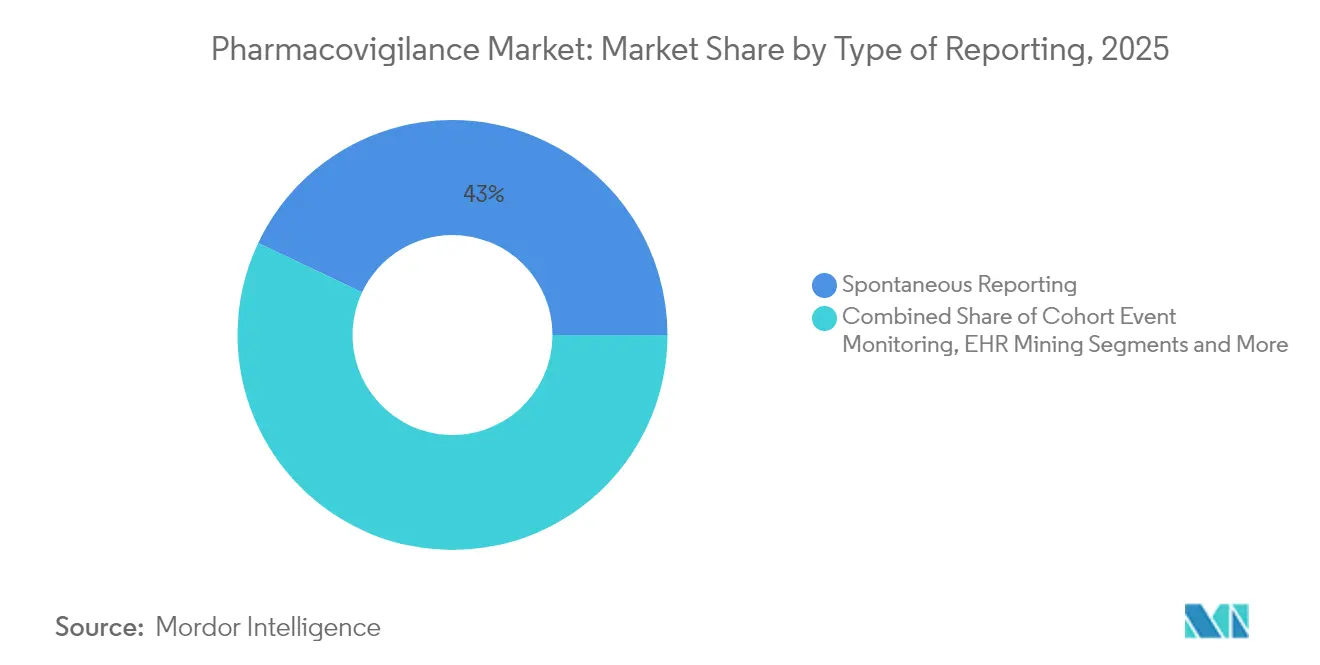
- By type of reporting, spontaneous reporting commanded 42.96% share of the pharmacovigilance market size in 2025; EHR mining is projected to grow at a 14.12% CAGR between 2026-2031.
- By end-user, pharmaceutical companies accounted for 58.91% share of the pharmacovigilance market size in 2025 and hospitals are advancing at a 14.18% CAGR through 2031.
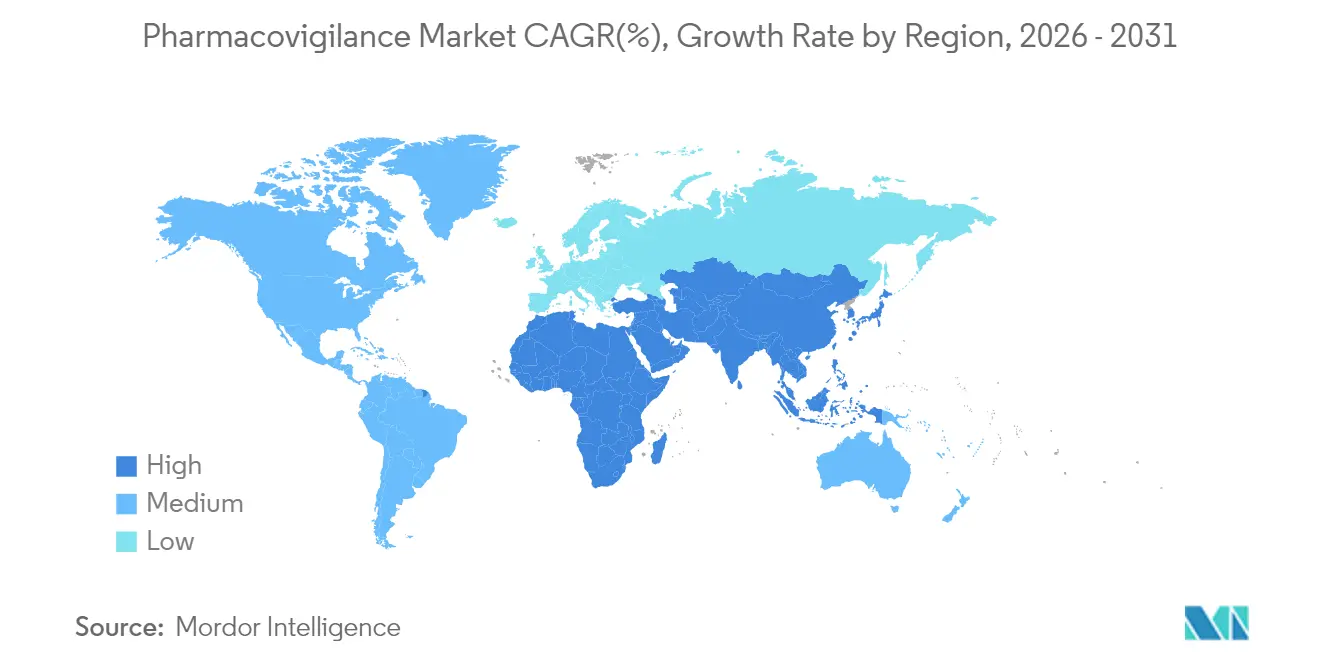
- By geography, North America held 43.62% of the pharmacovigilance market share in 2025, while APAC records the fastest 13.12% CAGR to 2031.
Note: Market size and forecast figures in this report are generated using Mordor Intelligence’s proprietary estimation framework, updated with the latest available data and insights as of 2026.
Global Pharmacovigilance Market Trends and Insights
Drivers Impact Analysis*
| Driver | (~) % Impact on CAGR Forecast | Geographic Relevance | Impact Timeline |
|---|---|---|---|
| Escalating drug consumption & development pipeline | +2.1% | Global | Long term (≥ 4 years) |
| Growing incidence of adverse drug reactions (ADRs) | +1.8% | Global, aging populations | Medium term (2-4 years) |
| Outsourcing of PV services to CRO/BPO vendors | +2.3% | North America & EU, rising in APAC | Short term (≤ 2 years) |
| AI-enabled signal detection & predictive analytics | +1.9% | North America & EU core, spill-over APAC | Medium term (2-4 years) |
| Expansion of real-world evidence (RWE) platforms | +1.7% | US & EU lead, global spread | Long term (≥ 4 years) |
| Stringent regulatory mandates for proactive post-marketing safety | +2.0% | Global | Long term (≥ 4 years) |
| Source: Mordor Intelligence | |||
Increasing Drug Consumption & Development Pipeline
The FDA cleared 50 new molecular entities in 2024, underscoring how breakthrough approvals widen post-marketing safety duties for every sponsor.[3]Food and Drug Administration, “Drug and Biologic Approvals,” fda.gov Gene therapies, CAR-T treatments and combination products pose unique risk profiles that require vigilant monitoring throughout the product life cycle. Conditional approvals further heighten real-world evidence (RWE) expectations, redirecting budgets toward continuous surveillance infrastructures. These dynamics lock pharmacovigilance teams into a long-term expansion cycle that sustains workload growth beyond clinical development.
Growing Incidence Of Adverse Drug Reactions (ADRs)
The European Medicines Agency (EMA) Pharmacovigilance Risk Assessment Committee (PRAC) recently emphasized lifelong monitoring for CAR-T recipients after observing potential secondary malignancies.[4]European Medicines Agency, “PRAC Meeting Highlights,” ema.europa.eu Polypharmacy in elderly populations multiplies drug–drug interactions, pushing ADR case volumes higher. The pandemic-era vaccine rollout validated the importance of large-scale signal-detection networks capable of processing millions of safety reports within weeks.
Outsourcing Of PV Services To CRO/BPO Vendors
Sponsors are increasingly transferring full pharmacovigilance operations to CROs that maintain global compliance hubs and purpose-built AI engines. Such providers scale seamlessly across jurisdictions, enabling mid-sized biotechnology firms to meet complex rules without sustaining heavy fixed costs. Labor-arbitrage models in India and Eastern Europe also hold appeal, yet differentiation now rests on automated intake and predictive signal detection rather than pure cost savings.
AI-Enabled Signal Detection & Predictive Analytics
IQVIA targets a 50% reduction in routine case-processing spend by integrating large-language-model (LLM) copilots into daily workflows. Meanwhile, Oracle embedded advanced machine-learning features in its safety platform to triage literature alerts and automate narrative writing. Regulators have responded with draft guidance that sets validation expectations for AI use in safety management.
Restraints Impact Analysis*
| Restraint | (~) % Impact on CAGR Forecast | Geographic Relevance | Impact Timeline |
|---|---|---|---|
| Cyber-security & data-privacy risks | -1.4% | Global, high in EU & US | Short term (≤ 2 years) |
| Lack of global regulatory harmonisation & data standards | -1.2% | Global, emerging markets hardest hit | Long term (≥ 4 years) |
| Shortage of specialised PV talent & high turnover | -1.6% | North America & EU acute | Medium term (2-4 years) |
| Complexity of combination & ATMP therapies | -1.1% | North America & EU, widening | Long term (≥ 4 years) |
| Source: Mordor Intelligence | |||
Cyber-Security & Data-Privacy Risks
Cloud deployment of sensitive patient data exposes safety systems to ransomware and nation-state intrusions. Recent healthcare breaches forced several sponsors to suspend EHR integrations while audits ensured no safety signal manipulation occurred. General Data Protection Regulation (GDPR) and similar laws mandate data-minimization and localization strategies that sometimes conflict with global analytics ambitions.
Shortage Of Specialised PV Talent & High Staff Turnover
Industry surveys project a 35% shortage of qualified pharmacovigilance professionals by 2030 as AI skills, regulatory knowledge and therapeutic specialization converge into a single profile. Organizations respond with apprenticeship programs and internal academies, yet ramp-up times can exceed two years, creating near-term bottlenecks.
*Our forecasts treat driver/restraint impacts as directional, not additive. The impact forecasts reflect baseline growth, mix effects, and variable interactions.
Segment Analysis
By Clinical Trial Phase: Post-Marketing Surveillance Drives Growth
Phase IV studies held 32.05% of pharmacovigilance market share in 2025, reflecting regulators’ demand for life-long monitoring of innovative therapies. The pharmacovigilance market size attached to pre-clinical safety assessments is projected to expand at a 12.88% CAGR thanks to risk-based early-phase analytics. Adaptive trial designs shorten Phases II and III, but heighten the importance of high-fidelity signal detection once products reach broad populations. Updated ICH E6(R3) guidelines compel sponsors to embed quality-by-design metrics across all phases, ensuring traceable safety data capture from first-in-human dosing.
The pharmacovigilance market responds by integrating decentralized trials with direct-to-patient sampling and wearable sensors. AI models simulate off-target effects before first-patient dosing, giving companies a head start in risk-management planning. As conditional approvals rise, Post-Authorization Safety Studies (PASS) budgets eclipse traditional Phase III spends, locking Phase IV dominance into the long-term outlook.


By Service Provider: Outsourcing Accelerates Through Technology Integration
Contract outsourcing controlled 54.88% of overall revenue in 2025 and is forecast to grow at 13.48% through 2031, sustaining the largest slice of the pharmacovigilance market. In-house units retain critical decision-making but increasingly rely on hybrid models where CRO platforms process routine tasks. Strategic alliances such as Parexel’s multi-year AI pact with Palantir exemplify how tech-enhanced CROs cultivate competitive edge.
The pharmacovigilance industry now values scalable data lakes, natural language processing (NLP) for scientific literature and robotic process automation in intake. As a result, even large pharmaceutical companies migrate workloads to external hubs in India, Ireland and Eastern Europe, consolidating fragmented vendor lists into master service agreements that guarantee AI investment roadmaps.
By Type of Reporting: EHR Mining Emerges as Technology Disruptor
Spontaneous reporting remained the backbone at 42.96% in 2025, yet the pharmacovigilance market size tied to EHR mining is expected to post the fastest 14.12% CAGR. Final FDA guidance on RWE opens the door for automated extraction of structured and unstructured clinical data to augment traditional case submissions.
AI algorithms parse physician notes, lab results and imaging repositories to reveal hidden safety trends weeks earlier than spontaneous reports. Projects such as Sanofi’s ARTEMIS process more than 700,000 cases annually with NLP engines, freeing human experts for root-cause analysis. Standardization hurdles persist, particularly around data provenance, but the trajectory toward automated RWE ingestion is clear.
By End-User: Hospital Integration Transforms Safety Monitoring
Pharmaceutical companies held 58.91% of 2025 spending, yet hospital systems register the highest 14.18% CAGR as decentralized and pragmatic trials place safety responsibilities closer to the point of care. The pharmacovigilance market size associated with integrated delivery networks rises as hospitals deploy RWE platforms that feed near-real-time safety data to sponsors.
BARDA’s five-year pact with Allucent illustrates how government funding accelerates hospital participation in countermeasure trials. Yet interoperability gaps and privacy regulations still slow cross-border data exchange, prolonging the transition period.
Geography Analysis
North America captured 43.62% of the pharmacovigilance market in 2025 due to high R&D intensity, advanced EHR penetration and clear regulatory expectations. AI pilots gain rapid acceptance as the FDA publishes step-wise validation frameworks, positioning the region as the global reference for digital pharmacovigilance.
Europe follows with mature legislation underpinning the EudraVigilance network and new AI reflection papers that encourage innovation while demanding algorithm transparency. Focus on Advanced Therapy Medicinal Products brings specialized monitoring needs, sustaining investment through 2030. The pharmacovigilance market size for EU-based PASS grows alongside orphan-drug approvals.
Asia-Pacific is projected to log a 13.12% CAGR, the fastest worldwide, as China’s regulatory reforms and India’s expanded clinical-trial landscape converge. ASEAN nations align labeling and electronic submission standards, simplifying multi-country safety campaigns. Investments in domestic biotech manufacturing stimulate demand for localized case-processing hubs. Middle East & Africa and South America add incremental growth where pharmacovigilance infrastructure scales with pharmaceutical import volumes and emerging manufacturing clusters.

Competitive Landscape
The pharmacovigilance market shows moderate fragmentation. IQVIA, ICON and Parexel maintain sizable global footprints, yet software-first providers such as ArisGlobal and Oracle are narrowing the gap through AI-centric offerings. ArisGlobal upgraded its LifeSphere suite with LLM-powered triage and saw a record wave of new customers in 2024.
Strategic deals define the competitive narrative. ICON’s acquisition of PRA Health Sciences consolidated two full-service CROs under one AI platform, increasing scale in both post-marketing and real-world studies. Sanofi’s collaboration with OpenAI and Formation Bio signals big-pharma interest in vertically integrating AI software development.
White-space niches persist in advanced cell-and-gene therapy surveillance, pediatric drug safety and NLP solutions for Japanese and Mandarin source documents. New entrants offering plug-and-play safety clouds or token-based data-exchange models could capture share from incumbents slow to modernize legacy platforms.
Pharmacovigilance Industry Leaders
Cognizant
Capgemini
Accenture
Wipro Limited
IBM
- *Disclaimer: Major Players sorted in no particular order

Recent Industry Developments
- January 2025: ArisGlobal reported significant customer growth and product enhancements across its LifeSphere platform.
- September 2024: IQVIA launched its AI Assistant to accelerate signal detection by synthesizing vast healthcare datasets.
- September 2024: Boehringer Ingelheim extended the LifeSphere MultiVigilance platform to Japan, reinforcing APAC capabilities.
- May 2024: Sanofi, Formation Bio and OpenAI unveiled an AI partnership to shorten drug-development and safety timelines.


Research Methodology Framework and Report Scope
Market Definitions and Key Coverage
Our study defines the pharmacovigilance market as every commercial or nonprofit activity that detects, assesses, understands, and prevents adverse effects or other drug-related problems across the full product life cycle, from pre-clinical evaluation to post-marketing Phase IV surveillance. Revenues include in-house and outsourced service fees tied to case intake, signal detection, risk management, literature screening, and safety analytics.
Scope exclusion: Pure-play drug-safety software license sales are covered in a separate Mordor Intelligence report and therefore excluded here.
Segmentation Overview
- By Clinical Trial Phase
- Pre-clinical
- Phase I
- Phase II
- Phase III
- Phase IV
- By Service Provider
- In-house
- Contract Outsourcing
- By Type of Reporting
- Spontaneous Reporting
- Intensified ADR Reporting
- Targeted Spontaneous Reporting
- Cohort Event Monitoring
- EHR Mining
- By End-User
- Hospitals
- Pharmaceutical Companies
- CROs & Other End-Users
- By Geography
- North America
- United States
- Canada
- Mexico
- Europe
- Germany
- United Kingdom
- France
- Italy
- Spain
- Rest of Europe
- Asia-Pacific
- China
- Japan
- India
- Australia
- South Korea
- Rest of Asia-Pacific
- Middle East and Africa
- GCC
- South Africa
- Rest of Middle East and Africa
- South America
- Brazil
- Argentina
- Rest of South America
- North America
Detailed Research Methodology and Data Validation
Primary Research
Our analysts spoke with safety directors at pharmaceutical majors, CRO leaders in North America, Europe, and Asia, as well as regulators who audit Individual Case Safety Reports. These conversations validated regional reporting volumes, outsourcing penetration, and emerging AI use, while pharmacy surveys highlighted under-reporting nuances.
Desk Research
We begin by mapping the regulatory and workload landscape through open sources such as WHO VigiBase summaries, FDA FAERS dashboards, EMA EudraVigilance releases, and yearly ICH guideline updates. Next, we review professional bodies' briefs from DIA and ISoP, patent filings via Questel, and audited statements obtained through D&B Hoovers. To place these signals in context, we, the analyst team, mine 10-Ks, investor decks, peer-reviewed journals, and news traces captured on Dow Jones Factiva. This list is illustrative; many additional documents guide data checks and clarifications.
Market-Sizing & Forecasting
A top-down and bottom-up blended model anchors the numbers. We first size demand from annual adverse-event submissions, approved new molecular entities, and trial starts, then test the totals against sampled supplier roll-ups of case volumes times blended processing costs. Key variables include FDA/EMA warning-letter frequency, outsourcing share shifts, average cases per molecule, regional wage inflation, and AI-enabled productivity gains. Multivariate regression with scenario analysis projects 2025-2030 values, and any data gaps are bridged with region-specific workload coefficients derived from interviews.
Data Validation & Update Cycle
Outputs pass three-layer variance checks, peer review, and supervisor sign-off. We benchmark results against independent filing trends; material deviations trigger fresh source calls. Reports refresh each year, with interim updates when major regulatory or merger events alter assumptions.
Why Mordor's Pharmacovigilance Baseline Commands Reliability
Published estimates often diverge because firms draw market boundaries differently, apply distinct inflation bases, or overlook currency swings. We address these issues upfront and tie our baseline to verifiable safety workloads.
Key gap drivers include competitors blending software sales with service revenue, assuming static processing tariffs, or applying blanket under-reporting discounts that ignore regional maturity. Our team updates exchange rates quarterly and rebuilds volume assumptions annually, keeping our view current and balanced.
Benchmark comparison
| Market Size | Anonymized source | Primary gap driver |
|---|---|---|
| USD 9.35 B | Mordor Intelligence | - |
| USD 10.36 B | Global Consultancy A | Includes software revenue and double counts 2024 inflation |
| USD 8.58 B | Industry Association B | Uses outdated 2019 case ratios, omits recent warning-letter spike |
| USD 8.03 B | Regional Consultancy C | Excludes Asia outsourcing surge and fixes 2023 exchange rates |
In short, our disciplined scope, live primary inputs, and yearly rebuild mean decision-makers receive a transparent baseline that traces directly to observable safety workloads and can be replicated by any analyst with similar data access.


Key Questions Answered in the Report
What is the current value of the pharmacovigilance market?
The pharmacovigilance market is valued at USD 10.45 billion in 2026.
How fast will the pharmacovigilance market grow through 2031?
It is projected to expand at an 11.78% CAGR, reaching USD 18.26 billion by 2031.
Which service model holds the largest pharmacovigilance market share?
Contract outsourcing leads with 54.88% of 2025 revenue.
Why is Asia-Pacific the fastest-growing region?
Regulatory harmonization across China, India and ASEAN nations plus large manufacturing investments drive APAC’s 13.12% CAGR.
Page last updated on:


