
Market Overview
| Study Period | 2020 - 2031 |
|---|---|
| Market Size (2026) | USD 196.33 Billion |
| Market Size (2031) | USD 268.37 Billion |
| Growth Rate (2026 - 2031) | 6.45 % |
| Fastest Growing Market | Asia Pacific |
| Largest Market | North America |
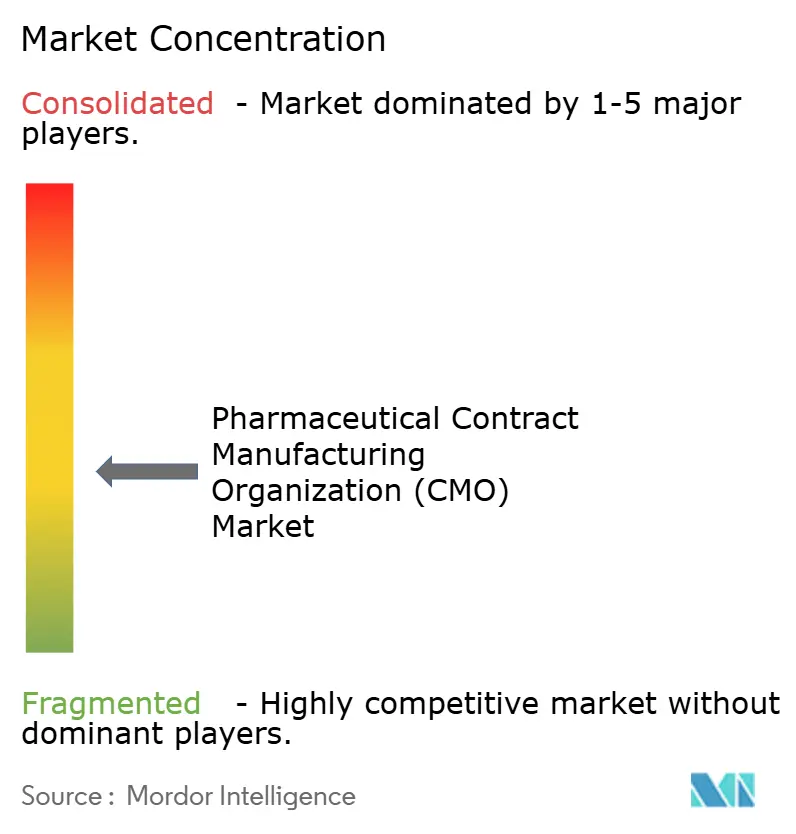
| Market Concentration | Medium |
Major Players *Disclaimer: Major Players sorted in no particular order Image © Mordor Intelligence. Reuse requires attribution under CC BY 4.0. | |
Pharmaceutical Contract Manufacturing Organization (CMO) Market Analysis by Mordor Intelligence
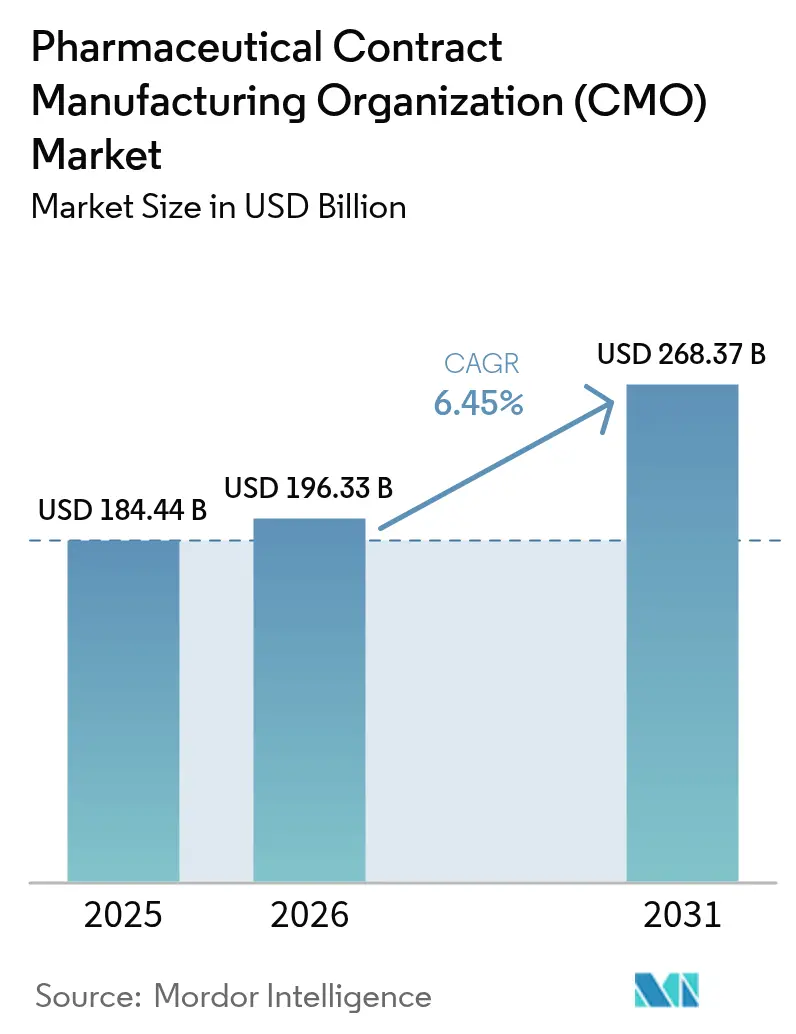
The pharmaceutical contract manufacturing organization market size is expected to grow from USD 184.44 billion in 2025 to USD 196.33 billion in 2026 and is forecast to reach USD 268.37 billion by 2031 at 6.45% CAGR over 2026-2031. Momentum stems from the industry’s strategic realignment toward core discovery and commercialization tasks, leaving complex production activities to specialized partners. Venture-capital inflows into virtual biotechs, record approvals of advanced therapies, and expanding high-potency API pipelines are reinforcing the shift toward external capacity. Meanwhile, cost pressures, regulatory scrutiny, and the need for state-of-the-art technologies are motivating big pharma, specialty players, and generics alike to deepen collaboration with qualified contract manufacturers. Providers able to bundle development, scale-up, and fill-finish services while maintaining global quality standards continue to capture disproportionate opportunities within the pharmaceutical contract manufacturing organization market. [1]“FDA Announces Enhanced Inspection Protocols for 2024,” U.S. Food and Drug Administration, fda.gov
Key Report Takeaways
- By service type, API manufacturing led with 41.98% of the pharmaceutical contract manufacturing organization market share in 2025, at a 6.44% CAGR through 2031.
- By scale of operation, commercial-scale agreements delivered 61.75% of 2025 revenue, and clinical-phase manufacturing is advancing at a 7.74% CAGR through 2031.
- By drug molecule, Small molecules still accounted for 56.85% of 2025 revenue, and advanced therapies are projected to expand at an 8.22% CAGR to 2031.
- By end user, large pharmaceutical sponsors represented 45.80% of revenue in 2025. However, emerging and virtual biotechs are rising fastest at a 6.89% CAGR to 2031.
- By therapeutic area, oncology generated 38.10% of 2025 revenue, central nervous system assets are accelerating at 8.88% CAGR to 2031.
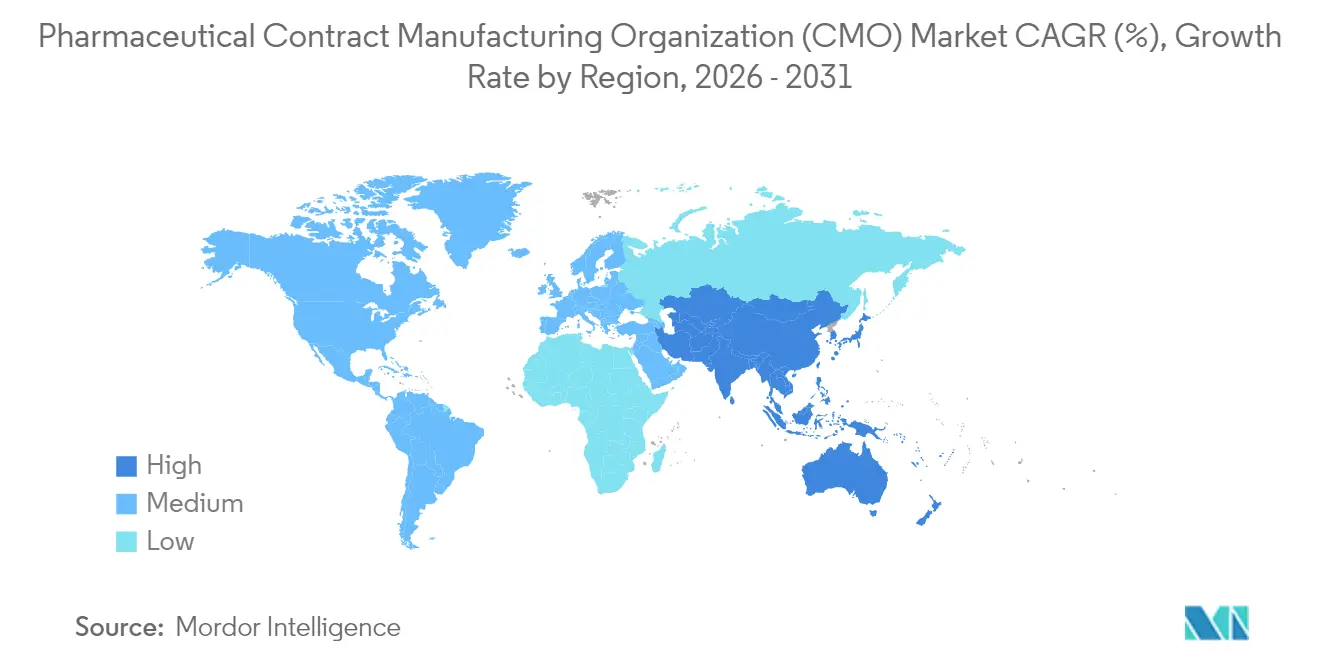
- By geography, North America held 39.85% of 2025 revenue, and Asia-Pacific is recording the highest regional CAGR at 8.91% through 2031.
Note: Market size and forecast figures in this report are generated using Mordor Intelligence’s proprietary estimation framework, updated with the latest available data and insights as of 2026.
Market Trends and Insights
Drivers Impact Analysis of Pharmaceutical Contract Manufacturing Organization (CMO) Market*
| Driver | (~) % Impact on CAGR Forecast | Geographic Relevance | Impact Timeline |
|---|---|---|---|
| Accelerating small and mid-sized pharma outsourcing | +1.2% | Global, concentrated in North America and Europe | Medium term (2-4 years) |
| Rising biologics pipeline complexity | +1.5% | Global, with APAC manufacturing hubs gaining share | Long term (≥ 4 years) |
| Increasing venture-capital funded virtual biotechs | +0.8% | North America and Europe primary, APAC secondary | Short term (≤ 2 years) |
| Demand spike for high-potency APIs (HPAPIs) | +0.9% | Global, with specialized facilities in developed markets | Medium term (2-4 years) |
| Growth of cell and gene therapy CDMO capacity | +1.1% | North America and Europe leading, APAC emerging | Long term (≥ 4 years) |
| ESG-linked supply chain qualification | +0.4% | Global, with stricter requirements in developed markets | Medium term (2-4 years) |
| Source: Mordor Intelligence | |||
Accelerating Small and Mid-Sized Pharma Outsourcing
Escalating compliance costs after the FDA’s 2024 inspection overhaul elevated annual quality expenses by USD 2-5 million for mid-tier plants. The capital burden is steering resource-constrained sponsors toward strategic outsourcing across oncology and rare-disease portfolios. Contract manufacturers with integrated development and commercial capabilities benefit from predictable pipeline inflows, while hybrid fee-for-service and risk-sharing models are gaining traction.
Rising Biologics Pipeline Complexity
Multi-specific antibodies, antibody-drug conjugates, and autologous cell therapies require distinctive upstream cell culture, purification, and cold-chain infrastructure that few innovators can justify in-house. Samsung Biologics committed USD 2.4 billion in 2024 to expand single-use bioreactor capacity, signaling the scale of investment necessary for modern biologics production.[2]“Samsung Biologics Announces USD 2.4 Billion Capacity Expansion,” Samsung Biologics, samsungbiologics.com Providers offering turnkey process development, viral clearance, and fill-finish services are now critical partners across biologics life cycles.
Increasing Venture-Capital-Funded Virtual Biotechs
Venture investors poured USD 15 billion into asset-light biotech startups during 2024, many of which operate without brick-and-mortar laboratories. These companies favor agile, milestone-based contracts, encouraging CDMOs to provide modular suites, real-time batch visibility, and tech-transfer readiness across multiple production sites. Flexible capacity allocation and rapid scale-up remain central differentiators for winning virtual biotech mandates.
Demand Spike for High-Potency APIs (HPAPIs)
Targeted oncology drugs, hormones, and immunomodulators increasingly rely on sub-microgram dosing regimens that mandate stringent containment and sophisticated occupational-exposure controls. Greenfield HPAPI suites often exceed USD 50 million per facility, prompting sponsors to rely on specialized contractors. CDMOs with closed isolator systems and validated cleaning protocols capture premium pricing and multi-year contracts as HPAPI pipelines grow.
Restraints Impact Analysis of Pharmaceutical Contract Manufacturing Organization (CMO) Market*
| Restraint | (~) % Impact on CAGR Forecast | Geographic Relevance | Impact Timeline |
|---|---|---|---|
| Capacity bottlenecks in fill-finish lines | -0.7% | Global, particularly acute in North America and Europe | Short term (≤ 2 years) |
| Escalating regulatory inspections and remediation costs | -0.5% | Global, with higher impact in developed markets | Medium term (2-4 years) |
| Volatile single-use-systems supply | -0.3% | Global, affecting biologics manufacturing primarily | Short term (≤ 2 years) |
| Currency-driven cost inflation in emerging hubs | -0.4% | APAC and emerging markets primarily | Medium term (2-4 years) |
| Source: Mordor Intelligence | |||
Capacity Bottlenecks in Fill-Finish Lines
Utilization above 85% and lead times exceeding 18 months for complex injectables limit CDMOs’ ability to absorb new biologics programs. Sterile suites, advanced robotics, and serialization upgrades demand multi-year investments that delay relief, keeping short-term supply tight and potentially constraining near-term revenue realization.
Escalating Regulatory Inspections and Remediation Costs
The FDA’s enhanced framework lengthened average audits by 40% while expanding data-integrity checks. Observations linked to electronic batch records or aseptic deviations can trigger remediation costs up to USD 50 million, eroding margins for smaller providers and driving consolidation in the pharmaceutical contract manufacturing organization market.
*Our forecasts treat driver/restraint impacts as directional, not additive. The impact forecasts reflect baseline growth, mix effects, and variable interactions.
Pharmaceutical Contract Manufacturing Organization (CMO) Market Segment Analysis
By Service Type:
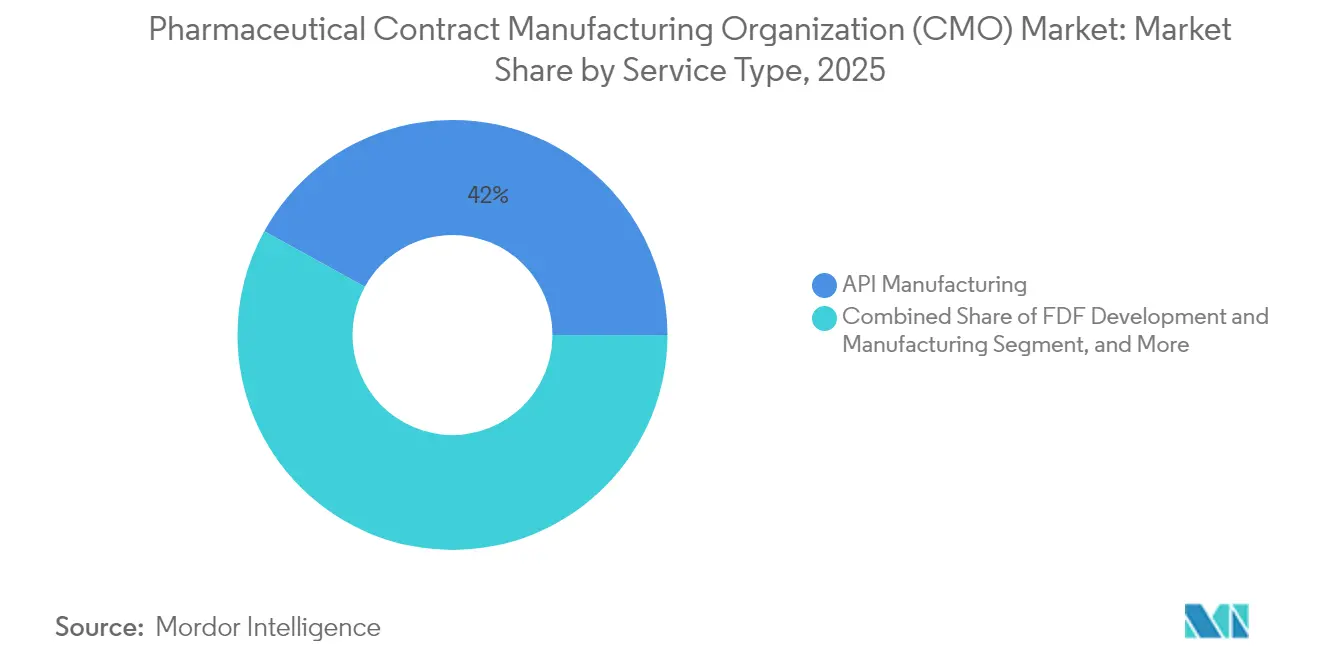
API Manufacturing Remains FoundationalAPI manufacturing held 41.98% of pharmaceutical contract manufacturing organization market share in 2025, underpinning broad generic and branded drug demand. While small-molecule volumes stay dominant, biologics and HPAPI capacity additions are shifting revenue mix toward higher-value offerings. Clients increasingly seek integrated services that co-locate synthesis, purification, and final dosage manufacturing to eliminate supply handoffs.
Contractors offering both solid-dose and injectable dose formulation capture economies of scope. Digital serialization, continuous manufacturing, and predictive maintenance are reshaping operating cost curves, creating new competitive thresholds for entry. Integration with packaging services, particularly tamper-evident and track-and-trace solutions, further differentiates providers.



By Drug Molecule Type:
Advanced Therapies Lead GrowthSmall molecules still accounted for 56.85% of 2025 revenue, yet advanced therapies pushed the fastest expansion at an 8.22% CAGR. Viral vector production, cell expansion know-how, and cryogenic storage now dominate CAPEX priorities as developers chase one-time curative potential. The pharmaceutical contract manufacturing organization market size for advanced therapies is projected to broaden as more approved products transition from autologous to allogeneic processes, necessitating larger, standardized manufacturing runs.
Biologics occupy an intermediate growth position thanks to biosimilar adoption and novel antibody formats. Sustained investment across all molecule classes affirms the strategic imperative for CDMOs to maintain diversified technology portfolios rather than single-platform specialisms.
By Scale of Operation:
Clinical Manufacturing’s Rising WeightCommercial-scale agreements delivered 61.75% of 2025 revenue, reflecting entrenched blockbuster supply contracts. Yet clinical-phase work is expanding at 7.74% CAGR, powered by record global R&D outlays of USD 244 billion in 2024. Flexible batch sizes, rapid changeovers, and regulatory filing support define success factors as clients demand speed over unit cost in early development.
Clinical services increasingly serve as first touchpoints that evolve into long-term commercial partnerships, locking in share of wallet throughout product life cycles in the pharmaceutical contract manufacturing organization market.
By End User:
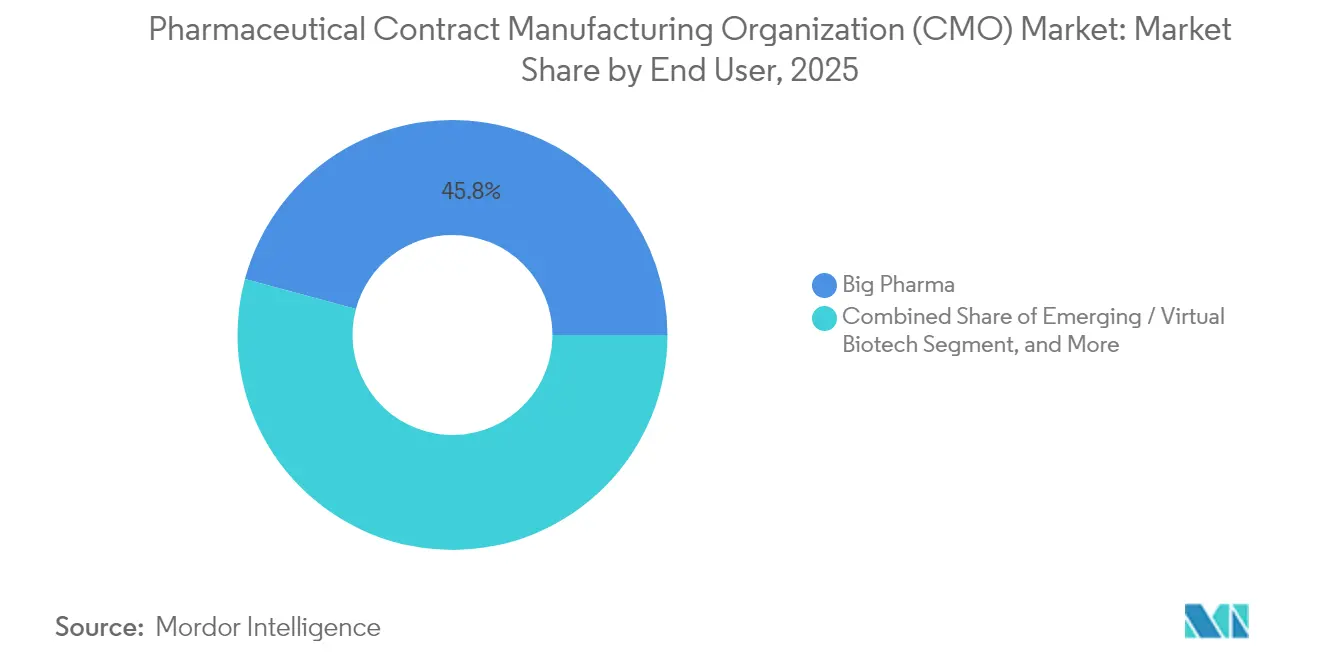
Virtual Biotech MomentumLarge pharmaceutical sponsors represented 45.80% of revenue in 2025, leveraging hybrid make-or-buy models to preserve capital and manage peaks in demand. However, emerging and virtual biotechs are rising fastest at a 6.89% CAGR, attracted to CDMOs with integrated discovery-to-commercial platforms. Their need for project management, regulatory documentation, and global supply orchestration positions full-service providers ahead of niche players.
Generics and specialty pharma sustain steady volumes, but price competition underscores the need for operational excellence and continuous improvement within the pharmaceutical contract manufacturing organization industry.
By Therapeutic Area:
Oncology Still Commands the Largest SliceOncology generated 38.10% of 2025 revenue, riding immunooncology, antibody-drug conjugate, and precision medicine breakthroughs. Central nervous system assets are accelerating at 8.88% CAGR following approvals of Alzheimer’s and rare neurology treatments. CDMOs with capability in blood-brain-barrier-penetrating formulations gain share in this emerging opportunity space.
Cardiovascular and infectious disease programs remain important but grow more slowly. Therapeutic diversification shields the pharmaceutical contract manufacturing organization market from single-area cyclicality while pressuring providers to maintain broad technology arsenals.
Geography Analysis
North America Pharmaceutical Contract Manufacturing Organization (CMO) Market
North America held 39.85% of 2025 revenue, supported by strong intellectual property frameworks, proximity to drug innovators, and deep regulatory expertise. Ongoing investment in continuous manufacturing and cell-therapy infrastructure keeps the region a preferred partner location, though high labor costs limit incremental capacity additions.
APAC Pharmaceutical Contract Manufacturing Organization (CMO) Market
Asia-Pacific is the fastest-growing region at a 8.91% CAGR, propelled by scale investments in China, India, and South Korea. Samsung Biologics’ USD 2.4 billion build-out exemplifies regional commitment to state-of-the-art biologics capacity. Currency volatility and evolving quality expectations pose operational challenges, yet lower fixed costs and government incentives sustain its attractiveness within the pharmaceutical contract manufacturing organization market.
EMEA Pharmaceutical Contract Manufacturing Organization (CMO) Market
Europe enjoys stable demand thanks to established clusters in Germany, Ireland, Switzerland, and Scandinavia. Harmonized EMA regulations foster cross-border supply chains, particularly in advanced therapies. Middle East and Africa remain nascent but show potential as governments pursue medicine security and local manufacturing mandates.

Regulatory Landscape
Regulatory oversight is tightening for CMOs and contract packagers, with more stringent inspection expectations, data-integrity focus, and product-identification requirements across major regions. In the United States, the FDA published a final rule in March 2026 establishing a mandatory 12-digit format for all FDA-assigned National Drug Codes (NDC), with an effective date of March 7, 2033. The change will require long-lead updates across labeling, barcoding, packaging artwork control, and master data systems that many CMOs support on behalf of multiple sponsors.
Trade and supply-chain policy is also shifting costs and sourcing decisions. In April 2026, the U.S. Executive Branch issued a Section 232 proclamation on pharmaceuticals and pharmaceutical ingredients that can impose up to 100% ad valorem duties on imported patented pharmaceuticals and ingredients effective July 31, 2026, for companies without specific onshoring or MFN-related arrangements. In Europe, EMA continues formal oversight of packaging materials for centrally authorized products via mandatory mock-up and specimen checks, while IDMP implementation steps, including a June 2026 deadline for submitting manufacturer and manufacturing business operations data for products under the Union List of Critical Medicines, increase the need for structured product and manufacturing data readiness across cross-border CMO networks.
Value Chain Analysis
The pharmaceutical CMO value chain runs from sponsor molecule selection and tech transfer through raw-material and component procurement (APIs, excipients, single-use systems, and packaging components), process development, clinical and commercial manufacturing, and quality control and release. Downstream activities include serialization, packaging, and distribution, with closer coordination increasingly required between development, manufacturing, and secondary packaging to reduce handoffs and support launch execution. This is most visible where sterile fill-finish, device assembly, and track-and-trace operations need to be aligned under GMP change control and sponsor-specific quality agreements.
Late-stage operations still constrain throughput and delivery timing across nodes. With high utilization and extended lead times in complex injectables, capacity planning, slotting, and inventory strategies are being managed across manufacturing and packaging touchpoints, rather than optimized separately. Regulatory and sustainability requirements also feed into execution: Regulation (EU) 2025/40 (effective February 11, 2025) adds packaging lifecycle management and extended producer responsibility obligations that can affect material choices and supplier qualification, while regulated-market labeling requirements (batch and expiry, among other elements) keep packaging artwork governance and data accuracy as key operational inputs for CMO-managed supply chains.
Competitive Landscape
The market remains moderately fragmented as no single provider controls more than 10% share. Lonza, Catalent, and Samsung Biologics leverage scale and integrated offerings to stay ahead, while mid-tier specialists focus on HPAPI, sterile injectables, or viral vectors. Recent vertical integration moves such as Novo Holdings acquiring Catalent aim to create end-to-end platforms spanning discovery, development, and manufacturing.
Technology adoption is a decisive differentiator. Continuous manufacturing, digital twins, and AI-driven predictive quality management are moving from pilot to routine deployment. Providers with validated electronic batch records and advanced analytics improve real-time release testing, trimming cycle times and winning premium contracts.
Regulatory rigor is heightening. Adherence to ICH Q12 lifecycle guidance and FDA data-integrity expectations is now base-level entry criteria.[3]“International Council for Harmonisation Guidelines Update 2024,” ICH, ich.org Smaller providers facing rising compliance expenses are increasingly exploring mergers or divestitures, feeding a consolidation trend in the pharmaceutical contract manufacturing organization market.
Pharmaceutical Contract Manufacturing Organization (CMO) Industry Leaders
Lonza Group Ltd.
Catalent Inc.
Thermo Fisher Scientific Inc.
Samsung Biologics Co. Ltd
WuXi Biologics (Cayman) Inc.
- *Disclaimer: Major Players sorted in no particular order
Pharmaceutical Contract Manufacturing Organization (CMO) Market Companies Covered in this Report
- Lonza Group Ltd.
- Catalent Inc.
- Thermo Fisher Scientific Inc.
- Samsung Biologics Co. Ltd.
- WuXi Biologics (Cayman) Inc.
- Recipharm AB
- Jubilant Pharmova Ltd.
- Boehringer Ingelheim GmbH
- Pfizer CentreOne (Pfizer Inc.)
- Baxter International Inc. (Baxter BioPharma Solutions)
- Aenova Holding GmbH
- PCI Pharma Services
- Cambrex Corporation
- Siegfried Holding AG
- Evonik Industries AG
- Alcami Corporation
- Ajinomoto Bio-Pharma Services
- Eurofins CDMO Alphora Inc.
- Famar SA
- Tapemark LLC

Market Opportunities and Future Outlook
Sterile fill-finish and combination product capacity build-outs are pointing to a near-term whitespace for CMOs that can deliver integrated drug product manufacturing plus packaging and device assembly under a unified quality system. In April 2026, PCI Pharma Services announced a global investment program exceeding USD 1 billion to expand sterile fill-finish and drug-device delivery combination capabilities across the United States and Europe. In May 2026, PCI Pharma Services also announced a USD 100 million investment at its San Diego campus to add a high-speed isolator filling line for ready-to-use prefilled syringes and cartridges. These announcements reinforce sponsor preference for fewer handoffs across fill-finish, inspection, labeling, and final pack, particularly for injectable biologics where capacity bottlenecks and long lead times have constrained program onboarding.
Packaging and product-identification updates also create service-led opportunities for CMOs and contract packagers that run multi-sponsor lines and manage master data at scale. The FDA final rule published in March 2026 mandating a 12-digit NDC format (effective March 7, 2033) increases the need for modernization in labeling workflows, barcode generation, and serialization-ready packaging systems, while EMA packaging mock-up controls and IDMP-related manufacturer data submissions push CMOs toward stronger structured-data governance. On the oral and topical side, Aenova Group reported in February 2026 the addition of a fully automated, high-speed tube packaging line at Feldkirchen, Germany, with over 50 million units annual capacity, which indicates ongoing sponsor demand for automation and throughput improvements in regulated packaging formats amid high SKU complexity and frequent artwork change cycles.
Recent Industry Developments in Pharmaceutical Contract Manufacturing Organization (CMO) Market
- July 2026: Morepen Laboratories commenced commercial supplies under an INR 825 crore CDMO mandate, with its first INR 50 crore dispatch completed in Q1 FY2026-27. The start of commercial shipments signals conversion of contracted demand into executed volume and adds competitive pressure in cost-sensitive small-molecule outsourcing programs.
- April 2026: PCI Pharma Services announced a global investment program exceeding USD 1 billion to expand sterile fill-finish and drug-device capabilities across the United States and Europe, including new Centers of Excellence. The scale and scope of the program supports integrated offerings that combine drug product manufacturing, packaging, and combination product assembly under consolidated quality and project management.
- March 2024: Lonza announced a strategic investment program to expand its manufacturing network and capability set, with emphasis on higher-complexity modalities. The initiative aligns with sponsor demand for partners that can support process development through commercial supply while meeting tighter inspection and data-integrity expectations.


Pharmaceutical Contract Manufacturing Organization (CMO) Market Report Scope and Research Methodology
Market Definition and Coverage
In this methodology, the pharmaceutical CMO market covers the value of outsourced manufacturing work delivered by third-party organizations. Revenue is attributed to contract activities such as making APIs and finished dosage forms, plus related packaging services.
Scope exclusions: We exclude in-house captive manufacturing done fully inside pharma companies, and we also exclude contract research-only work that does not result in manufacturing revenue.
Segments Covered in This Report
- By Service Type
- API Manufacturing
- Small Molecule
- Large Molecule
- High-Potency API (HPAPI)
- FDF Development and Manufacturing
- Solid Dose
- Liquid Dose
- Injectable Dose
- Secondary Packaging
- API Manufacturing
- By Drug Molecule Type
- Small Molecule
- Biologics
- Advanced Therapies (Cell and Gene)
- By Scale of Operation
- Clinical-Phase Manufacturing
- Commercial-Scale Manufacturing
- By End User
- Big Pharma
- Generic Pharma
- Emerging / Virtual Biotech
- Specialty Pharma
- By Therapeutic Area
- Oncology
- Cardiovascular
- Central Nervous System (CNS)
- Infectious Disease
- Other Therapeutic Areas
- By Geography
- North America
- United States
- Canada
- Mexico
- South America
- Brazil
- Argentina
- Rest of South America
- Europe
- United Kingdom
- Germany
- France
- Spain
- Italy
- Rest of Europe
- Asia-Pacific
- China
- India
- Japan
- Australia
- South Korea
- Rest of Asia-Pacific
- Middle East and Africa
- Middle East
- Saudi Arabia
- United Arab Emirates
- Turkey
- Rest of Middle East
- Africa
- South Africa
- Kenya
- Rest of Africa
- Middle East
- North America
Data Sources, Market Sizing, and Validation
Desk Research
Desk research is used to build the foundation for the model, particularly around manufacturing output signals, regulatory activity, and where new capacity is being added. Public sources include FDA databases (for example, drug approvals and inspection actions), the European Medicines Agency public assessment reports, WHO guidance and prequalification publications, and trade statistics published by UN Comtrade and national customs portals.
We also review company annual reports, investor presentations, and press releases to capture announced capacity expansions, technology additions (such as high-potency handling or sterile lines), and changes in service mix. Patent databases and peer-reviewed articles help indicate where molecule complexity is moving, which then affects manufacturing intensity and pricing. The sources named above are illustrative, and we also used other public references plus a small set of subscription tools for company financials, patent lookups, and shipment-level trade checks to support data collection, validation, and research clarification.
Primary Interviews and Surveys
Primary work focused on validating what portion of demand is truly outsourced, how pricing moves for key service lines, and what utilization looks like across different plant types. We spoke with contract manufacturers, pharma and biotech outsourcing teams, and technical leaders across APAC, EMEA, and the Americas. This helped close gaps from desk research and re-check assumptions before the totals were finalized.
Distribution of primary research fieldwork respondents
| Company type | Respondent position | Region |
|---|---|---|
| Top tier: 32% | CXOs: 14% | APAC: 45% |
| Mid tier: 54% | Functional/Unit leaders: 32% | EMEA: 32% |
| Smaller Players: 14% | Managers: 54% | Americas: 23% |
Market-Sizing & Forecasting
Sizing starts from a top-down build where outsourcing demand is reconstructed from pharma production needs, the share contracted out, and the service mix across API, finished dosage, and secondary packaging. After that, we corroborate the totals with selective bottom-up checks, including sampled revenue roll-ups for key service clusters and simple volume times ASP checks for common dosage forms. Adjustments are made when gaps are explained by scope or mix.
Model inputs include API and finished-dosage outsourcing penetration by region, capacity additions and utilization trends for sterile and oral solid lines, the mix shift toward biologics and high-potency molecules, average contract sizes by stage (clinical versus commercial), and pricing direction for complex manufacturing steps like fill-finish. For forecasting, we run scenario analysis around utilization and outsourcing intensity, and we apply a light multivariate regression where historical relationships are stable (for example, approvals and manufacturing demand indicators moving together). When bottom-up visibility is limited in smaller geographies, we fill gaps using regional ratios and then re-check them using interview feedback before finalizing.
Data Validation & Update Cycle
Outputs are validated through multiple checks to keep the final number aligned with what is happening in the real market. We compare modeled revenue pools against independent signals such as capacity announcements, utilization commentary, and shifts in outsourcing mix reported in public materials. When anomalies appear, we investigate until a clear reason is found.
Before sign-off, the full model undergoes an internal review where assumptions, currency conversions, and calculation steps are re-performed to catch avoidable variance. The report is refreshed annually, and interim updates are made when material events can shift demand or pricing, followed by a final pre-delivery review to ensure clients receive the latest view.
Mordor Intelligence's Pharmaceutical Contract Manufacturing Organization Cmo Market Size Compared Against Other Published Estimates
It is normal to see different market sizes published for pharmaceutical CMOs, even when the topic name looks the same. Differences usually come from what services are counted, the year and currency timing used, and how pricing and utilization are assumed to move over the forecast window.
In practice, the biggest gaps often show up around whether development-linked manufacturing is included, how secondary packaging is treated, and whether the model assumes aggressive ramp-ups for complex capabilities like sterile fill-finish or high-potency APIs. Refresh cadence also matters because exchange rates, input costs, and realized pricing can drift within a year, which then changes the implied ASP path used in a value-based model.
Benchmark comparison
| Source | Market Size | Gaps in Research Methodology |
|---|---|---|
| Mordor Intelligence | USD 196.33 B (2026) | |
| Global Consultancy A | USD 168.24 B (2025) | The estimate is anchored to a different base year, and it can also be pushed lower if packaging and certain formulation-led manufacturing services are treated as optional add-ons rather than core CMO revenue. |
| Industry Publisher B | USD 140.23 B (2025) | A slower growth path is implied by the stated CAGR, and limited disclosure on pricing progression and utilization checks can lead to a smaller addressable pool when complex manufacturing steps are not fully valued. |
The spread is largely explained by timing and what is counted as CMO revenue, followed by how ASPs are stepped up as utilization tightens in sterile and high-potency capacity. When currency conversions are refreshed closer to the base year and those ASP steps are re-validated through follow-up checks with operators and buyers, the 2026 total stays more consistent. This is the refresh-led difference applied by Mordor Intelligence.


Key Questions Answered in the Report
How large is the pharmaceutical contract manufacturing organization market in 2026?
The market stands at USD 196.33 billion in 2026 and is projected to reach USD 268.37 billion by 2031.
Which service category generates the highest revenue?
API manufacturing leads, holding 41.98% of 2025 revenue within the pharmaceutical contract manufacturing organization market.
Which region is expanding fastest?
Asia-Pacific posts the highest CAGR at 8.91% through 2031 thanks to cost advantages and substantial capacity investments.
What bottleneck most constrains near-term growth?
Fill-finish capacity shortages, with utilization above 85% and 18-month lead times, currently limit quick onboarding of new injectable programs.
Why are virtual biotechs important to CDMOs?
Virtual biotechs rely entirely on outsourced partners for manufacturing, driving demand for flexible, integrated services and accelerating contract volumes.
Page last updated on:





