
United States Contract Manufacturing Services Market Size and Share
Market Overview
| Study Period | 2021 - 2031 |
|---|---|
| Forecast Data Period | 2026 - 2031 |
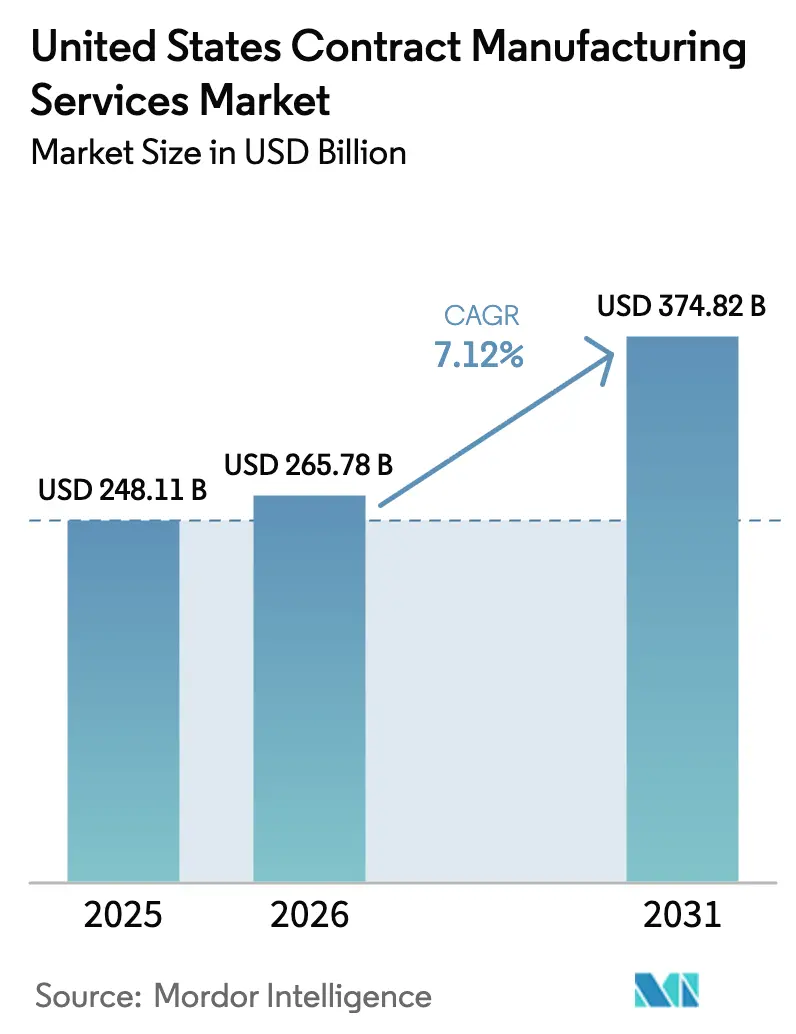
| Base Year Market Size (2025) | USD 248.11 Billion |
| Market Size (2026) | USD 265.78 Billion |
| Market Size (2031) | USD 374.82 Billion |
| Growth Rate (2026 - 2031) | 7.12 % |
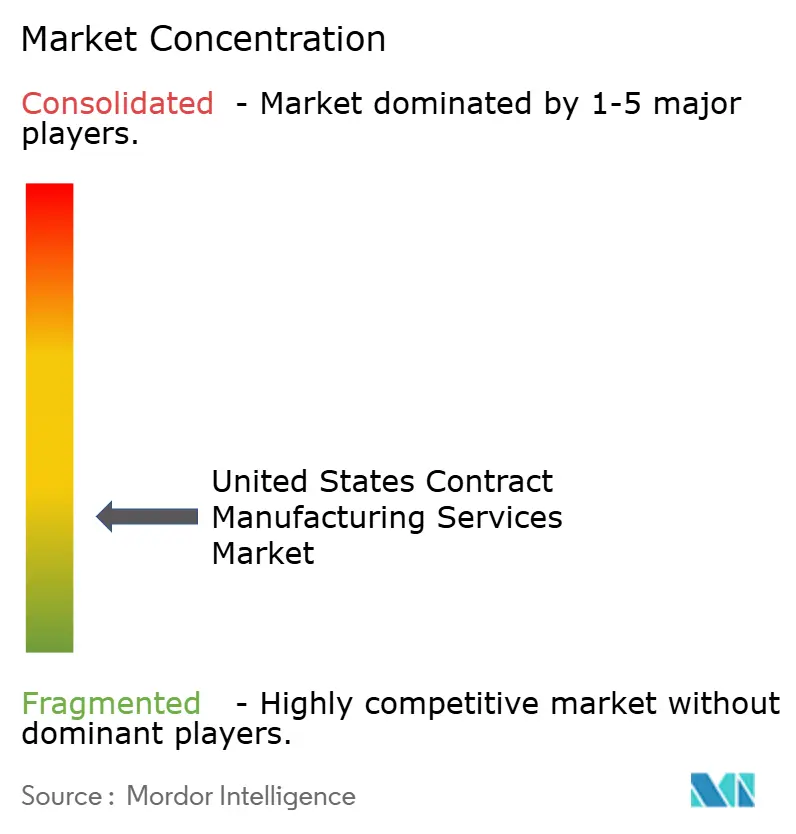
| Market Concentration | Low |
Major Players *Disclaimer: Major Players sorted in no particular order Image © Mordor Intelligence. Reuse requires attribution under CC BY 4.0. | |
United States Contract Manufacturing Services Market Analysis by Mordor Intelligence
The United States contract manufacturing services market size in 2026 is estimated at USD 265.78 billion, growing from 2025 value of USD 248.11 billion with 2031 projections showing USD 374.82 billion, growing at 7.12% CAGR over 2026-2031. Reshoring incentives under the Inflation Reduction Act are steering budget allocations toward domestic plants, redirecting work that once migrated offshore and widening the addressable base for the United States contract manufacturing services market.[1] Stricter FDA quality-by-design rules reward providers equipped with in-line analytics and real-time release testing, enabling premium price realization and faster tech-transfer cycles.[2] Specialized demand for biologics and high-potency APIs further accelerates outsourcing because negative-pressure suites and advanced containment impose capital barriers too steep for many brand owners. Parallel growth in functional ready-to-drink beverages and plant-based convenience foods favours agile co-packers that can manage small-batch runs and sensitive ingredients without disrupting legacy high-volume lines. Although skilled-labour shortages and raw-material swings compress margins, strong policy tailwinds and regulatory complexity keep the United States contract manufacturing services market on a durable upward trajectory.[3]
Key Report Takeaways
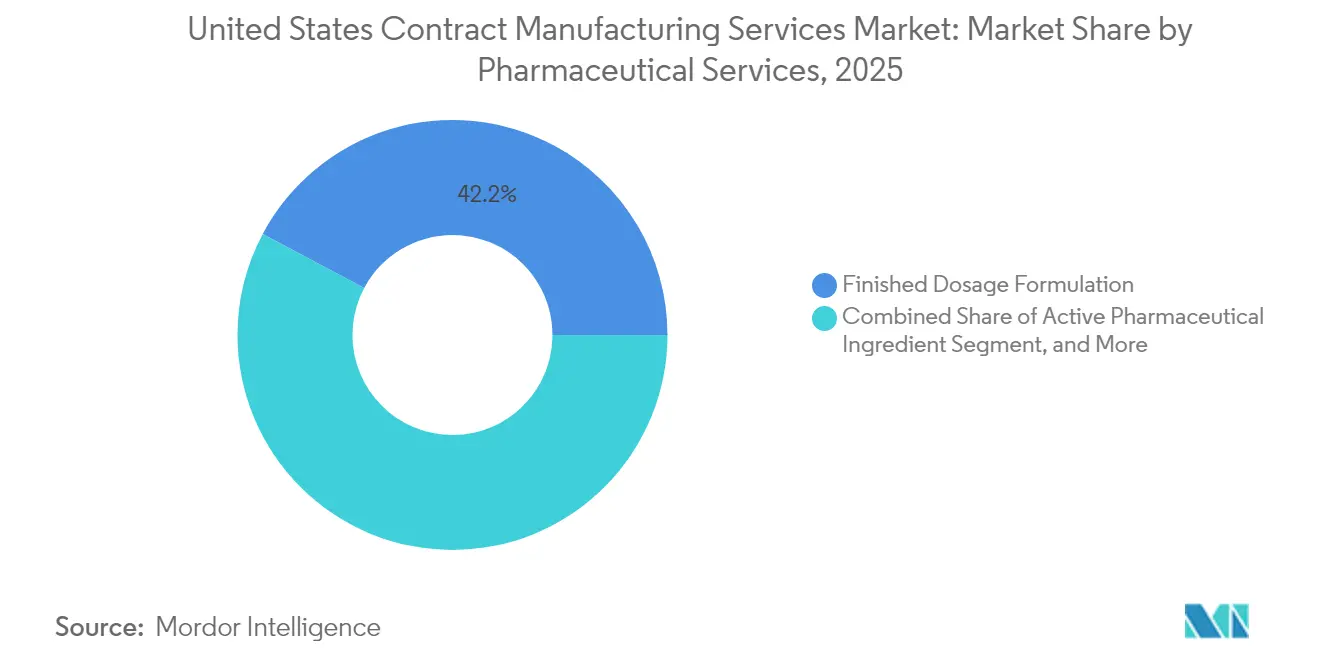
- By pharmaceutical services, Finished Dosage Formulation captured 42.21% of 2025 revenue, while High-Potency API manufacturing is forecast to compound at 9.62% CAGR through 2031.
- By food processing and manufacturing, Convenience Foods commanded 37.05% of 2025 turnover; Plant-based Convenience Foods are positioned for a 9.41% CAGR to 2031.
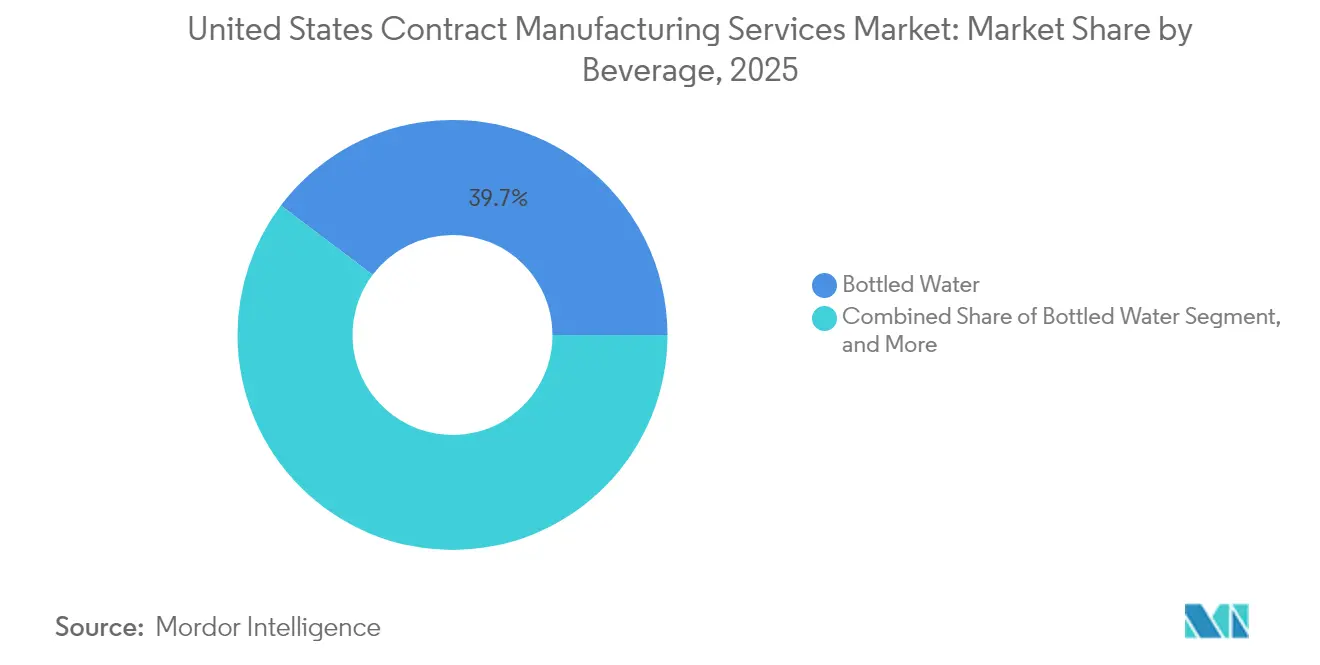
- By beverage category, Bottled Water held 39.72% share in 2025, whereas Functional RTD Beverages are projected to expand at a 10.08% CAGR over the same horizon.
- By personal care, Skin Care represented 28.35% of 2025 sales, and Clean Beauty applications are set to rise at a 9.18% CAGR through 2031.
Note: Market size and forecast figures in this report are generated using Mordor Intelligence’s proprietary estimation framework, updated with the latest available data and insights as of 2026.
United States Contract Manufacturing Services Market Trends and Insights
Drivers Impact Analysis*
| Driver | (~) % Impact on CAGR Forecast | Geographic Relevance | Impact Timeline |
|---|---|---|---|
| Surge in reshoring initiatives post-Inflation Reduction Act | +1.20% | National, with concentration in Midwest and South | Medium term (2-4 years) |
| Tightening U.S. FDA quality-by-design guidelines driving professional outsourcing | +1.80% | National, with emphasis on Northeast and West Coast | Short term (≤ 2 years) |
| Acceleration of biologics and HPAPI pipelines requiring specialized capacity | +2.10% | Northeast, West Coast, with expansion to South | Long term (≥ 4 years) |
| Beverage brands' pivot to functional/RTD formats needing agile co-packers | +0.90% | National, with regional specialization clusters | Medium term (2-4 years) |
| Corporate sustainability targets boosting demand for recyclable contract packaging | +0.70% | National, with early adoption in West Coast | Medium term (2-4 years) |
| DARPA and BARDA funding for rapid domestic surge-capacity platforms | +0.60% | National, with defense contractor concentration | Short term (≤ 2 years) |
| Source: Mordor Intelligence | |||
Surge in Reshoring Initiatives Post-Inflation Reduction Act
Federal tax credits tied to domestic content are shifting capital budgets toward U.S. factories, allowing the United States contract manufacturing services market to recapture production once located overseas. Contractors that can document Buy American compliance now secure multiyear agreements, particularly in pharmaceuticals and renewable-energy components. The advanced manufacturing production credit elevates margins for qualifying operations, encouraging accelerated groundbreakings in the Midwest and South where land and utilities cost less. Major pharmaceutical announcements such as Eli Lilly’s multi-site buildout topping USD 50 billion since 2020 illustrate the policy’s reach. Similar momentum appears in materials processing; Covestro’s EUR 35 million (USD 38 million) investment in Ohio polycarbonate output underscores cross-sector capital flow. These projects enlarge the skilled labour pool yet lead times for facility commissioning keep near-term capacity tight, preserving pricing leverage for incumbent contractors. In response, some producers lock in long-term offtake to hedge against future slot scarcity, cementing demand visibility for the United States contract manufacturing services market.
Tightening FDA Quality-by-Design Guidelines Driving Professional Outsourcing
Updated FDA guidance requires continuous monitoring, process analytical technology, and data-rich validation, raising the floor for compliant production. Many mid-tier drug developers deem internal upgrades uneconomic, opting instead for contractors already running real-time release platforms. These providers shorten commercialization timelines by up to 18 months, delivering a speed premium that translates into earlier revenue recognition for brand owners. M&A activity remains brisk as leading CDMOs buy assets with mature QbD infrastructure; PCI Pharma Services’ purchase of Ajinomoto Althea’s aseptic fill-finish network is emblematic.[4] The consequence is heightened consolidation inside the United States contract manufacturing services market, with scale players harvesting operational synergies while widening the compliance gap versus smaller rivals. Over the forecast window, incremental guidance on software assurance and continuous manufacturing is expected to keep capital intensity high, locking in the outsourcing thesis.
Acceleration of Biologics and HPAPI Pipelines Requiring Specialized Capacity
Growth in antibody-drug conjugates and highly potent oncology assets drives demand for negative-pressure suites, rigid isolators, and advanced operator-safety protocols unavailable in typical legacy plants. Few facilities meet both occupational exposure band limits and FDA sterility expectations, giving the scarce pool of qualified providers pricing power. Syngene’s acquisition of Emergent BioSolutions’ U.S. biologics site and Kindeva’s combination with Meridian illustrate how supply-side players scramble to secure GMP-ready real estate. Meanwhile, the BIOSECURE Act’s constraints on Chinese-owned facilities amplify the premium on domestic capacity. This environment emboldens long-term take-or-pay contracts wherein sponsors underwrite new suites to guarantee future access, further solidifying volume certainty for the United States contract manufacturing services market.
Beverage Brands’ Pivot to Functional/RTD Formats Needing Agile Co-Packers
Consumers gravitate to drinks fortified with probiotics, adaptogens, and vitamins, pushing beverage innovators into pilot-scale launches that rarely fit high-volume internal lines. Contract packers with batch-size agility and specialized filling gear become essential for prototype validation and rapid market rollout. Ingredient sensitivity necessitates cold-fill or aseptic processes that add technical complexity and justify premium co-packing rates. PepsiCo’s acquisition of prebiotic soda brand poppi highlights how incumbents buy portfolios rather than re-tool legacy assets, sustaining demand for flexible manufacturing slots. Regional co-packers respond by installing dedicated lanes for functional RTD beverages, bolstered by analytical labs that verify nutrient stability. These capabilities differentiate suppliers, attracting multi-year agreements that enlarge the revenue base of the United States contract manufacturing services market.
Restraints Impact Analysis*
| Restraint | (~) % Impact on CAGR Forecast | Geographic Relevance | Impact Timeline |
|---|---|---|---|
| Persistent skilled-labor shortages inflating turnkey service pricing | -1.40% | National, with acute impacts in Midwest manufacturing hubs | Medium term (2-4 years) |
| Volatility in raw-material input costs compressing contractor margins | -1.10% | National, with commodity-intensive sectors most affected | Short term (≤ 2 years) |
| Legacy facility footprints limiting flexibility for short-run SKUs | -0.80% | National, with older industrial regions most constrained | Long term (≥ 4 years) |
| Heightened CFIUS scrutiny on foreign ownership of U.S. plants | -0.50% | National, with strategic sector concentration | Medium term (2-4 years) |
| Source: Mordor Intelligence | |||
Persistent Skilled-Labor Shortages Inflating Turnkey Service Pricing
Roughly 2.1 million manufacturing roles remain unfilled nationwide, and competition from technology and healthcare verticals elevates wage expectations for experienced technicians. High-potency suites, aseptic fill-finish lines, and continuous food-processing equipment require specialized certifications that shrink the eligible talent pool. Contract manufacturers raise hourly rates to retain staff, then pass higher costs into service quotes, nudging average turnkey project pricing upward across the United States contract manufacturing services market. Apprenticeship programs mitigate attrition yet require 12-18 months before yielding productivity, leaving an interim gap that automation only partially offsets. Geographic wage differentials further skew project-award patterns toward the South and Midwest, where lower cost-of-living indexes moderate labour premiums. Nevertheless, scarcity persists in niche skills such as sterile compounding, delaying schedule adherence for some GMP renovations.
Volatility in Raw-Material Input Costs Compressing Contractor Margins
Prices for pharmaceutical excipients, specialty chemicals, and packaging substrates swung more than 15% during 2024, and fixed-price contracts restrict immediate pass-through. Smaller contractors lacking hedge programs absorb margin hits, potentially limiting reinvestment in compliance upgrades. Inventory buffers become costlier as holding periods lengthen, especially for temperature-controlled inputs requiring energy-intensive storage. Energy itself represents 8–12% of manufacturing overhead and registers wide regional spreads, complicating bid parity across plants. In response, many providers adopt cost-plus models or shorten contract terms, transferring volatility risk to brand owners yet potentially sacrificing deal visibility. While some clients accept dynamic pricing, others seek multi-sourced frameworks, fragmenting volumes within the United States contract manufacturing services market and introducing scheduling inefficiencies that temper overall growth.
*Our forecasts treat driver/restraint impacts as directional, not additive. The impact forecasts reflect baseline growth, mix effects, and variable interactions.
Segment Analysis
By Pharmaceutical Services: Specialized Suites Lift High-Potency Growth
Finished Dosage Formulation accounted for 42.21% of 2025 revenue, underscoring its role as the throughput anchor for the United States contract manufacturing services market share in life-science applications. High-Potency API manufacturing is forecast to deliver a 9.62% CAGR through 2031, the steepest curve in the pharmaceutical bucket, fuelled by oncology pipelines and complex conjugates demanding containment grades OEB 4-5. The United States contract manufacturing services market size for HPAPI work is projected to accelerate as brand owners underwrite new isolator trains to secure scarce capacity. Secondary Packaging keeps momentum amid federal serialization mandates that extend traceability to the unit level, making data-rich labelling a value driver. Throughout the period, automation and single-use technologies compress changeover times, enabling smaller batch sizes that align with precision-medicine strategies.
Complementing high-containment assets, small-molecule API production remains relevant for generic and specialty drugs that still require cost arbitration and cGMP compliance. Injectable Dose Formulation shows above-average expansion because parenteral delivery offers better bioavailability for biologics and long-acting injectables. Contract manufacturers widen pre-filled-syringe and cartridge lines, blending robotics with vision-inspection systems to assure sterile integrity. Investment examples include Evonik’s automated vial-filling program and PCI Pharma’s Rockford expansion, both reinforcing the capability gap between top-tier CDMOs and regional players. This divergence is expected to entrench tiered pricing within the United States contract manufacturing services market.

By Food Processing and Manufacturing: Plant-Based Innovation Reshapes Demand
Convenience Foods occupied 37.05% of 2025 turnover, cementing its position as the largest in the food domain of the United States contract manufacturing services market. Plant-based Convenience Foods, already benefiting from a 9.41% CAGR outlook, ride consumer shifts toward alternative proteins and clean-label nutrition. Shear-cell texturization and high-moisture extrusion necessitate specialized equipment, incentivizing brands to outsource rather than invest in asset-specific lines. The United States contract manufacturing services market size for alternative protein runs is expected to widen as startup incubators contract for pilot-scale volumes ahead of nationwide distribution.
Bakery Products continue to rely on contract manufacturers for gluten-free and artisan varieties where segregation from wheat-based inputs is mandatory. Similarly, Dairy Products outsourcing grows on the back of lactose-free and plant-based variants that require separate pasteurization flows. R&D services have become embedded in supply contracts, with co-manufacturers offering bench-to-shelf formulation under one roof, thereby shortening innovation cycles. Packaging lines shift toward PCR plastics and compostable films, aligned with retailer sustainability scorecards. This evolution reinforces the strategic relevance of food-grade contractors within the broader United States contract manufacturing services market.
By Beverage: Functional Formats Drive Co-Packing Innovation
Bottled Water retained a 39.72% hold on 2025 beverage revenue, leveraging logistics simplicity and uniform demand curves. Functional RTD Beverages, projected at a 10.08% CAGR, draw on immunity, energy, and gut-health claims that create formulation complexity unsuited to legacy soda lines. Cold-fill aseptic tunnels, nitrogen dosing, and high-shear blending push capex thresholds upward, promoting outsourcing. Within the United States contract manufacturing services market, small-batch canning lines see near-full utilization as health-oriented startups race to retail.
Carbonated Drinks and Fruit-based Beverages maintain steady flow due to flavour rotation requirements and region-specific taste profiles. Sport Drinks contracting benefits from electrolyte-balance R&D, driving adoption of on-line conductivity meters for tight spec adherence. Beer co-manufacturing supports craft and seasonal releases, smoothing capacity for big brewers during shoulder periods. As multi-pack configurations diversify, contractors install combination packers and digital printers to accommodate SKUs without long changeovers. This flexibility remains a signature differentiator for beverage-focused providers inside the United States contract manufacturing services market.
By Personal Care: Clean-Beauty Momentum Accelerates Specialized Manufacturing
Skin Care commanded 28.35% of 2025 revenue, reflecting active-ingredient sophistication and sterility standards that align well with GMP-trained labour pools. Clean-Beauty formulations, tracking a 9.18% CAGR, mandate preservative-free processes and traceable botanicals, both of which add analytical overhead that favours specialist contractors. The United States contract manufacturing services market size dedicated to natural and organic cosmetics broadens as retailers set “free-from” lists demanding verified sourcing.
Hair Care outsourcing grows via ammonia-free colorants and scalp-health serums that require micro-emulsion know-how. Make-Up and Colour Cosmetics partners capitalize on limited-edition drops by leveraging short-run filling lines and modular cleanrooms. Packaging shifts toward refillable and recyclable formats, placing an additional premium on suppliers who can integrate sustainable componentry. Firms such as Cosmetic Essence Innovations deploy in-house fragrance labs and compatibility testing, allowing turnkey development from ideation to lot release. Overall, compliance with FDA cosmetic regulations and EU Annex II ingredient bans boosts the technical bar, reinforcing the need for specialist capacity across the United States contract manufacturing services market.
Geography Analysis
The South leads the United States contract manufacturing services market, leveraging lower land costs, advantageous tax policies, and port access that minimize inbound raw-material expenses. North Carolina’s Research Triangle exemplifies the cluster effect, hosting Eli Lilly’s planned API campus and Merck’s USD 1 billion vaccine plant, each anchoring local supply chains. Texas and Georgia add momentum through right-to-work statutes and workforce training grants that make site selection financially attractive. As biologics and food processing plants co-locate near agricultural basins and research universities, the region’s share of United States contract manufacturing services market size continues to expand.
The Northeast remains the epicentre for high-complexity pharmaceutical and biotechnology work, concentrating cGMP biologics suites within proximity of major sponsors. Massachusetts’ Route 128 corridor and New Jersey’s Pharma Belt provide access to venture funding and a seasoned regulatory workforce. Despite elevated operational costs, premium billing rates offset overhead, sustaining investment in single-use bioreactors and high-potency suites. PCI Pharma’s aseptic expansion and Kindeva’s integrated drug-device campus highlight ongoing capacity growth. The region’s mature ecosystem ensures that the United States contract manufacturing services market share for specialized life-science offerings remains substantial.
The Midwest occupies a balanced portfolio role, serving food, beverage, and automotive supply chains. Illinois, Ohio, and Wisconsin benefit from freight-rail hubs and abundant agricultural inputs, underpinning expansions such as Covestro’s polycarbonate compounding in Ohio. Skilled labour from legacy manufacturing towns supports process-intensive lines, while land availability accommodates large-footprint plants. The West, led by California and Washington, tilts toward electronics, aerospace, and premium beverage co-packing, leveraging innovation centers and venture capital. Although utility rates and regulatory hurdles elevate cost profiles, proximity to tech clients justifies premium pricing. Together, these regions contribute to a diversified geographic mosaic that underpins resilience in the United States contract manufacturing services market.
Regulatory Landscape
In the United States, pharmaceutical-oriented contract manufacturing and packaging work is anchored in FDA Current Good Manufacturing Practice requirements, including 21 CFR Part 211 for drug manufacturing controls and related FDA expectations around oversight of outsourced activities. FDA guidance on contract manufacturing arrangements for drugs also emphasizes the use of written Quality Agreements between the product owner and the contract facility to allocate responsibilities across packaging, processing, testing, and release, which increases compliance expectations for CDMOs and contract packagers serving regulated products.
For government procurement, contractors face additional packaging and compliance requirements when supporting federal agencies. Defense Logistics Agency (DLA) packaging and marking requirements commonly reference commercial and military standards such as ASTM D3951 and MIL-STD-2073-1E (and related marking standards), while General Services Administration (GSA) supply programs define packaging and labeling expectations for goods sold to the government. Trade policy can further influence sourcing and cost structure, with USTR trade actions and authorities such as Section 232 and Section 301 affecting tariff exposure for certain inputs and components used across packaging and manufacturing supply chains.
Value Chain Analysis
The value chain starts with inputs, including active ingredients or base formulations, excipients, food ingredients, and packaging substrates such as bottles, closures, films, cartons, and labels. Equipment and technology providers then supply fillers, blenders, aseptic systems, inspection and vision tools, serialization, and end-of-line automation. Contract manufacturers and co-packers perform formulation and processing, along with primary packaging, while secondary packaging, labeling, and serialization are key downstream steps for regulated categories; quality functions, including QC labs, batch documentation, validation, and release, typically run in parallel, especially in pharma and higher-risk personal care applications.
Distribution and logistics partners complete the chain through warehousing, cold chain (where required), and shipment to brand owners, wholesalers, retailers, or direct-to-consumer channels. Plant execution remains the main source of bottlenecks, with processing frequently cited as the most reported constraint (23%), followed by primary packaging (22%) and secondary packaging (19%), reflecting throughput impacts from changeovers, line integration, and breakage. To address these limits, providers prioritize automation and digital tools to reduce changeover time and stabilize labor productivity, while brand owners diversify contract packaging and labeling vendors to mitigate single-site capacity constraints, including cases where pharma companies added secondary packaging and labeling CMOs after encountering vendor limitations.
Competitive Landscape
Moderate consolidation defines the United States contract manufacturing services market; with scale advantages most pronounced in regulated pharmaceutical segments. Top CDMOs pursue vertical integration, acquiring complementary assets that fill technology gaps and secure end-to-end contract scopes. PCI Pharma’s USD 365 million Rockford injectable packaging project demonstrates the capital required to win biologic volume and reinforces barriers to entry. Simultaneously, smaller niche specialists thrive by offering bespoke capabilities such as probiotic beverage fermentation or refillable cosmetic packaging, creating a dual-track competitive field.
Automation adoption accelerates as providers deploy cobotics, real-time analytics, and digital twins to decrease downtime and enhance regulatory audit readiness. These investments compress batch-release timelines, allowing contractors to offer accelerated launch programs that differentiate on speed. The United States contract manufacturing services market also witnesses strategic alliances between material suppliers and packagers to co-develop sustainable solutions, locking in downstream demand for recycled resins and bio-based polymers.
Private-equity interest remains robust, evident in Lewis & Clark Capital’s purchase of ChemRite CoPac and New Harbor Capital’s stake in FoodPharma, reflecting faith in outsourced manufacturing’s recurring-revenue profile. Cross-border moves, such as Syngene’s first U.S. biologics buy, signal inbound competition that could spur further M&A as domestic players protect share. Overall, capability expansion and specialization continue to shape the strategic playbook within the United States contract manufacturing services market.
United States Contract Manufacturing Services Industry Leaders
-
Catalent Pharma Solutions Inc.
-
Lonza Group AG
-
Amerilab Technologies Inc.
-
Brooklyn Bottling Group
-
KIK Consumer Products Inc.
- *Disclaimer: Major Players sorted in no particular order
Market Opportunities and Future Outlook
Reshoring incentives and tighter quality requirements are widening opportunity for domestic providers that can bundle regulated manufacturing with packaging, labeling, and compliant release pathways. In pharmaceuticals, FDA focus on robust cGMP execution and clearly defined sponsor-contractor responsibilities increases the value of CDMOs that can provide integrated sterile fill-finish, device assembly, and secondary packaging under a unified quality system, particularly for complex modalities (biologics, gene therapies, and HPAPI programs) where containment, aseptic processing, and data-rich validation raise barriers for smaller in-house plants.
In consumer categories, the main opportunity centers on faster regional fulfillment and SKU proliferation, which favors co-packers with flexible lines, short changeovers, and integrated warehousing. Recent capacity adds and modernization activity support this shift toward distributed, logistics-forward footprints, including new or expanded packaging operations in Utah and Texas and packaging-line upgrades in Tennessee and New York. The termination of the USDA Paper and Paper-Based Packaging Promotion, Research, and Information Order also increases the importance of private investment and customer-driven programs for paper-based packaging innovation, pushing contract packagers to differentiate through capability such as printing and labeling, traceability, and inspection rather than relying on industry-funded promotion.
Recent Industry Developments
- July 2026: Catalent expanded its partnership with Nanoscope Therapeutics to support late-phase and commercial supply activities for MCO-010, including packaging and distribution work aligned to a planned U.S. FDA submission. The move elevates packaging validation and compliant distribution as integral parts of advanced-therapy CDMO programs, tightening links between clinical supply, commercial readiness, and outsourced packaging capabilities.
- April 2026: PCI Pharma Services announced infrastructure investments exceeding USD 1 billion to expand U.S. sterile fill-finish and drug-device combination capabilities, including additional capacity at its Philadelphia, Pennsylvania and Rockford, Illinois campuses. The scale of investment reinforces the capital intensity of regulated outsourcing and increases available end-to-end capacity spanning fill-finish, device assembly, and packaging operations.
- April 2025: PCI Pharma Services closed the purchase of Ajinomoto Althea’s aseptic fill-finish network in San Diego, adding pre-filled syringe and ADC-related capabilities to its U.S. footprint. The acquisition strengthens the competitive position of larger CDMOs that combine sterile manufacturing with downstream packaging and distribution services under mature quality systems.
Research Methodology Framework and Report Scope
Market Definition and Coverage
This market covers revenues earned by third-party providers in the United States for making, formulating, packaging, or otherwise producing goods on behalf of brand owners, including regulated and non-regulated manufacturing where the production responsibility is outsourced.
Scope exclusions: We exclude in-house (captive) manufacturing done by brand owners for their own products, and we also exclude pure consulting-only work that does not translate into contract production revenue.
Segmentation Overview
- By Pharmaceutical Services
- Active Pharmaceutical Ingredient (API) Manufacturing
- Small Molecule
- Large Molecule
- High-Potency API
- Finished Dosage Formulation Development and Manufacturing
- Solid Dose Formulation
- Liquid Dose Formulation
- Injectable Dose Formulation
- Secondary Packaging
- Active Pharmaceutical Ingredient (API) Manufacturing
- By Food Processing and Manufacturing
- Food Manufacturing Services
- Convenience Foods
- Bakery Products
- Confectionery Products
- Dairy Products
- Research and Development
- Food Packaging Services
- Food Manufacturing Services
- By Beverage
- Beer
- Carbonated Drinks and Fruit-based Beverages
- Bottled Water
- Sport Drinks
- By Personal Care
- Skin Care
- Hair Care
- Make-Up and Color Cosmetics
- Others
Data Sources, Market Sizing, and Validation
Desk Research
Desk work helped us set the starting shape of the market and the realistic guardrails for the model. We relied on public, non-paywalled sources such as the US Census Bureau (Annual Survey of Manufactures and related series), the Bureau of Labor Statistics (wages and employment by manufacturing activity), the US International Trade Commission trade data, and FDA databases and guidance notes for regulated manufacturing and quality expectations.
To ground the industry picture, we also reviewed company annual reports and investor decks, trade association releases, and reputable business press for capacity additions, reshoring announcements, and customer outsourcing patterns. Where needed, paid subscriptions were used only for structured company financials, patent lookups, shipment-level import and export signals, and contract and tender tracking that is hard to compile manually. These desk research sources are illustrative, and many other public and paid references were also used for data collection, validation, and clarification.
Primary Interviews and Surveys
Fieldwork focused on confirming what is actually being outsourced and how pricing and utilization are moving by end-use vertical. We spoke with a mix of contract manufacturers, brand owners that outsource production, packaging partners, and industry advisors across the United States to test assumptions from desk research and to close data gaps that could not be answered from public data alone.
Distribution of primary research fieldwork respondents
| Company type | Respondent position |
|---|---|
| Top tier: 37% | CXOs: 13% |
| Mid tier: 46% | Functional/Unit leaders: 42% |
| Smaller Players: 17% | Managers: 45% |
Market-Sizing & Forecasting
Sizing was built using a top-down and bottom-up logic, where US manufacturing and outsourcing signals were first reconstructed into an addressable contract production revenue pool, and then cross-checked using selective supplier and channel approximations. On the top-down side, we used indicators like manufacturing output trends, outsourcing intensity by vertical, FDA-linked regulated production needs, and trade exposure where inputs or intermediates are imported and then processed domestically. These inputs were translated into value using practical pricing assumptions that were validated through interviews.
To keep totals realistic, bottom-up checks were then applied using sampled provider revenue splits, capacity and utilization commentary, and observed service-mix shifts like more demand for sterile work, small-batch changeovers, and secondary packaging. Where company disclosures were incomplete, gaps were handled through peer benchmarking by service type and by typical utilization ranges, and then reviewed with experts so outliers did not distort totals.
Forecasts were built using scenario analysis supported by a simple multivariate regression overlay, so demand drivers could move together in a consistent way rather than relying on a single trend line. Variables commonly stress-tested include changes in reshoring activity, labor and energy cost pressure, regulatory compliance intensity for pharma work, packaging demand in food and beverage, and mix shifts toward higher value add services that lift average realized pricing.
Data Validation & Update Cycle
Validation was done through multiple passes so the final outputs match real-world signals, not just spreadsheet math. We compared the modeled totals against independent checks such as manufacturing output direction, hiring and wage pressure in relevant production categories, and visible capacity expansion or consolidation news. When a variance looked too large, the assumption was traced back to its driver, and follow-up calls were triggered to confirm whether the issue was scope, pricing, or utilization.
Before sign-off, the model and key assumptions go through a second-analyst review, followed by a final consistency scan across segments and years so the growth path is coherent. Reports are refreshed annually, and interim updates are made when material events change outsourcing behavior or pricing. Right before delivery, we do a fresh pass so clients receive the latest updated view.
Mordor Intelligence's United States Contract Manufacturing Services Market Size Compared With Other Published Estimates
Published market values for US contract manufacturing services can look far apart because sources do not always count the same activities and they also choose different starting years and pricing logic. Differences in whether packaging-only work is included, how regulated pharma manufacturing is treated, and how multi-plant contract manufacturers split revenues across services tend to be the biggest drivers.
The main gap comes from whether co-packing and secondary packaging revenues are counted inside the market along with full contract production, and in our case Mordor Intelligence counts these services only when they are delivered as paid, outsourced manufacturing or packaging work for third parties within the United States. Other estimates also vary based on how they adjust for inflation in service pricing, whether they use conservative or aggressive outsourcing penetration, and how frequently the model is refreshed when capacity, utilization, and customer mix change.
Benchmark comparison
| Source | Market Size | Gaps in Research Methodology |
|---|---|---|
| Mordor Intelligence | USD 248.11 B (2025) | |
| Industry Publisher A | USD 225.00 B (2024) | Uses a broader outsourcing narrative but appears to apply a single blended value without clearly separating contract manufacturing revenue from adjacent services like design support and supply chain activities, which can pull the number down depending on what is excluded. |
| Advisory Note B | USD 218.22 B (2025) | Seems to run a conservative growth path with limited service-mix uplift, and may treat higher value regulated work and packaging add-ons as flat averages, which reduces the impact of mix changes on total market value. |
Overall, the spread in published numbers is largely explained by what gets counted as contract manufacturing revenue, how service pricing is progressed year to year, and how quickly the model reacts to mix shifts across pharma, food, beverage, and personal care. By keeping the scope tied to paid outsourced production and packaging work and then checking it against utilization and service-mix signals, the final value stays traceable to practical inputs that can be revisited and repeated.
Key Questions Answered in the Report
How large is the United States contract manufacturing services market in 2026?
The market stands at USD 265.78 billion in 2026 and is on course for USD 374.82 billion by 2031.
What CAGR is forecast for U.S. contract manufacturing services through 2031?
A 7.12% compound annual growth rate is projected during the 2026-2031 period.
Which pharmaceutical subsegment is growing the fastest?
High-Potency API manufacturing is forecast to post a 9.62% CAGR through 2031, the steepest within pharma services.
Which food category leads outsourcing demand?
Convenience Foods holds 37.05% of 2025 revenue, reflecting strong reliance on contract production lines.
Where is geographic growth most pronounced?
The South leads, buoyed by favorable tax regimes, lower land costs, and major pharmaceutical buildouts.
What strategic trend shapes competitive dynamics?
Providers invest heavily in automation and specialty acquisitions to secure high-value contracts and meet stricter FDA requirements.