Market Overview
| Study Period | 2020 - 2031 |
|---|---|
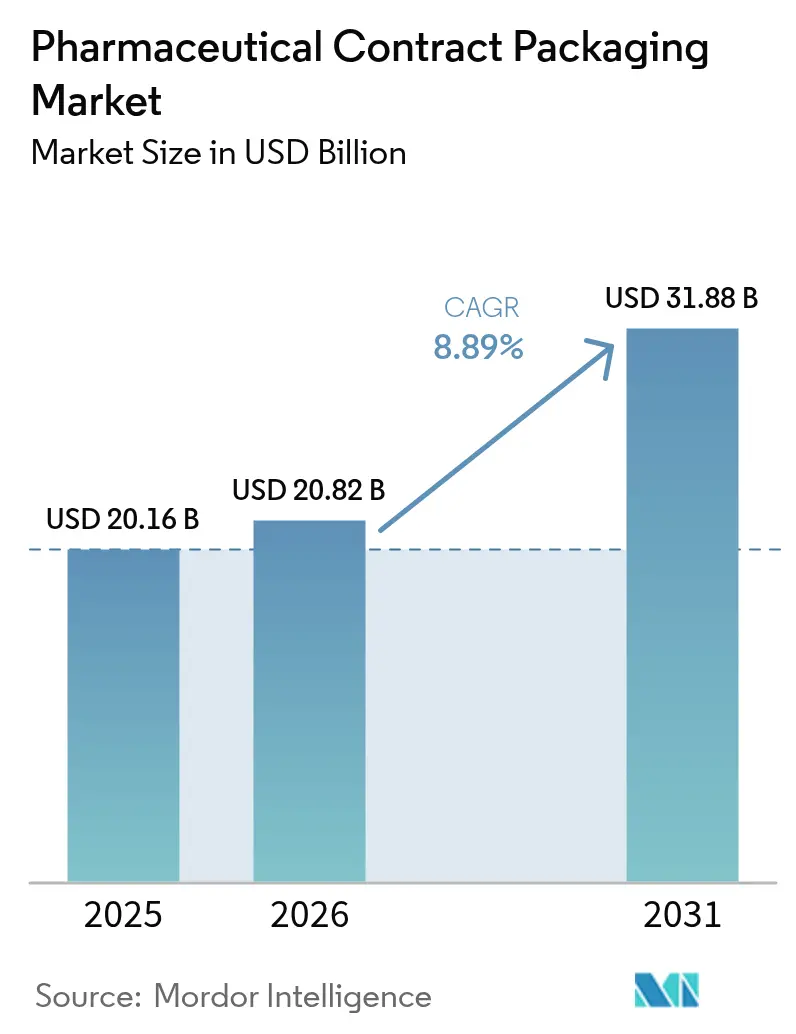
| Market Size (2026) | USD 20.82 Billion |
| Market Size (2031) | USD 31.88 Billion |
| Growth Rate (2026 - 2031) | 8.89% CAGR |
| Fastest Growing Market | Asia Pacific |
| Largest Market | North America |
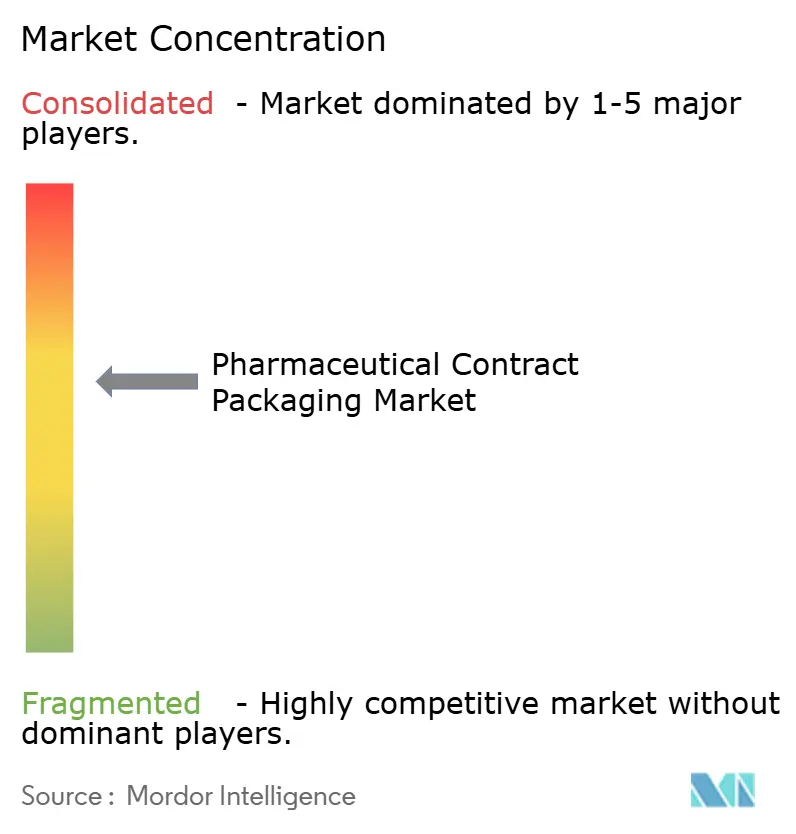
| Market Concentration | Medium |
Major Players*Disclaimer: Major Players sorted in no particular order Image © Mordor Intelligence. Reuse requires attribution under CC BY 4.0. | |
Pharmaceutical Contract Packaging Market Analysis by Mordor Intelligence
The pharmaceutical contract packaging market size is expected to increase from USD 20.16 billion in 2025 to USD 20.82 billion in 2026 and reach USD 31.88 billion by 2031, growing at a CAGR of 8.89% over 2026-2031. Solid demand stems from stringent serialization laws, the rapid shift toward biologics in self-administration devices, and the preference for one-stop CDMOs that fold packaging into integrated supply agreements. Sponsors also accelerate near-shoring in North America and Western Europe to reduce geopolitical risk and qualify for emerging industrial-policy tax credits. At the same time, contract packagers invest in AI-enabled line changeover and predictive maintenance to shorten validation windows and unlock higher asset utilization. Midsize generic-drug makers benefit the most, because outsourcing allows them to meet unit-level traceability rules without a USD 2 million per-line capital outlay.
Key Report Takeaways
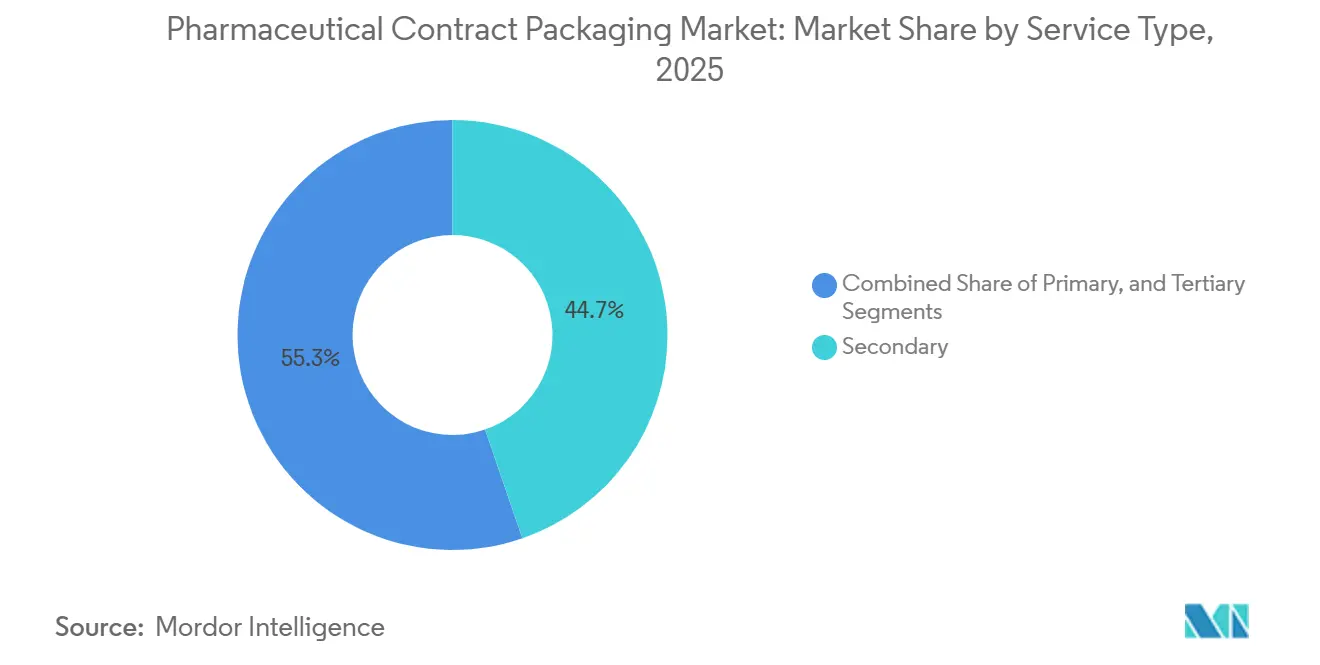
- By service type, secondary packaging led with 44.73% of the pharmaceutical contract packaging market share in 2025, whereas tertiary packaging is advancing at a 9.02% CAGR through 2031.
- By packaging format, bottles commanded 32.94% of the pharmaceutical contract packaging market size in 2025, while pre-filled syringes and cartridges are projected to expand at an 8.93% CAGR to 2031.
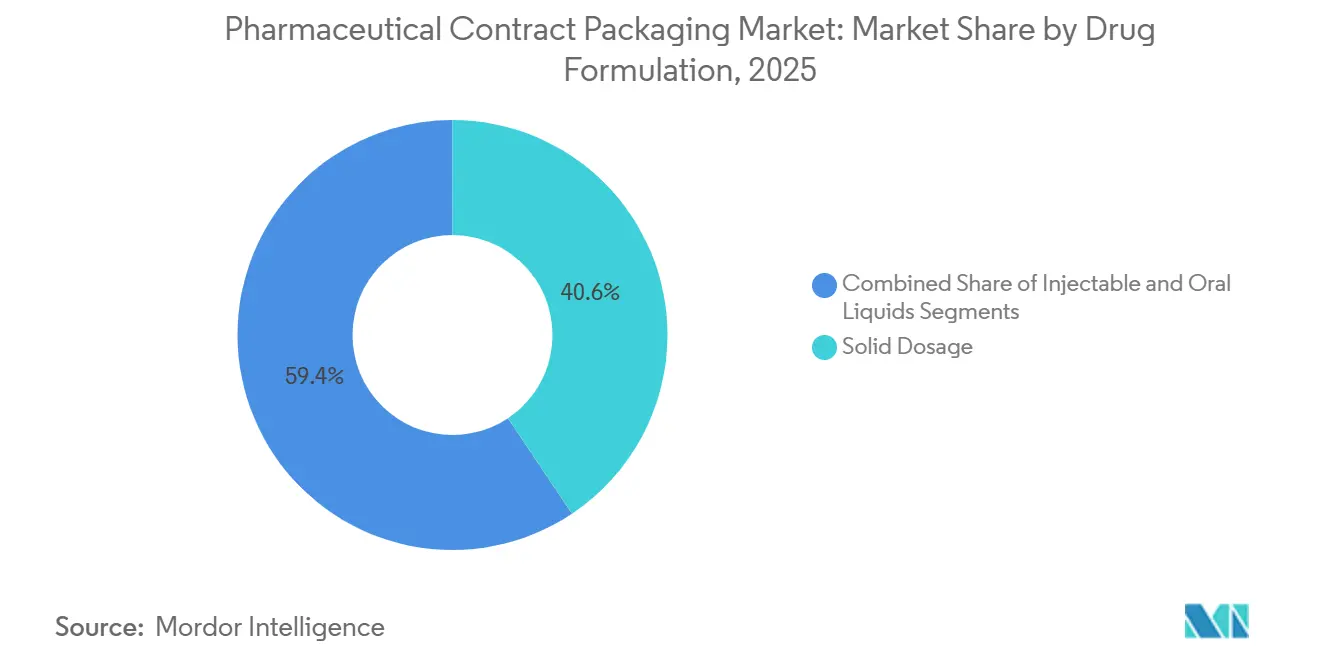
- By drug formulation, solid dosage forms captured 40.62% share of the pharmaceutical contract packaging market size in 2025 and injectables are growing at a 9.14% CAGR through 2031.
- By end-user, big pharma held 28.74% of demand in 2025, yet emerging biotech and start-ups post the fastest 8.97% CAGR to 2031.
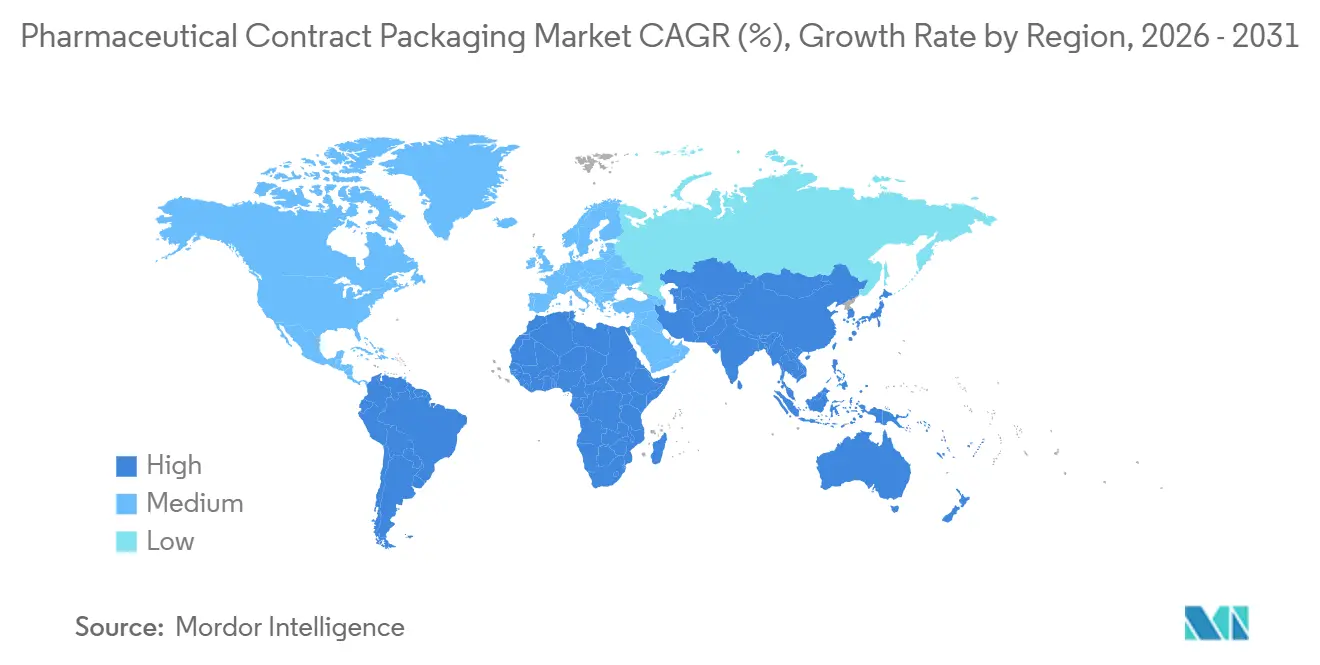
- By geography, North America accounted for 35.84% of 2025 revenue, whereas Asia Pacific is forecast to rise at a 9.33% CAGR during 2026-2031.
Note: Market size and forecast figures in this report are generated using Mordor Intelligence’s proprietary estimation framework, updated with the latest available data and insights as of 2026.
Global Pharmaceutical Contract Packaging Market Trends and Insights
Drivers Impact Analysis*
| Driver | (~) % Impact on CAGR Forecast | Geographic Relevance | Impact Timeline |
|---|---|---|---|
| Serialization Mandates and Anti-Counterfeit Regulation Surge | +1.8% | Global, with near-term intensity in North America, EU, and Turkey | Short term (≤ 2 years) |
| Biologic and Specialty-Drug Boom Amplifying Sterile Packaging Demand | +2.1% | North America and EU core, APAC biosimilar spill-over | Medium term (2-4 years) |
| CDMO One-Stop-Shop Preference (Integrated Manufacturing and Packaging) | +1.5% | Global, with pronounced adoption in emerging biotech hubs (US East Coast, Bangalore, Singapore) | Medium term (2-4 years) |
| Supply-Chain Near-Shoring by Big Pharma in US-EU | +1.3% | North America and Western Europe, selective reshoring from China | Long term (≥ 4 years) |
| AI-Enabled Line-Changeover Reducing Validation Time | +0.9% | North America and EU early adopters, gradual APAC diffusion | Long term (≥ 4 years) |
| RFID-Enabled Smart Packaging for Clinical-Trial Monitoring | +0.7% | North America and EU clinical-trial corridors, limited emerging-market penetration | Medium term (2-4 years) |
| Source: Mordor Intelligence | |||
Serialization Mandates and Anti-Counterfeit Regulation Surge
National traceability rules have turned packaging into a compliance gate, forcing every carton to carry a unique 2D matrix and tamper-evident seal. In the United States, the Drug Supply Chain Security Act moved from lot-level to enhanced product-level verification in 2023, driving a new wave of outsourcing to partners already equipped with aggregation software.[1]U.S. Food and Drug Administration, “Drug Supply Chain Security Act Overview,” FDA.gov Europe’s Falsified Medicines Directive applies similar requirements, although Italy and Greece kept staggered deadlines through 2027, encouraging firms to rely on contract sites linked to the European hub. Turkey, Brazil, and South Korea each maintain distinct data templates, so contractors differentiate by offering validated, jurisdiction-specific line configurations. The result is a tangible uplift in demand for vision inspection, line-level printers, and middleware that smaller manufacturers cannot justify in-house. Outsourcing spreads those fixed costs across multiple clients, preserving capital for core R&D.
Biologic and Specialty-Drug Boom Amplifying Sterile Packaging Demand
Biologic approvals rose again in 2024, and every new monoclonal antibody, cell therapy, or GLP-1 agonist requires aseptic fill-finish under cold-chain conditions. Sponsors favor pre-filled syringes that enable patient self-administration, cutting hospital visits and improving adherence. Because a single sterile line can cost USD 50-100 million, emerging biotech companies outsource to CDMOs that bundle modular cleanrooms with secondary labeling. Growth in this segment supports an 8.93% CAGR for pre-filled syringes, outpacing bottles and blisters. The Parenteral Drug Association’s revised guidance on single-use systems has lowered the barrier for contract sites to add capacity quickly.[2]Parenteral Drug Association, “Technical Report 87, 2024 Update,” PDA.org
CDMO One-Stop-Shop Preference
Pharma sponsors increasingly want a single quality agreement that covers API, formulation, and packaging. Full-service CDMOs such as PCI Pharma Services committed USD 365 million in 2024 to integrate drug-product manufacturing and serialization-ready packaging across their networks. Catalent forged a strategic alliance with Novo Holdings to co-locate GLP-1 device assembly and packaging, illustrating how vertical integration captures downstream revenue. For standalone packagers, the trend raises competitive pressure; they must either add upstream capabilities or specialize in high-mix, low-volume jobs. Integrated models gain further momentum in India, where special economic zones allow API synthesis, formulation, and packaging on one campus, delivering duty advantages.[3]Boston Consulting Group, “India CRDMO Growth Outlook,” Bcg.com
Supply-Chain Near-Shoring by Big Pharma
Geopolitical tension and pandemic disruptions have renewed interest in locating packaging closer to end markets. The United States introduced a 25% tax credit for domestic production of essential medicines, which, while not specific to packaging, tilts capital toward U.S.-based sites. Europe’s proposed Critical Medicines Act offers parallel incentives, pushing volume back into Germany, France, and Italy. Mexico benefits from United States-Mexico-Canada Agreement provisions, shortening lead times for U.S. launches and serving as a stepping-stone for full domestic supply chains. Near-shoring strengthens demand for contractors that can stand up serialization-ready lines within a 500-mile radius of major distribution hubs.
Restraints Impact Analysis*
| Restraint | (~) % Impact on CAGR Forecast | Geographic Relevance | Impact Timeline |
|---|---|---|---|
| Evolving Global Track-and-Trace Standards Raise Compliance Costs | -0.8% | Global, with acute pain points in Turkey, Brazil, South Korea, and China | Short term (≤ 2 years) |
| Poly-Material Sustainability Rules Squeeze Margin on Plastics | -0.6% | EU core, with emerging adoption in California and select APAC markets | Medium term (2-4 years) |
| Qualified Labor Shortage for High-Speed Sterile Filling Lines | -0.5% | North America and Western Europe, selective APAC metro areas | Long term (≥ 4 years) |
| High Energy Costs for Lyophilization and Cold-Chain Packaging in Europe | -0.4% | Western Europe (Germany, Italy, France), limited impact in Iberia with renewable penetration | Medium term (2-4 years) |
| Source: Mordor Intelligence | |||
Evolving Global Track-and-Trace Standards Raise Compliance Costs
Every major market now demands serialization, but data schemas differ widely. Turkey’s system insists on real-time uploads, Brazil mandates its own aggregation hierarchy, and South Korea tightened reporting windows to 24 hours. Smaller contractors spend up to USD 1.5 million a year on software updates to keep pace, eroding margin. Multinational sponsors expect flawless compliance, and any mismatch can trigger recalls or shipment holds in China under 2024 law amendments. Until global harmonization takes hold, packagers must operate parallel IT stacks, limiting economies of scale.
Poly-Material Sustainability Rules Squeeze Margin on Plastics
The European Union’s Packaging and Packaging Waste Regulation, effective 2026, sets recycled-content mandates and restricts multi-layer laminates that dominate blister films. German law extends producer responsibility to pharmaceutical cartons, while California imposes similar thresholds. Converting to mono-material PET or PP films can raise material cost by 25%, and sponsors resist price increases. The Sustainable Packaging Coalition published design guidelines in 2024, but regulatory bodies have yet to clarify validation pathways, slowing adoption.
*Our forecasts treat driver/restraint impacts as directional, not additive. The impact forecasts reflect baseline growth, mix effects, and variable interactions.
Segment Analysis
By Service Type: Tertiary Packaging Rises With Aggregation Complexity
Secondary services accounted for 44.73% of the pharmaceutical contract packaging market in 2025 as carton serialization became unavoidable. Each carton now embeds a unique data matrix inspected at speeds above 200 units per minute, reinforcing demand for high-speed cameras and rejection systems. Primary activities, such as vial forming and bottle molding, remain largely in-house for manufacturers, yet contractors increasingly receive bulk containers for labeling and over-wrapping.
Tertiary solutions are forecast to outpace the rest of the sector at a 9.02% CAGR to 2031. Sponsors bundle case packing and pallet aggregation with secondary work to avoid data gaps between hierarchy levels. The pharmaceutical contract packaging market size for tertiary services therefore widens fastest in facilities that integrate automated pallet labelers with enterprise resource planning systems. Contractors that master this “last mile” deliverables save their clients validation cycles and reduce distribution errors, a premium many sponsors accept willingly.


By Packaging Format: Pre-Filled Syringes Capture the Self-Injection Wave
Bottles held 32.94% of 2025 revenue, supporting high-volume generic therapies and pediatric liquids. However, patient preference and payer pressure move chronic biologics into at-home injection, spurring an 8.93% CAGR for pre-filled syringes and cartridges. Subcutaneous GLP-1 agonists and TNF-alpha inhibitors now launch primarily in auto-injectors, shifting packaging complexity from hospitals to contract fill-finish providers.
The pharmaceutical contract packaging market size tied to pre-filled platforms grows because each device combines sterile assembly, device calibration, and tamper evidence in one workflow. Contract packagers add isolators and single-use tubing to accelerate changeovers between biologics, maintaining sterility without lengthy cleaning. While glass vials remain for inpatient oncology and anesthesia, their relative share declines, reinforcing the structural pivot toward ready-to-use delivery systems.
By Drug Formulation: Injectables Outpace Oral Solids on Biosimilar Entry
Tablets and capsules commanded 40.62% of 2025 revenue on the strength of blockbuster generics. Yet injectables will post the fastest 9.14% CAGR, fueled by biosimilars that target top-selling biologics arriving off patent. Each small-volume parenteral must run through ISO Class 5 environments, raising capital intensity and pushing sponsors to CDMOs that already maintain those suites.
Growth is magnified by large-volume parenterals for hospital infusions, where demand rebounded after pandemic-related shortages. The pharmaceutical contract packaging market share for injectables therefore widens, particularly in Asia Pacific where Indian CRDMOs add capacity linked to export-oriented special economic zones. Meanwhile, tablets evolve toward combination-dose and modified-release forms, creating niche opportunities for contractors with advanced coating capability.
By End-User: Venture-Backed Biotech Drives Outsourcing
Big pharma captured 28.74% of demand in 2025, using outsourcing to manage overflow or niche orphan-drug runs. Generic and biosimilar houses rely on contractors for multi-SKU serialization, but emerging biotech records the steepest 8.97% CAGR through 2031. Venture-funded cell and gene therapy developers lack the capital and time to qualify in-house cleanrooms, opting instead for turnkey CDMO partnerships.
The pharmaceutical contract packaging industry adapts by offering modular suites convertible from Phase II clinical batches to commercial launch with minimal downtime. CROs and CDMOs further outsource blinded kit assembly, layering another rung of demand. Decentralized clinical-trial models, endorsed by FDA in 2024, require patient-specific labeling and just-in-time fulfillment, a service few sponsors can replicate internally.
Geography Analysis
North America generated 35.84% of 2025 revenue, with the United States benefiting from industrial-policy tax credits and stringent FDA inspection readiness. Sponsors prize contractors that can host a pre-approval audit within weeks, so facilities in the Midwest and Northeast cluster near distribution corridors. Canada supplements capacity for bilingual labeling and Health Canada serialization, often absorbing U.S. overflow during launch spikes.
Asia Pacific is the fastest-growing region at a 9.33% CAGR, anchored by India’s CRDMO surge from USD 7 billion in 2024 to a projected USD 14 billion in 2028. China remains the world’s second-largest pharma market, yet data-localization and U.S. Biosecure Act debates drive sponsors toward a China-plus-one model that positions India, South Korea, and Singapore as alternative hubs. Japan’s mature market emphasizes high-quality clinical-trial packaging, and Australia leverages its role as a rapid-start study locale, demanding flexible, label-intensive output.
Europe faces margin pressure from energy costs: German and Italian contractors saw 40-60% jumps in natural-gas expenditure from 2022-2024. Nevertheless, the bloc’s forthcoming recycled-content rules spur investment in sustainable carton lines. The United Kingdom specializes in early-phase trial kits, while Iberian plants win volume shifts owing to renewable-energy penetration. Middle East and Africa remain nascent but invest under healthcare diversification plans, and South America, led by Brazil, favors domestic blister lines to sidestep import tariffs.

Competitive Landscape
The top 10 contractors—PCI Pharma Services, Catalent, Sharp, Almac, Wasdell, Recipharm, Tjoapack, Aphena, Jones Healthcare, and Ropack—control roughly 35-40% of global revenue, indicating moderate concentration. Full-service CDMOs extend upstream to lock in lifecycle value; for example, PCI’s USD 365 million program links formulation with serialization-ready lines. Serialization specialists maintain state-of-the-art IT stacks compliant with over 40 jurisdictions, while flexible packagers target high-mix generics and orphan drugs.
Automation suppliers such as Körber offer turnkey lines with AI-based defect recognition, cutting changeover validation from weeks to days. Patent activity climbed, with 127 pharmaceutical packaging grants in 2024, centered on tamper-evident closures and RFID-embedded labels. Indian entrants like Syngene leverage cost advantage to win global biologic projects, while Western incumbents counter by adding near-shored capacity and sustainability credentials.
The pharmaceutical contract packaging market continues to reward differentiation in compliance, speed, and sustainability. Contractors that combine automated aggregation, cold-chain competence, and recycled-content innovation stand to capture upcoming biologic and decentralized-trial pipelines.
Pharmaceutical Contract Packaging Industry Leaders
Ropack Inc.
Reed-Lane Inc.
PCI Pharma Services
Silgan Unicep (Silgan Dispensing Systems)
Sharp Packaging Services
- *Disclaimer: Major Players sorted in no particular order

Recent Industry Developments
- January 2025: Catalent completed a USD 200 million expansion in Bloomington, Indiana, adding 50,000 square feet of pre-filled syringe capacity with DSCSA-ready aggregation.
- December 2024: PCI Pharma Services bought a 120,000 square-foot blister facility in Tredegar, Wales, bringing EU-compliant serialization under one network.
- November 2024: Sharp Packaging and West Pharmaceutical Services co-validated Daikyo Crystal Zenith syringes on Sharp’s Pennsylvania line to serve monoclonal antibody launches.
- October 2024: Recipharm installed a 400-blister-per-minute serialized line at its Fontaine, France site after a EUR 35 million upgrade.


Global Pharmaceutical Contract Packaging Market Report Scope
Pharmaceutical Contract Packaging is a service where a specialized third-party company packages medicines and healthcare products on behalf of pharmaceutical manufacturers. Instead of doing packaging in-house, drug companies outsource this step to contract packaging organizations (CPOs).
The Pharmaceutical Contract Packaging Market Report is Segmented by Service Type (Primary, Secondary, Tertiary), Packaging Format (Bottles, Vials and Ampoules, Blister Packs, Sachets and Stick Packs, Pre-filled Syringes and Cartridges), Drug Formulation (Solid Dosage, Oral Liquids, Injectable), End-user (Big Pharma, Generics and Biosimilar Companies, Emerging Biotech and Start-ups, CRO and CDMO Partners, Other End-users), and Geography (North America, South America, Europe, APAC, Middle East, Africa). The Market Forecasts are Provided in Terms of Value (USD).
By Service Type
| Primary | Bottles |
| Vials and Ampoules | |
| Blister Packs | |
| Secondary | Cartons |
| Labels and Inserts | |
| Tertiary |
By Packaging Format
| Bottles | Plastic Bottles |
| Glass Bottles | |
| Vials and Ampoules | |
| Blister Packs | |
| Sachets and Stick Packs | |
| Pre-filled Syringes and Cartridges |
By Drug Formulation
| Solid Dosage | Tablets |
| Capsules | |
| Oral Liquids | |
| Injectable | Small-volume Parenterals |
| Large-volume Parenterals |
By End-user
| Big Pharma (Revenue > USD 10 bn) |
| Generics and Biosimilar Companies |
| Emerging Biotech and Start-ups |
| CRO and CDMO Partners |
| Other End-users |
By Geography
| North America | United States |
| Canada | |
| Mexico | |
| South America | Brazil |
| Argentina | |
| Rest of South America | |
| Europe | Germany |
| United Kingdom | |
| France | |
| Italy | |
| Spain | |
| Rest of Europe | |
| Asia-Pacific | China |
| India | |
| Japan | |
| South Korea | |
| Australia and New Zealand | |
| Rest of Asia-Pacific | |
| Middle East | United Arab Emirates |
| Saudi Arabia | |
| Turkey | |
| Rest of Middle East | |
| Africa | South Africa |
| Nigeria | |
| Egypt | |
| Rest of Africa |
| By Service Type | Primary | Bottles |
| Vials and Ampoules | ||
| Blister Packs | ||
| Secondary | Cartons | |
| Labels and Inserts | ||
| Tertiary | ||
| By Packaging Format | Bottles | Plastic Bottles |
| Glass Bottles | ||
| Vials and Ampoules | ||
| Blister Packs | ||
| Sachets and Stick Packs | ||
| Pre-filled Syringes and Cartridges | ||
| By Drug Formulation | Solid Dosage | Tablets |
| Capsules | ||
| Oral Liquids | ||
| Injectable | Small-volume Parenterals | |
| Large-volume Parenterals | ||
| By End-user | Big Pharma (Revenue > USD 10 bn) | |
| Generics and Biosimilar Companies | ||
| Emerging Biotech and Start-ups | ||
| CRO and CDMO Partners | ||
| Other End-users | ||
| By Geography | North America | United States |
| Canada | ||
| Mexico | ||
| South America | Brazil | |
| Argentina | ||
| Rest of South America | ||
| Europe | Germany | |
| United Kingdom | ||
| France | ||
| Italy | ||
| Spain | ||
| Rest of Europe | ||
| Asia-Pacific | China | |
| India | ||
| Japan | ||
| South Korea | ||
| Australia and New Zealand | ||
| Rest of Asia-Pacific | ||
| Middle East | United Arab Emirates | |
| Saudi Arabia | ||
| Turkey | ||
| Rest of Middle East | ||
| Africa | South Africa | |
| Nigeria | ||
| Egypt | ||
| Rest of Africa | ||


Key Questions Answered in the Report
What is the current pharmaceutical contract packaging market size?
The pharmaceutical contract packaging market size is expected to increase from USD 20.16 billion in 2025 to USD 20.82 billion in 2026 and reach USD 31.88 billion by 2031, growing at a CAGR of 8.89% over 2026-2031
What factors are driving demand for outsourced serialization services?
Mandatory unit-level traceability in the United States, European Union, Turkey, and other countries makes compliance capital-intensive, so many sponsors outsource to contractors with existing aggregation software and inspection hardware.
Why are pre-filled syringes gaining share within contract packaging?
Self-injection of biologics for chronic diseases moves packaging complexity from hospitals to specialized contract fill-finish providers that integrate device assembly, sterility testing, and cold-chain logistics.
Which region offers the fastest growth opportunity for contract packagers?
Asia Pacific, led by India’s CRDMO expansion and China-plus-one sourcing strategies, is forecast to grow at a 9.33% CAGR through 2031.
How do sustainability regulations affect pharmaceutical blister packs?
European and Californian recycled-content rules restrict multi-layer PVC–aluminum laminates, compelling packagers to adopt mono-material PET or PP films that raise input costs by up to 25%.
What is the impact of near-shoring on U.S. contract packaging capacity?
Tax incentives and supply-chain resilience goals encourage sponsors to place production in the United States or neighboring Mexico, increasing demand for domestic serialization-ready lines and rapid FDA audit readiness.
Page last updated on:


