PET Preform Market Size and Share
Market Overview
| Study Period | 2021 - 2031 |
|---|---|
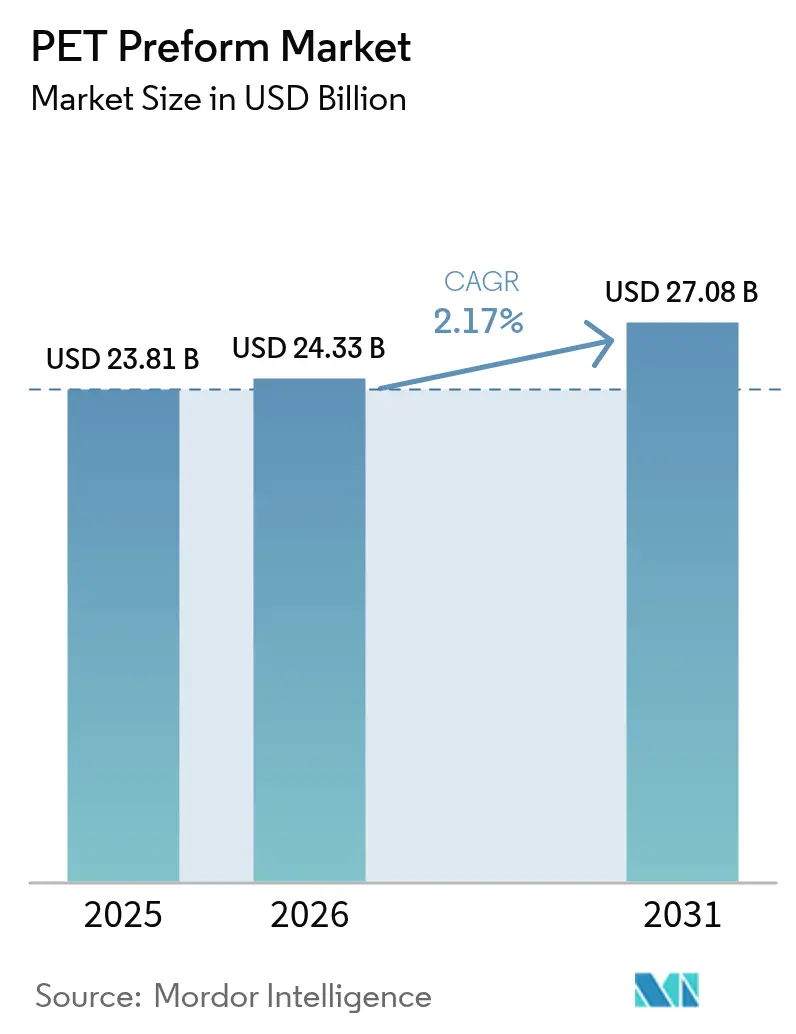
| Market Size (2026) | USD 24.33 Billion |
| Market Size (2031) | USD 27.08 Billion |
| Growth Rate (2026 - 2031) | 2.17% CAGR |
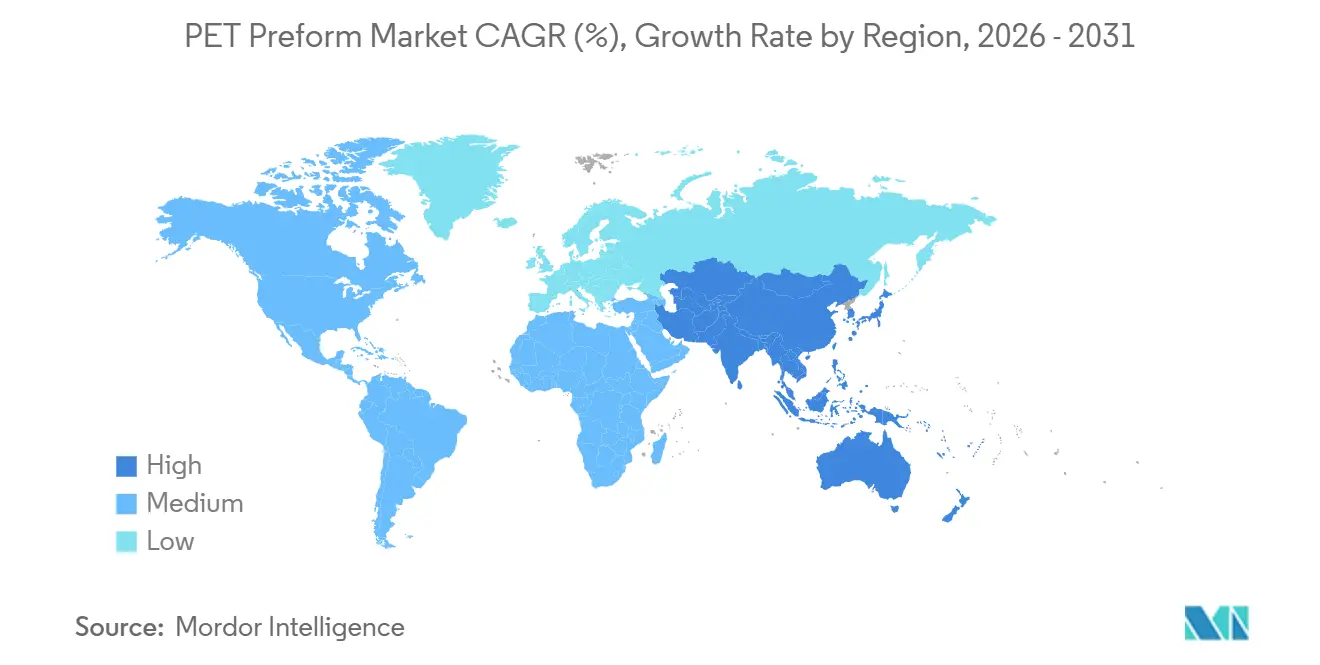
| Fastest Growing Market | Asia Pacific |
| Largest Market | Asia Pacific |
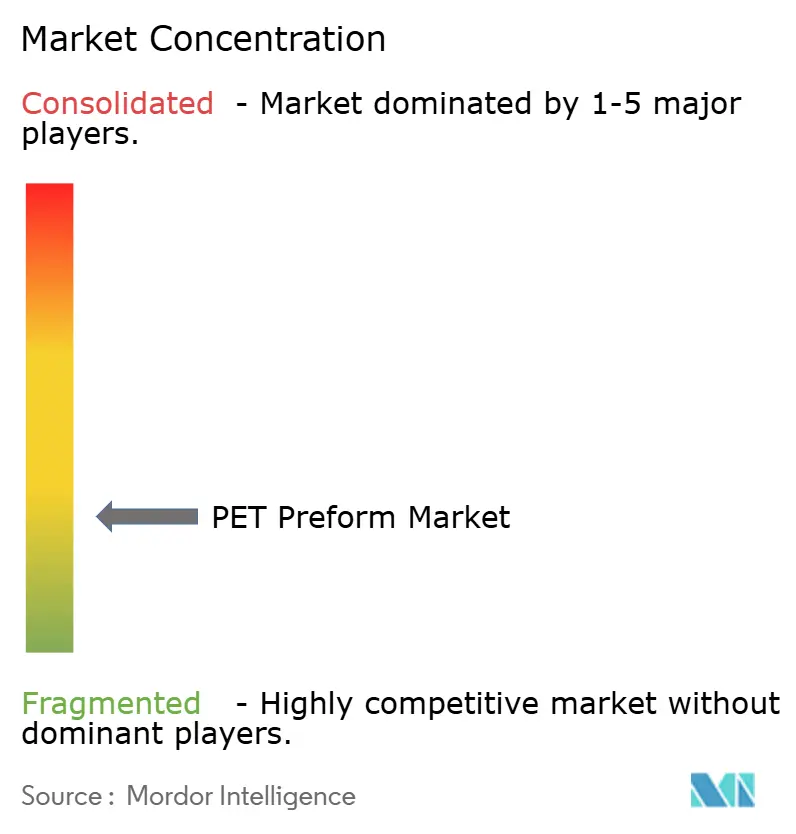
| Market Concentration | Low |
Major Players *Disclaimer: Major Players sorted in no particular order Image © Mordor Intelligence. Reuse requires attribution under CC BY 4.0. | |
PET Preform Market Analysis by Mordor Intelligence
The PET Preform Market size is projected to be USD 23.81 billion in 2025, USD 24.33 billion in 2026, and reach USD 27.08 billion by 2031, growing at a CAGR of 2.17% from 2026 to 2031. Converter profitability now hinges on meeting recycled-content mandates, managing volatile PTA and MEG costs, and deploying ultra-lightweight designs that stretch legacy blow-molding economics. The EU tethered-cap rule that took effect in July 2024 sparked a wave of neck-finish redesigns, driving a temporary surge in tooling demand as brands replaced legacy preforms. Virgin PET’s cost advantage keeps it the dominant resin today, yet rPET volumes are accelerating because the EU Packaging and Packaging Waste Regulation (PPWR) mandates 30% recycled content in single-use beverage bottles by 2030 and 65% by 2040, forcing converters to integrate recycling capacity or secure long-term flake contracts. Asia-Pacific leads global demand on the back of double-digit bottled-water growth in India and infrastructure expansion in Southeast Asia, while Europe pivots from volume to value capture through recycled-content premiums and reusable bottle systems. Competitive intensity is shifting from scale to recycling integration; ALPLA, Plastipak, Indorama Ventures and RESILUX are investing in captive rPET assets to shield margins from feedstock shortages and rising plastic-tax liabilities.
Key Report Takeaways
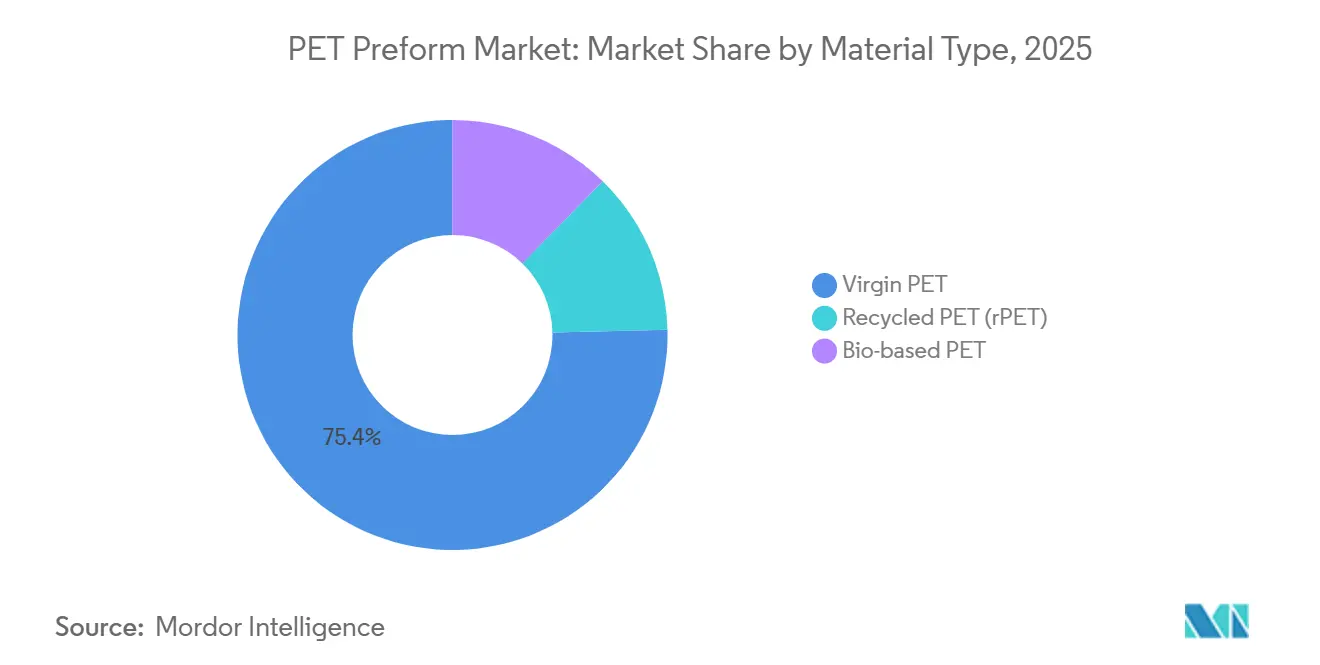
- By material type, virgin PET held 75.38% of PET preform market share in 2025, while recycled PET (rPET) is projected to expand at a 3.18% CAGR through 2031.
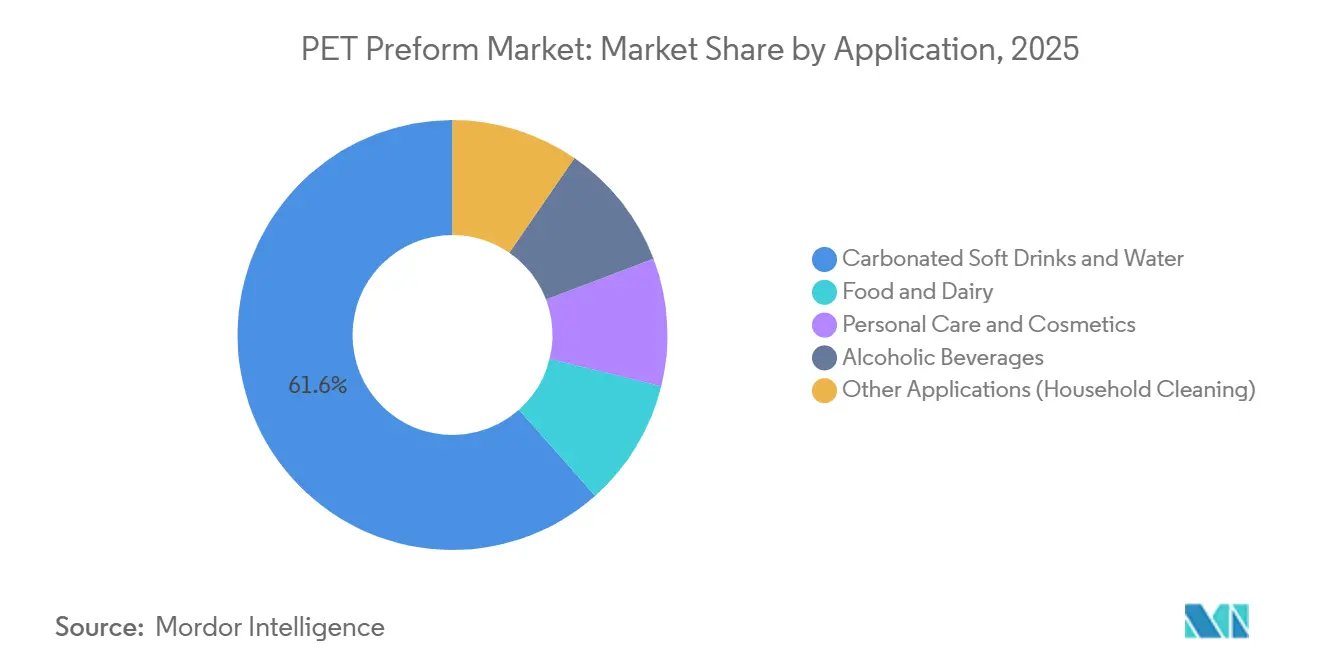
- By application, carbonated soft drinks and water commanded 61.55% of the PET preform market size in 2025, whereas food and dairy is advancing at a 2.44% CAGR through 2031.
- By geography, Asia-Pacific accounted for 46.20% of 2025 value and is forecast to record the highest regional CAGR of 2.78% through 2031.
Note: Market size and forecast figures in this report are generated using Mordor Intelligence’s proprietary estimation framework, updated with the latest available data and insights as of 2026.
Global PET Preform Market Trends and Insights
Drivers Impact Analysis*
| Driver | (~) % Impact on CAGR Forecast | Geographic Relevance | Impact Timeline |
|---|---|---|---|
| Growing demand from beverage industry | +0.6% | Global, with strongest gains in Asia-Pacific (India, Indonesia, Vietnam) and Middle-East | Medium term (2-4 years) |
| Surge in bottled water consumption in emerging economies | +0.5% | Asia-Pacific (India, Southeast Asia), Middle-East and Africa (Saudi Arabia, UAE, Egypt) | Short term (≤ 2 years) |
| Sustainability push for recycled (rPET) content | +0.4% | Europe (EU PPWR mandates), North America (voluntary commitments), spillover to APAC | Long term (≥ 4 years) |
| Mandatory tethered-cap EU directive boosting preform redesign volumes | +0.3% | Europe (EU27 + UK considering alignment) | Short term (≤ 2 years) |
| Advent of low-viscosity PET resins enabling ultra-lightweight preforms | +0.2% | North America, Europe, advanced APAC markets (Japan, South Korea) | Medium term (2-4 years) |
| Source: Mordor Intelligence | |||
Growing Demand from Beverage Industry
Beverage brand owners continue to consolidate SKU portfolios around PET because consumers favor resealable, shatter-resistant packs and retailers value formats that lower cold-chain costs. India recorded 13-15% bottled-water growth in 2024, and Coca-Cola Andina is spending more than USD 500 million through 2026 to expand PET capacity in Brazil and Chile, underscoring how brand owners vertically integrate preform conversion to secure supply. The shift of niche alcoholic drinks and premium teas into PET adds incremental volume, although reusable PET programs in Germany demonstrate that circular schemes can temper single-use demand while raising durability standards for refillable preforms.
Surge in Bottled-Water Consumption in Emerging Economies
Per-capita bottled-water use in China reached 39 liters in 2024 versus 118 liters in Western Europe, signaling ample runway for PET preform market growth as rising incomes meet sub-optimal tap-water infrastructure. Indonesia and Vietnam exhibit double-digit expansion as multinational fillers localize preform production to hedge logistics costs, while GCC nations view bottled water as essential due to arid climates, supporting 4.5% regional growth through 2032. Lower regulatory maturity in Cambodia and Laos keeps growth uneven and highlights payment-risk and logistics challenges for converters targeting frontier markets.
Sustainability Push for Recycled Content
The PPWR’s binding 30% recycled threshold by 2030 is reshaping procurement strategies: ALPLA invested EUR 500 million in recycling plants and Plasticpak’s USD 184 million Clean Tech site in Michigan now supplies 100% rPET bottles to Coca-Cola. Scarcity of food-grade bales sustains 20-30% price premiums for rPET over virgin resin, and EFSA-approved mechanical loops dominate supply because chemical depolymerization projects require capital outlays topping USD 200 million and endure 18-36 month approval cycles. Consequently, converters are retrofitting ISBM lines to process low-IV rPET blends while meeting color and acetaldehyde limits.
Mandatory tethered-cap EU Directive Boosting Preform Redesign Volumes
From July 2024, all EU beverage bottles under 3 liters require tethered closures, driving a one-time preform redesign cycle: 15-20% of European molds were modified or replaced in 2024-2025[1]European Commission, “Single-Use Plastics Directive,” europeancommission.europa.eu . The hinge adds geometric complexity, so converters with in-house tooling captured rush-order margins, while third-party dependent players faced delays. If California adopts a similar bill now under legislative review, a second redesign wave could begin in 2027-2028, extending tooling demand into North America.
Restraints Impact Analysis*
| Restraint | (~) % Impact on CAGR Forecast | Geographic Relevance | Impact Timeline |
|---|---|---|---|
| Volatile PTA and MEG prices disrupting converter margins | -0.4% | Global, with acute impact in Asia-Pacific naphtha-based producers | Short term (≤ 2 years) |
| Plastic-tax legislation and EPR fees tightening profit pools | -0.3% | Europe (UK, Italy, Spain), emerging ASEAN EPR rollouts (Vietnam, Philippines) | Medium term (2-4 years) |
| Supply-chain competition for food-grade rPET flakes | -0.2% | Europe, North America, spillover to APAC as mandates phase in | Long term (≥ 4 years) |
| Source: Mordor Intelligence | |||
Volatile PTA and MEG Prices Disrupting Converter Margins
PTA fell from USD 800-900/t in early 2024 to USD 600-700/t by year-end, while MEG slid to USD 500-600/t, causing inventory-loss headaches for converters locked into 60-day cost-pass-through clauses. Southeast Asian naphtha crackers ran negative margins, prompting shutdowns at complexes in Vietnam and Malaysia and tightening regional PET supply. Large integrated players such as Indorama Ventures mitigated risk by buying upstream polyester assets, but independent converters absorb the volatility unless they diversify resin sourcing.
Plastic-Tax Legislation and EPR Fees Tightening Profit Pools
The UK plastic-packaging tax stands at GBP 228.82/t from April 2026 for packs under 30% recycled content, and Italy and Spain impose EUR 0.45/kg levies on single-use plastics[2]UK Government, “Plastic Packaging Tax Rates 2026,” gov.uk . EU EPR fees range EUR 400-600/t with modulation factors that penalize hard-to-recycle designs, trimming virgin-resin cost advantages by 15-25%. Vietnam and the Philippines already mandate EPR, while Indonesia, Thailand and Malaysia draft similar rules, leaving converters to juggle non-harmonized compliance regimes that elevate admin overhead and encourage heavier-gauge reusable PET programs in DRS markets.
*Our forecasts treat driver/restraint impacts as directional, not additive. The impact forecasts reflect baseline growth, mix effects, and variable interactions.
Segment Analysis
By Material Type: Virgin PET Dominance Erodes as rPET Gains Regulatory Tailwind
Virgin PET held 75.38% of 2025 value, yet rPET is set to grow at 3.18% CAGR through 2031as PPWR mandates prompt brand owners to lock in recycled content. The PET preform market size for virgin resin in carbonated soft drinks remains resilient because 0.80-0.84 dL/g IV grades deliver the CO₂ retention needed for 12-month shelf life, while rPET’s lower IV constrains its use above 50% inclusion without blending.
Converters with captive recycling enjoy feedstock surety, whereas independents pay 20-30% premiums for third-party flakes, exposing them to allocation risk during supply squeezes. EFSA’s lengthy approval queue reinforces entry barriers, and bio-based PET trails due to 30-50% cost premiums that only niche cosmetic brands absorb, leaving policy-driven rPET and ultralight virgin blends as the decisive growth levers.


By Application: Carbonated Soft Drinks Anchor Volume While Food and Dairy Lead Growth
Carbonated soft drinks and packaged water provided 61.55% of 2025 demand, anchoring absolute tonnage despite below-average growth as consumers migrate to teas and low-sugar alternatives packaged in cans or cartons. Food and dairy, in contrast, is projected to expand at a 2.44% CAGR as aseptic technology enables ambient milk and yogurt drinks to leave glass and carton behind, and the PET preform market size for this niche benefits from higher unit margins tied to barrier layers and hot-fill robustness.
Personal-care bottles add design flexibility and revenue. Alcoholic beverage adoption advances where barrier-enhanced preforms meet oxygen-ingress standards, yet cultural and regulatory hurdles keep uptake modest. Reusable PET bottles in DRS markets introduce heavier preforms rated for 25 cycles, slightly offsetting single-use declines and compelling converters to manage dual tooling inventories.
Geography Analysis
Asia-Pacific captured 46.20% of the 2025 value, and the PET preform market is forecast to post a 2.78% CAGR through 2031 as surging bottled-water demand in India, Indonesia, and Vietnam intersects with large-scale resin imports from Middle-Eastern suppliers. China’s per-capita consumption nears urban saturation, but tier-2 cities still offer upside, and India is evolving into a recycling hub as Revalyu Resources lifts Nashik capacity to over 35 million bottles per day by 2026.
Europe grows below average because deposit return schemes decrease single-use unit volumes even as tethered caps and recycled-content rules lift complexity. ALPLA’s EUR 500 million outlay on new recycling plants and RESILUX’s 70% stake in Greentech illustrate how continental converters trade volume for value by embedding rPET premiums. The PPWR-mandated 90% DRS collection rate by 2029 could cut virgin-resin demand per liter by double digits, amplifying the strategic shift toward heavier, refillable preforms.
In North America, with growth tied to functional-beverage and e-commerce requirements, Plastipak’s Clean Tech site supplies closed-loop bottles for Coca-Cola. California’s potential tethered-cap bill may ignite another redesign wave in 2027-2028. Mexico is rising as a near-shoring base under USMCA, aided by UFlex’s PCR PET line investment, while Brazil and Colombia deploy over USD 650 million in virgin and recycled PET capacity to meet rising regional drink consumption.

Competitive Landscape
Low concentration defines the PET preform market: the top five converters do not exceed 40% combined revenue, yet they dominate access to food-grade rPET. ALPLA recycled 340,000 t in 2024 and targets 380,000 t in 2025, pairing backward integration with lightweighting expertise to win high-spec contracts. Plastipak’s USD 184 million Michigan facility delivers 100% rPET bottles, locking in Coca-Cola offtake and showcasing brand-aligned sustainability partnerships.
Indorama Ventures leveraged its global PET resin position by acquiring upstream PTA and MEG assets, lessening exposure to volatile spot prices and giving it pricing agility that merchant converters lack. RESILUX expanded into Balkans recycling, while Retal Industries pursues neck-finish standardization to streamline post-tethered-cap production. Emerging disruptors like Revalyu Resources plan 240 t/day chemical-recycling plants in the United States by 2027, promising virgin-equivalent resin from contaminated feedstock, though cost parity with mechanical loops remains elusive.
Technology plays a rising role: Husky’s servo-driven injection units and AI-enabled predictive-maintenance platforms cut cycle times 5-10%, letting converters recoup capital via energy savings and reduced scrap. Standards bodies also shape competition; APR’s 2024 PET laboratory protocols and ISO 7683:2024 removable-label criteria reward converters that align designs with recycling guidelines, granting them lower EPR fees and smoother market access.
PET Preform Industry Leaders
Alpla
Indorama Ventures Public Company Limited
Plastipak Holdings Inc.
RESILUX NV
Retal Industries LTD.
- *Disclaimer: Major Players sorted in no particular order

Recent Industry Developments
- February 2026: Sidel delivered Britannia's first aseptic PET packaging line in India for dairy beverages. It incorporated "dry" preform decontamination to eliminate water usage and minimize chemical consumption.
- February 2025: Origin Materials launched commercial production of PET caps at its Reed City, Michigan, facility, using its proprietary CapFormer system to manufacture sustainable, recyclable, and tethered-cap solutions. The company scaled up operations to meet the growing demand for PCO 1881-compliant caps, with an annual production goal of hundreds of millions of caps.


Global PET Preform Market Report Scope
PET preforms serve as precursors, later molded into polyethylene terephthalate (PET) containers. They streamline the production of PET bottles, facilitating swift manufacturing. These bottles find utility in packaging a diverse range of products, including mineral water, juices, liquor, soft drinks, carbonated beverages, edible oils, medications, pickles, and jams.
The PET preform market is segmented by material type, application, and geography. By material type, the market is segmented into virgin PET, recycled PET (rPET), and bio-based PET. By application, the market is segmented into carbonated soft drinks and water, food and dairy, personal care and cosmetics, alcoholic beverages, and other applications (household cleaning). The report also covers the market sizes and forecasts for the PET preforms in 27 countries across major regions. For each segment, the market sizing and forecasts have been done on the basis of value (USD).
| Virgin PET |
| Recycled PET (rPET) |
| Bio-based PET |
| Carbonated Soft Drinks and Water |
| Food and Dairy |
| Personal Care and Cosmetics |
| Alcoholic Beverages |
| Other Applications (Household Cleaning) |
| Asia-Pacific | China |
| India | |
| Japan | |
| South Korea | |
| Indonesia | |
| Vietnam | |
| Thailand | |
| Malaysia | |
| Rest of Asia-Pacific | |
| North America | United States |
| Canada | |
| Mexico | |
| Europe | Germany |
| United Kingdom | |
| France | |
| Italy | |
| Spain | |
| NORDIC Countries | |
| Turkey | |
| Russia | |
| Rest of Europe | |
| South America | Brazil |
| Argentina | |
| Colombia | |
| Rest of South America | |
| Middle-East and Africa | Saudi Arabia |
| United Arab Emirates | |
| Qatar | |
| South Africa | |
| Nigeria | |
| Egypt | |
| Rest of Middle-East and Africa |
| By Material Type | Virgin PET | |
| Recycled PET (rPET) | ||
| Bio-based PET | ||
| By Application | Carbonated Soft Drinks and Water | |
| Food and Dairy | ||
| Personal Care and Cosmetics | ||
| Alcoholic Beverages | ||
| Other Applications (Household Cleaning) | ||
| By Geography | Asia-Pacific | China |
| India | ||
| Japan | ||
| South Korea | ||
| Indonesia | ||
| Vietnam | ||
| Thailand | ||
| Malaysia | ||
| Rest of Asia-Pacific | ||
| North America | United States | |
| Canada | ||
| Mexico | ||
| Europe | Germany | |
| United Kingdom | ||
| France | ||
| Italy | ||
| Spain | ||
| NORDIC Countries | ||
| Turkey | ||
| Russia | ||
| Rest of Europe | ||
| South America | Brazil | |
| Argentina | ||
| Colombia | ||
| Rest of South America | ||
| Middle-East and Africa | Saudi Arabia | |
| United Arab Emirates | ||
| Qatar | ||
| South Africa | ||
| Nigeria | ||
| Egypt | ||
| Rest of Middle-East and Africa | ||


Key Questions Answered in the Report
What is the expected value of global PET preform demand by 2031?
Global demand is forecast to reach USD 27.08 billion in 2031 on a 2.17% CAGR from 2026.
Which region is set to record the fastest volume growth for PET preforms between 2026-2031?
Asia-Pacific is projected to expand at 2.78% CAGR, led by bottled-water consumption in India, Indonesia and Vietnam.
How will the EU’s recycled-content mandate affect PET preform sourcing after 2026?
Converters must secure food-grade rPET to hit the 30% recycled threshold by 2030, pushing vertical integration and long-term flake contracts.
What is the main processing hurdle when moving to sub-6 g ultra-lightweight preforms?
Low-viscosity resins narrow injection-molding windows, so lines need upgraded temperature control and faster cycle capability.
Page last updated on:


