Market Overview
| Study Period | 2021 - 2031 |
|---|---|
| Forecast Data Period | 2026 - 2031 |
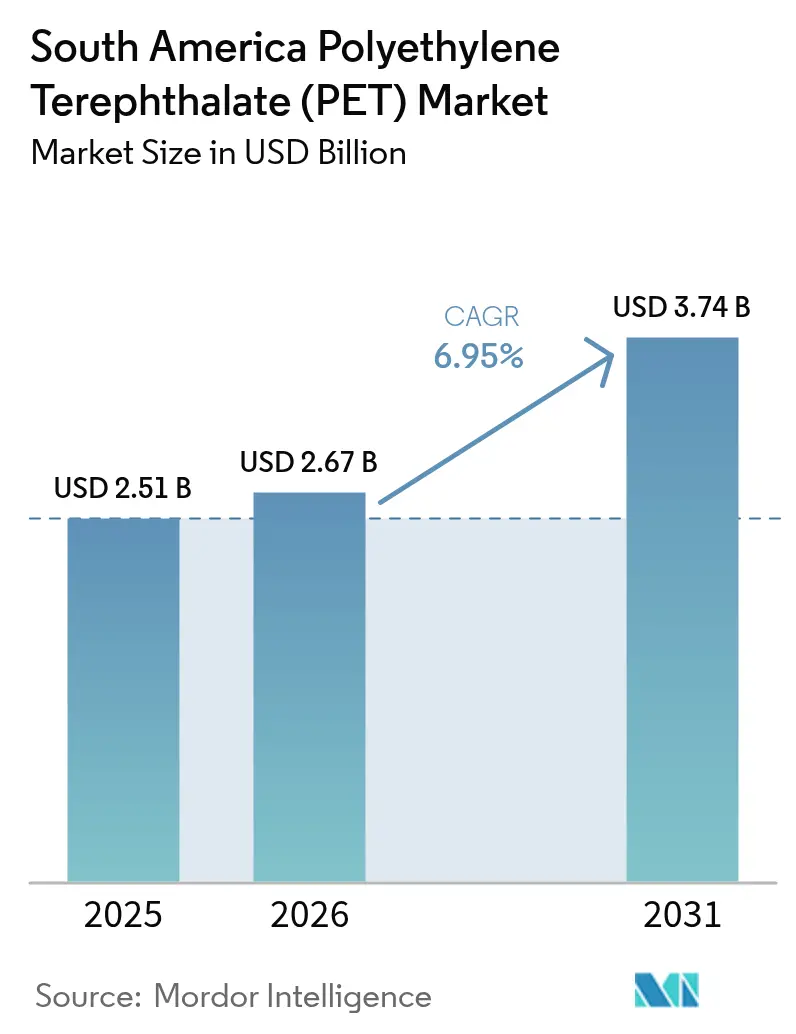
| Base Year Market Size (2025) | USD 2.51 Billion |
| Market Size (2026) | USD 2.67 Billion |
| Market Size (2031) | USD 3.74 Billion |
| Growth Rate (2026 - 2031) | 6.95% CAGR |
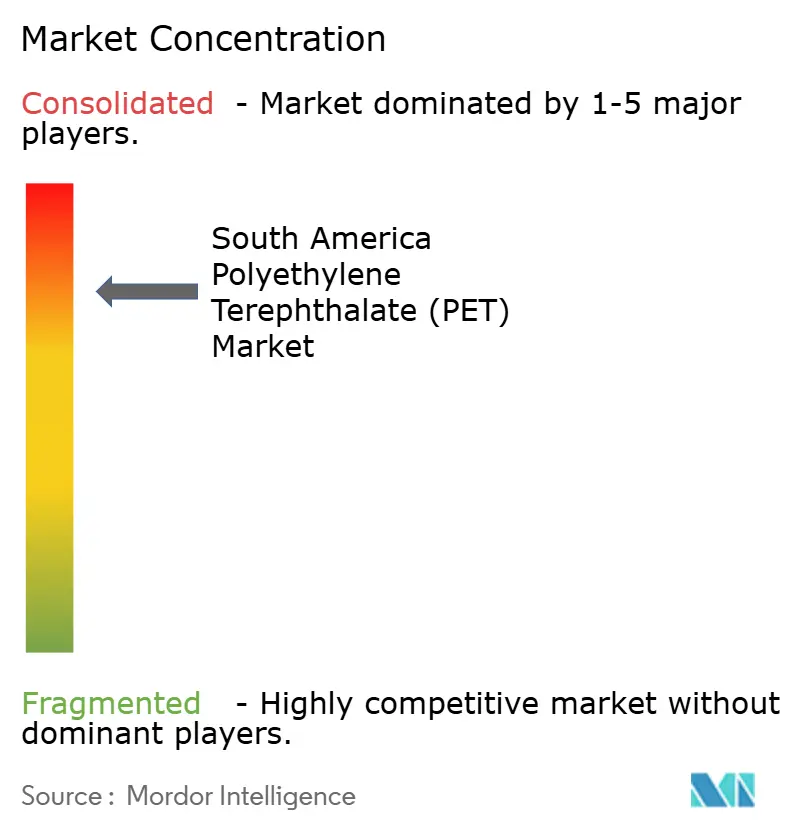
| Market Concentration | High |
Major Players *Disclaimer: Major Players sorted in no particular order Image © Mordor Intelligence. Reuse requires attribution under CC BY 4.0. | |
South America Polyethylene Terephthalate (PET) Market Analysis by Mordor Intelligence
The South America Polyethylene Terephthalate Market size is expected to increase from USD 2.51 billion in 2025 to USD 2.67 billion in 2026 and reach USD 3.74 billion by 2031, growing at a CAGR of 6.95% over 2026-2031. A 20% Brazilian import tax on polymers through October 2026 is accelerating near-shoring, prompting Coca-Cola FEMSA to install fourteen new bottling lines during 2025, a 75% year-over-year jump that directs resin demand toward domestic suppliers. Container freight from Asia to Latin America soared from USD 1,170 per forty-foot unit in March 2024 to USD 8,000-10,000 by June 2024, reinforcing the regional focus on local sourcing. Brazil Decree 12,688 will require 22% recycled content in PET bottles from 2026, pushing converters to sign multi-year rPET (recycled PET) offtake contracts well ahead of actual production. At the same time, port congestion at Navegantes raised PET spot prices 4.82% month-over-month in Q4 2025, highlighting the logistical fragility that continues to influence converter margins.
Key Report Takeaways
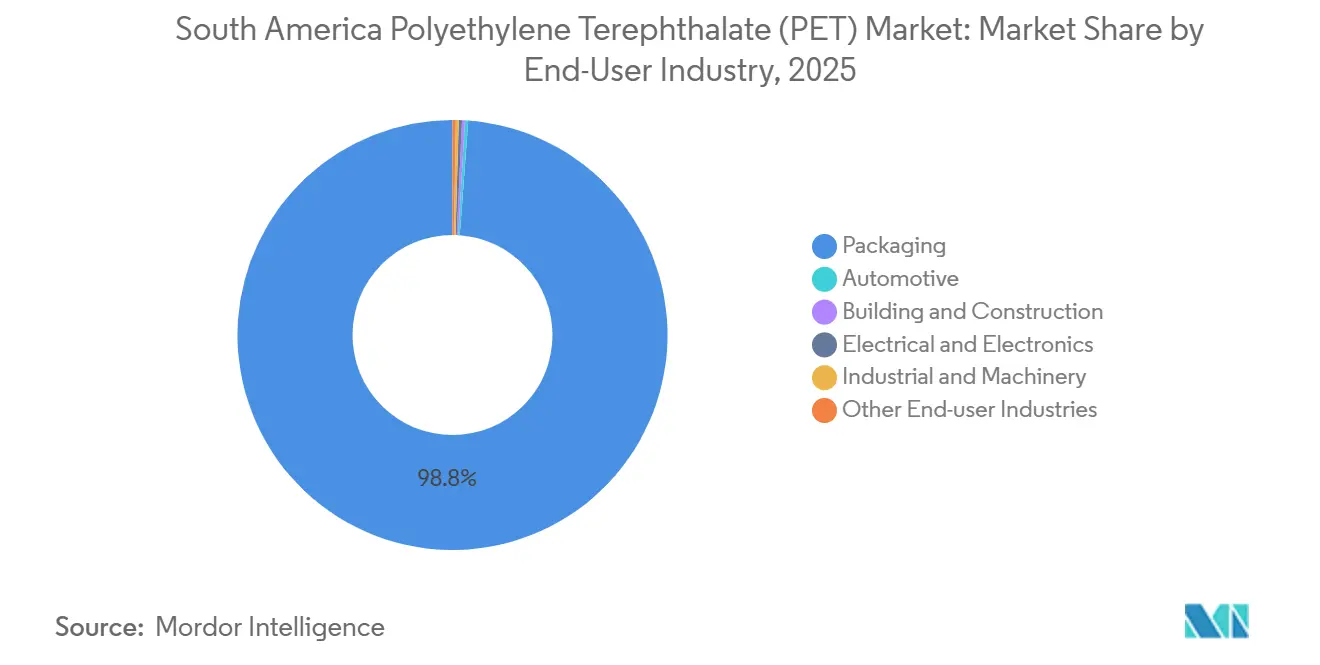
- By end-user industry, packaging held 98.84% of the South America Polyethylene Terephthalate market share in 2025, whereas electrical and electronics posted the fastest 7.28% CAGR during the forecast period (2026-2031).
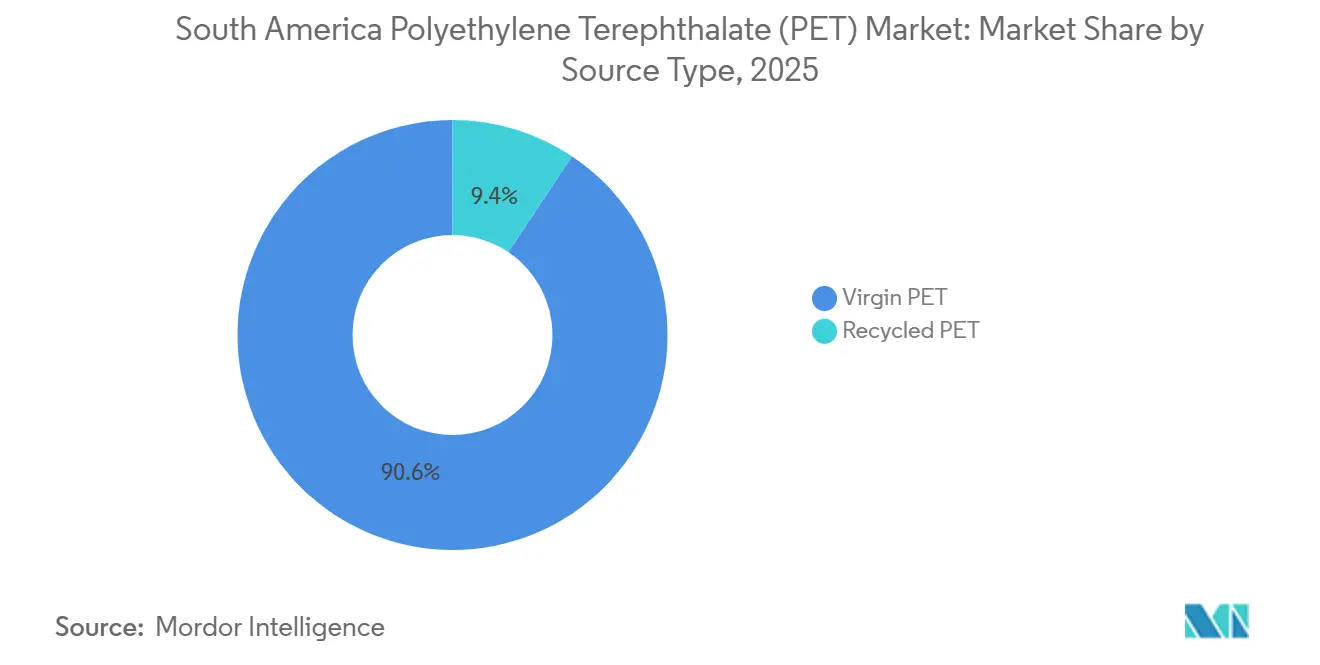
- By source type, virgin PET commanded 90.61% of the South America Polyethylene Terephthalate market size in 2025; recycled PET is set to expand at a 5.99% CAGR during the forecast period (2026-2031).
- By country, Brazil led with 66.67% of regional volume in 2025 and is advancing at a 5.45% CAGR during the forecast period (2026-2031).
Note: Market size and forecast figures in this report are generated using Mordor Intelligence’s proprietary estimation framework, updated with the latest available data and insights as of 2026.
South America Polyethylene Terephthalate (PET) Market Trends and Insights
Driver Impact Analysis*
| Driver | (~) % Impact on CAGR Forecast | Geographic Relevance | Impact Timeline |
|---|---|---|---|
| Brazil mandatory recycled-content targets for PET bottles | +1.20% | Brazil, with spillover to Mercosur trade partners | Medium term (2-4 years) |
| Growing on-premise beverage demand boosting bottle-grade PET | +0.80% | Brazil urban centers, Argentina metropolitan areas | Short term (≤ 2 years) |
| Import-substitution push after Brazil polymer import-tax hike | +1.00% | Brazil, with indirect effects on Argentina and Paraguay | Short term (≤ 2 years) |
| Rapid expansion of rPET capacity via public-private partnerships | +1.50% | Brazil (São Paulo, Paraná), Argentina (Buenos Aires province) | Medium term (2-4 years) |
| Near-shoring of FMCG bottling lines to mitigate supply-chain risk | +1.30% | Brazil (Southeast, Northeast), Argentina (Córdoba, Mendoza) | Long term (≥ 4 years) |
| Source: Mordor Intelligence | |||


Brazil Mandatory Recycled-Content Targets for PET Bottles
Brazil Decree 12,688 imposes a 22% recycled-content threshold in 2026 and 40% by 2040 for PET beverage bottles[1]Plastic Technology, “Brazil Decree 12,688 Sets Recycled-Content Targets,” plasticstechnology.com. The rule pairs content mandates with recovery-rate targets, creating a dual compliance burden that is already driving early offtake agreements for rPET. Tradable certificates (CCRLR and CERE) monetize post-consumer volumes, giving formal recyclers a fresh revenue stream formerly captured by informal pickers. Coca-Cola’s November 2025 partnership with Cirklo and Solar to open a bottle-to-bottle plant illustrates the scale of brand-led investment required to meet the new threshold. Although Brazil’s 56% collection rate already surpasses Europe's, mechanical yield remains the bottleneck that converters must solve to comply with the 2026 deadline.
Growing On-Premise Beverage Demand Boosting Bottle-Grade PET
On-premise beverage volumes rebounded in 2025 as mobility normalized, with Brazil’s ready-to-drink category up 8% year-over-year in Q1 2026[2]MDIC Brazil, “Industrial Production Indicators Q1 2026,” gov.br/mdic. Coca-Cola FEMSA’s R$600 million (USD 107.46 million) expansion at Mogi das Cruzes, operational from January 2026, targets this channel and underscores how near-site production reduces logistics costs for high-turnover SKUs. PET’s shatter resistance and barrier properties remain indispensable to stadiums and restaurants that favor single-serve formats. Pilot deposit-return schemes in Rio de Janeiro may further improve bottle recovery, but the region’s informal picker network still supplies the majority of post-consumer feedstock. Whether formal systems can replicate Europe’s 90% return rates without eroding cost advantages will shape the next phase of South America PET market growth.
Rapid Expansion of rPET Capacity via Public-Private Partnerships
Indorama tripled Juiz de Fora rPET capacity to 25,000 tpa (tons per annum) in 2023, yet closed its Minas Gerais plant in September 2025, signaling a preference for fewer, high-utilization assets. Public-private partnerships are stepping in; Coca-Cola’s 25,000 tpa facility came online in November 2025 under Brazil’s Planares roadmap. ALPLA entered South American recycling in January 2025 via a joint venture with Clean Bottle and pledged EUR 15 million (USD 16.96 million) annually from 2026 for additional lines. Such alliances pool capital and feedstock risk but concentrate supply among vertically integrated players, tightening the resin market for independent converters. Formalizing long-term offtake contracts is becoming the new threshold for competitiveness within the South America PET market.
Import-Substitution Push after Brazil Polymer Import-Tax Hike
Brazil’s 20% polymer import tax, in force until October 2026, cut PET imports by 12% in its first full month, steering demand to local resin and bottle producers. Coca-Cola FEMSA’s USD 1.28 billion investment program in 2025 illustrates how FMCG (fast-moving consumer goods) leaders are scaling regional capacity to avoid the tariff. Conversely, Argentina removed import restrictions in late 2024, attracting low-cost Chinese PET that now pressures the sole domestic producer. The widening policy gap fragments supply chains across Mercosur, with converters near Paraguay and Uruguay arbitraging resin flows. Import substitution, therefore, acts as both a growth engine and a fragmentation catalyst in the South America PET market.
Restraint Impact Analysis*
| Restraint | (~) % Impact on CAGR Forecast | Geographic Relevance | Impact Timeline |
|---|---|---|---|
| Crude-oil–linked feedstock price volatility | -0.90% | Global, with acute impact on Brazil and Argentina import-dependent converters | Short term (≤ 2 years) |
| Port-congestion and customs-strike logistics bottlenecks | -0.70% | Brazil (Santos, Rio de Janeiro), Argentina (Buenos Aires) | Short term (≤ 2 years) |
| Low South-American recycling-infrastructure utilisation (less than 15%) | -0.50% | Brazil interior states, Argentina provinces outside Buenos Aires, Rest of South America | Long term (≥ 4 years) |
| Source: Mordor Intelligence | |||
Crude-Oil-Linked Feedstock Price Volatility
PET prices track paraxylene and monoethylene glycol, both crude derivatives, leaving converters exposed to Brent swings of USD 72-92 per barrel during 2025. A USD 10 increase in crude typically lifts PET contract prices 6-8% within two months. Brazil imports roughly 60% of PX, so Petrobras’s R$8 billion (USD 1.43 billion) plan to double Rnest refinery capacity to 260,000 bpd (barrels per day) by 2029 should temper future volatility. Meanwhile, the October 2025 spot PET averaged USD 1.06/kg against rPET at USD 1.12/kg; high crude narrows this premium and slows recycled adoption. Argentina’s single producer, facing thin margins, often reduces output instead of absorbing spikes, forcing converters to pay freight-loaded spot prices.
Low South American Recycling-Infrastructure Utilization
Brazil’s recyclers run at 70% of 500,000 tpa nameplate, translating to 350,000 tpa effective throughput. Informal pickers contribute 90% of collections, yet bale contamination and seasonality raise idleness peaks to 40%. Only 200 of an estimated 1,300 PET recyclers registered for tradable certificates by Q1 2026, limiting access to the working capital needed for wash-line upgrades. Argentina lacks any commercial rPET plant, and differing food-contact rules hinder cross-border trade. Unless utilization rises, the South America PET industry will face chronic rPET shortages just as recycled-content mandates tighten.
*Our forecasts treat driver/restraint impacts as directional, not additive. The impact forecasts reflect baseline growth, mix effects, and variable interactions.
Segment Analysis
By End-User Industry - Packaging Dominance Masks Electronics Surge
Packaging held 98.84% of the 2025 South America Polyethylene Terephthalate (PET) market share, anchored by beverage bottling’s need for lightweight, shatter-resistant containers. Electrical and electronics, though small, will expand at a 7.28% CAGR during the forecast period (2026-2031) as regional smartphone and tablet assembly in Manaus drives PET film adoption for flexible circuits. Coca-Cola FEMSA’s ongoing line expansions reinforce packaging’s pull but also indicate rising demand for single-serve SKUs in on-premise channels. Automotive, construction, and industrial uses remain secondary, limited by modest vehicle output and dominance of polypropylene in geotextiles.
A rebound in on-premise consumption is lengthening bottling-line run times, raising resin draw across Brazil and its neighbors. Electronics OEMs value PET’s dimensional stability and dielectric traits, qualities that invite thin-film converters to co-locate near assembly clusters. As component miniaturization advances, PET’s saturation point in high-volume beverage uses may give way to differentiated, margin-rich electronics films. FMCG brand owners nonetheless retain the largest procurement bargaining power, often dictating resin specifications that influence the wider South America PET market.


By Source Type - Virgin Leadership, Recycled Momentum
Virgin resin occupied 90.61% of the market in 2025, but rPET’s 5.99% CAGR during the forecast period (2026-2031) makes it the clear growth engine. Indorama’s post-expansion Juiz de Fora line exemplifies scale economics, yet the Minas Gerais closure shows how low-margin assets are being retired. Price parity looms when crude oil spikes narrow the recycled premium, occasionally stalling rPET take-up among price-sensitive converters. Chemical recycling remains pilot-only, so mechanical routes must satisfy Brazil’s 22% recycled-content rule for the foreseeable future.
Brand-owned rPET facilities are shifting bargaining power away from open-market recyclers. Coca-Cola’s November 2025 plant guarantees 25,000 tpa of food-grade supply, reducing the beverage giant’s exposure to spot premiums. Independent recyclers that lack secure offtake increasingly compete on bale procurement, compressing margins and risking underutilization. Long-term, virgin producers may enter chemical recycling to defend volume, recasting South America Polyethylene Terephthalate (PET) market supply dynamics yet again.
Geography Analysis
Brazil’s 66.67% share in 2025 anchors the South America Polyethylene Terephthalate (PET) market, and its 5.45% CAGR during the forecast period (2026-2031) reflects the cumulative effects of import tariffs, multibillion-dollar FMCG investments, and future paraxylene self-sufficiency. Coca-Cola FEMSA alone injected USD 1.28 billion into new lines during 2025, signaling entrenched confidence in domestic capacity. The recycled-content mandate sets a structural floor under rPET demand, encouraging vertical integration and infrastructure upgrades. Yet port congestion and customs strikes periodically inflate logistics costs, causing month-on-month PET price spikes that challenge converters’ working-capital cycles.
Argentina, by contrast, has opened its borders to cheaper Chinese resin, immediately undermining the country’s sole PET producer. Reduced operating rates limit domestic bargaining power, and converters rely on volatile spot imports that mirror global freight gyrations. Absent new investments, Argentina risks ceding even more share to Brazilian suppliers as tax differences widen. Rest-of-South America remains a mosaic of import dependence: Chile leads in per-capita bottled-water consumption but lacks resin assets; Colombia’s beverage uptick is offset by currency swings; and Peru’s niche geotextile applications barely move the demand needle. Collectively, these smaller markets watch Brazil’s policy experiments as possible blueprints for their own sustainability agendas.
Competitive Landscape
The South America Polyethylene Terephthalate (PET) market is highly consolidated. Indorama, SABIC, Reliance, Alpek, and Sinopec combine global scale with local footprints, yet none holds a dominant position due to diverging national trade policies. Vertical integration is accelerating: Coca-Cola’s 25,000 tpa rPET plant guarantees supply under the new recycled-content rule and pressures spot prices. Competitive advantage is increasingly defined by secure feedstock, integrated recycling, and policy foresight rather than absolute nameplate capacity.
South America Polyethylene Terephthalate (PET) Industry Leaders
Alpek, S.A.B. de C.V. (Alfa S.A.B. de C.V.)
ALPLA
Enka
Formosa Plastics Group.
Indorama Ventures Public Company Limited
- *Disclaimer: Major Players sorted in no particular order

Recent Industry Developments
- April 2025: Brazil initiated an anti-dumping investigation into PET with an intrinsic viscosity of 0.78–0.88 dl/g from Malaysia and Vietnam, aiming to protect domestic producers.
- January 2025: ALPLA acquired a majority stake in Clean Bottle, a Brazilian recycler with an annual output of 15,000 tons, advancing its vertical integration strategy in the PET market.


South America Polyethylene Terephthalate (PET) Market Report Scope
Polyethylene terephthalate (PET), a robust and lightweight thermoplastic from the polyester family, finds extensive applications in synthetic fibers, liquid and food packaging, and thermoforming.
The South America Polyethylene Terephthalate (PET) market is segmented by end-user industry and source type. By end-user industry, the market is segmented into automotive, building and construction, electrical and electronics, industrial and machinery, packaging, and other end-user industries. By source type, the market is segmented into virgin PET and rPET. The report also covers market sizing and forecasts for 2 countries across the region in value (USD).
By End-User Industry
| Automotive |
| Building and Construction |
| Electrical and Electronics |
| Industrial and Machinery |
| Packaging |
| Other End-user Industries |
By Source Type
| Virgin PET |
| Recycled PET |
By Geography
| Argentina |
| Brazil |
| Rest of South America |
| By End-User Industry | Automotive |
| Building and Construction | |
| Electrical and Electronics | |
| Industrial and Machinery | |
| Packaging | |
| Other End-user Industries | |
| By Source Type | Virgin PET |
| Recycled PET | |
| By Geography | Argentina |
| Brazil | |
| Rest of South America |


Market Definition
- End-user Industry - Building & Construction, Packaging, Automotive, Industrial Machinery, Electrical & Electronics, and Others are the end-user industries considered under the polyethylene terephthalate market.
- Resin - Under the scope of the study, virgin polyethylene terephthalate resin in primary forms such as liquid, powder, pellet, etc. are considered.
| Keyword | Definition |
|---|---|
| Acetal | This is a rigid material that has a slippery surface. It can easily withstand wear and tear in abusive work environments. This polymer is used for building applications such as gears, bearings, valve components, etc. |
| Acrylic | This synthetic resin is a derivative of acrylic acid. It forms a smooth surface and is mainly used for various indoor applications. The material can also be used for outdoor applications with a special formulation. |
| Cast film | A cast film is made by depositing a layer of plastic onto a surface then solidifying and removing the film from that surface. The plastic layer can be in molten form, in a solution, or in dispersion. |
| Colorants & Pigments | Colorants & Pigments are additives used to change the color of the plastic. They can be a powder or a resin/color premix. |
| Composite material | A composite material is a material that is produced from two or more constituent materials. These constituent materials have dissimilar chemical or physical properties and are merged to create a material with properties unlike the individual elements. |
| Degree of Polymerization (DP) | The number of monomeric units in a macromolecule, polymer, or oligomer molecule is referred to as the degree of polymerization or DP. Plastics with useful physical properties often have DPs in the thousands. |
| Dispersion | To create a suspension or solution of material in another substance, fine, agglomerated solid particles of one substance are dispersed in a liquid or another substance to form a dispersion. |
| Fiberglass | Fiberglass-reinforced plastic is a material made up of glass fibers embedded in a resin matrix. These materials have high tensile and impact strength. Handrails and platforms are two examples of lightweight structural applications that use standard fiberglass. |
| Fiber-reinforced polymer (FRP) | Fiber-reinforced polymer is a composite material made of a polymer matrix reinforced with fibers. The fibers are usually glass, carbon, aramid, or basalt. |
| Flake | This is a dry, peeled-off piece, usually with an uneven surface, and is the base of cellulosic plastics. |
| Fluoropolymers | This is a fluorocarbon-based polymer with multiple carbon-fluorine bonds. It is characterized by high resistance to solvents, acids, and bases. These materials are tough yet easy to machine. Some of the popular fluoropolymers are PTFE, ETFE, PVDF, PVF, etc. |
| Kevlar | Kevlar is the commonly referred name for aramid fiber, which was initially a Dupont brand for aramid fiber. Any group of lightweight, heat-resistant, solid, synthetic, aromatic polyamide materials that are fashioned into fibers, filaments, or sheets is called aramid fiber. They are classified into Para-aramid and Meta-aramid. |
| Laminate | A structure or surface composed of sequential layers of material bonded under pressure and heat to build up to the desired shape and width. |
| Nylon | They are synthetic fiber-forming polyamides formed into yarns and monofilaments. These fibers possess excellent tensile strength, durability, and elasticity. They have high melting points and can resist chemicals and various liquids. |
| PET preform | A preform is an intermediate product that is subsequently blown into a polyethylene terephthalate (PET) bottle or a container. |
| Plastic compounding | Compounding consists of preparing plastic formulations by mixing and/or blending polymers and additives in a molten state to achieve the desired characteristics. These blends are automatically dosed with fixed setpoints usually through feeders/hoppers. |
| Plastic pellets | Plastic pellets, also known as pre-production pellets or nurdles, are the building blocks for nearly every product made of plastic. |
| Polymerization | It is a chemical reaction of several monomer molecules to form polymer chains that form stable covalent bonds. |
| Styrene Copolymers | A copolymer is a polymer derived from more than one species of monomer, and a styrene copolymer is a chain of polymers consisting of styrene and acrylate. |
| Thermoplastics | Thermoplastics are defined as polymers that become soft material when it is heated and becomes hard when it is cooled. Thermoplastics have wide-ranging properties and can be remolded and recycled without affecting their physical properties. |
| Virgin Plastic | It is a basic form of plastic that has never been used, processed, or developed. It may be considered more valuable than recycled or already used materials. |


Research Methodology
Mordor Intelligence follows a four-step methodology in all our reports.
- Step-1: Identify Key Variables: The quantifiable key variables (industry and extraneous) pertaining to the specific product segment and country are selected from a group of relevant variables & factors based on desk research & literature review; along with primary expert inputs. These variables are further confirmed through regression modeling (wherever required).
- Step-2: Build a Market Model: In order to build a robust forecasting methodology, the variables and factors identified in Step-1 are tested against available historical market numbers. Through an iterative process, the variables required for market forecast are set and the model is built on the basis of these variables.
- Step-3: Validate and Finalize: In this important step, all market numbers, variables and analyst calls are validated through an extensive network of primary research experts from the market studied. The respondents are selected across levels and functions to generate a holistic picture of the market studied.
- Step-4: Research Outputs: Syndicated Reports, Custom Consulting Assignments, Databases & Subscription Platforms


