Recyclate PET Market Size and Share
Market Overview
| Study Period | 2021 - 2031 |
|---|---|
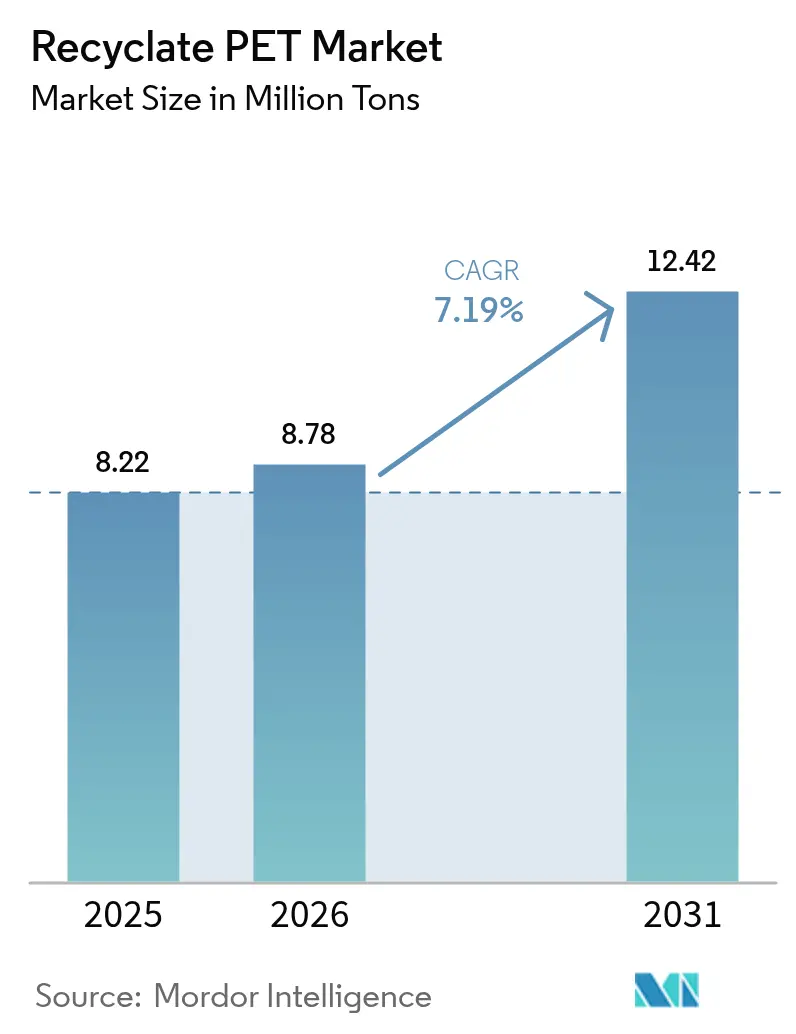
| Market Volume (2026) | 8.78 Million tons |
| Market Volume (2031) | 12.42 Million tons |
| Growth Rate (2026 - 2031) | 7.19% CAGR |
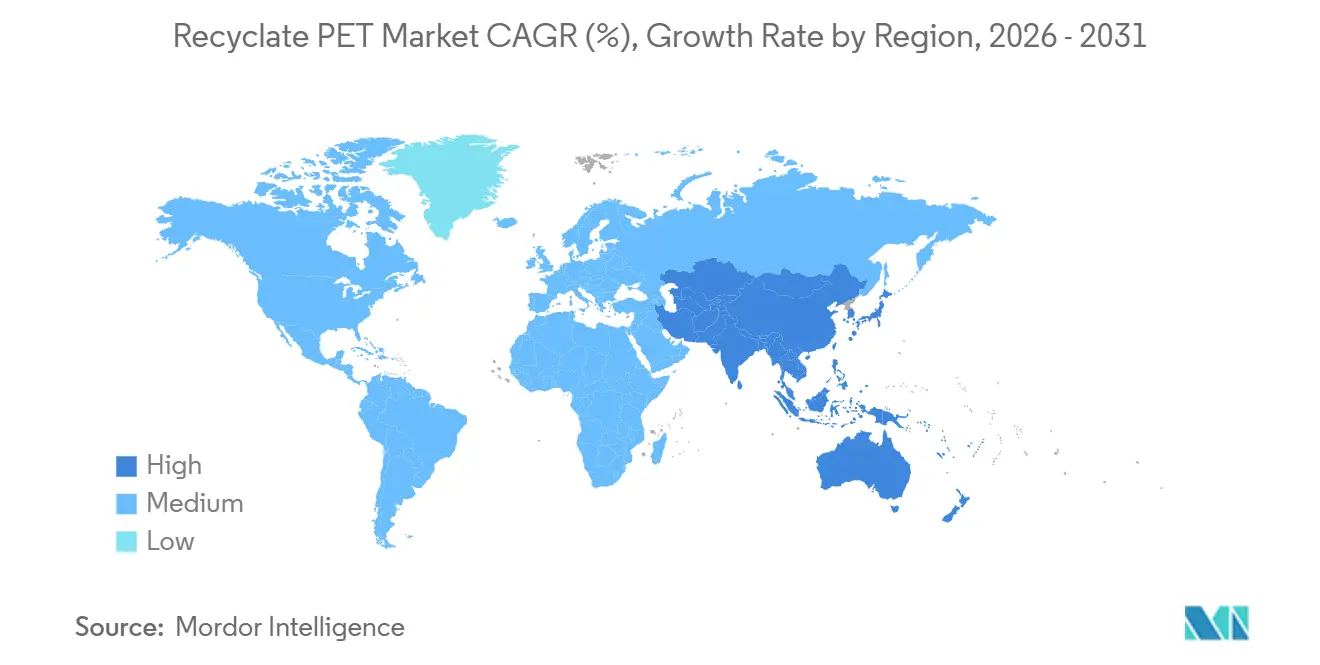
| Fastest Growing Market | Asia Pacific |
| Largest Market | Asia Pacific |
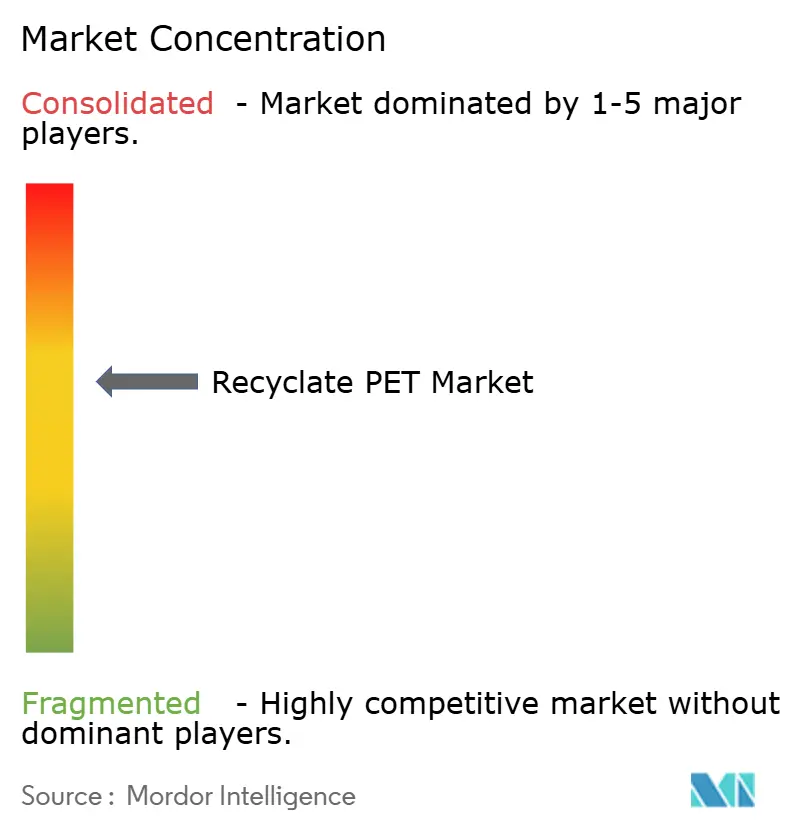
| Market Concentration | Medium |
Major Players *Disclaimer: Major Players sorted in no particular order Image © Mordor Intelligence. Reuse requires attribution under CC BY 4.0. | |
Recyclate PET Market Analysis by Mordor Intelligence
The Recyclate PET Market size is expected to increase from 8.22 million tons in 2025 to 8.78 million tons in 2026 and reach 12.42 million tons by 2031, growing at a CAGR of 7.19% over 2026-2031. Brand procurement pledges, binding recycled-content mandates, and rising crude-oil volatility together tighten demand for bottle-grade flakes and chips, pushing converters to lock in long-term supply contracts that de-risk recycling projects. Depolymerization plants now monetize colored, multilayer, and fiber-contaminated streams once destined for landfill, expanding the feedstock pool and enhancing circularity premiums. Asian textile demand, especially for recycled staple fiber, accelerates volume growth, while digital passport rules in Europe elevate traceability requirements and reward recyclers able to furnish granular provenance data. At the same time, periodic virgin-resin oversupply from new petrochemical complexes in the Middle East and China compresses mechanical-recycling margins whenever Brent crude slides below USD 70 per barrel. Collection deficits in emerging economies further limit bale availability, shifting strategic focus toward integrated waste-management models and public–private funding of municipal recovery systems.
Key Report Takeaways
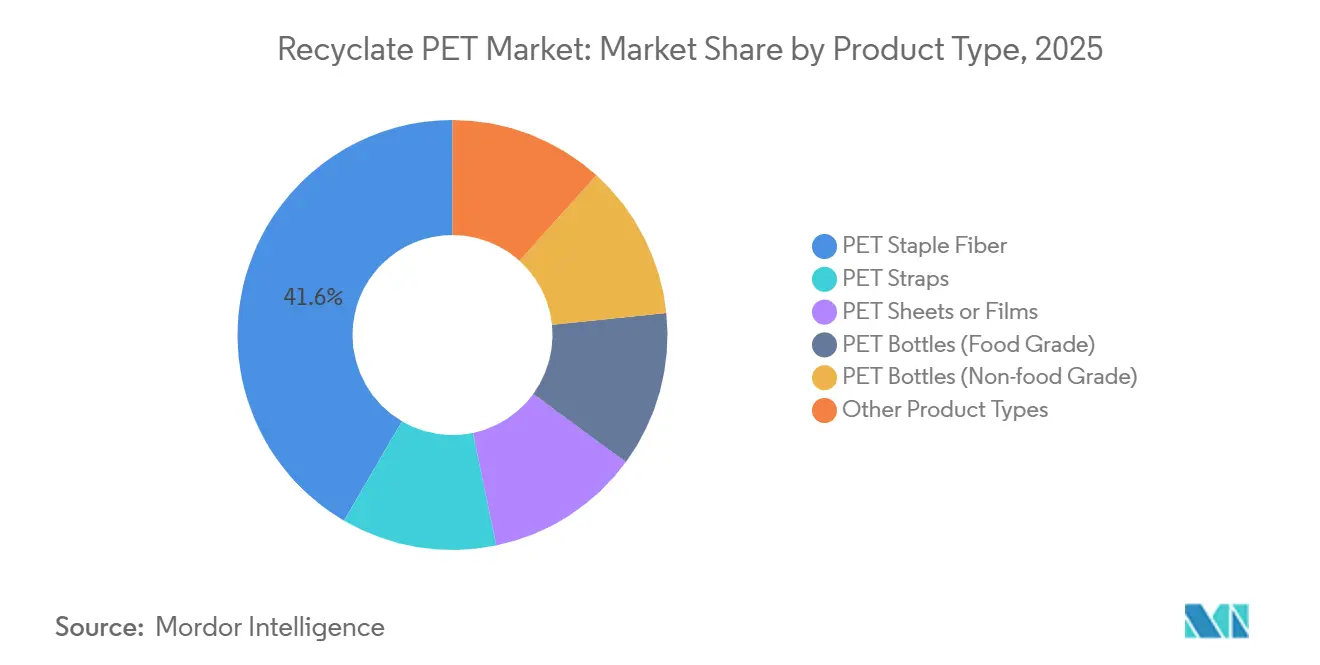
- By product type, PET staple fiber accounted for 41.58% of the 2025 tonnage and is projected to expand at a 7.44% CAGR through 2031, outperforming all other categories.
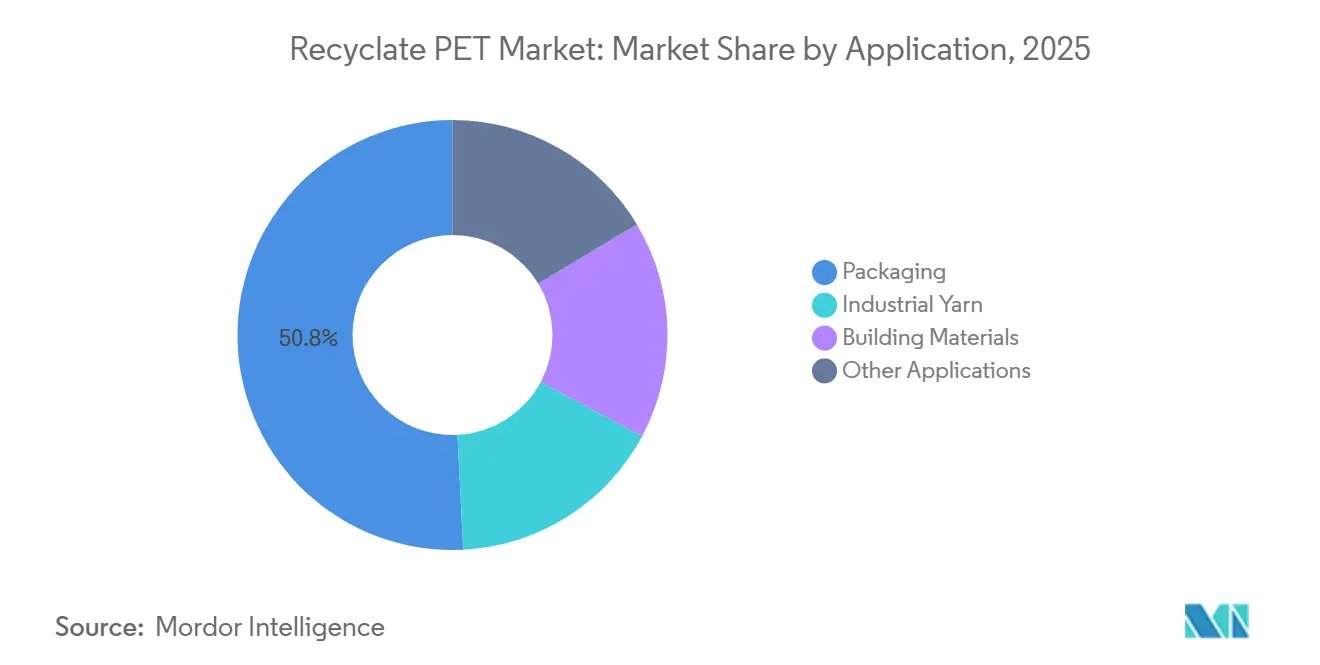
- By application, packaging held 50.79% of the 2025 volume and is projected to grow at a 7.57% CAGR, maintaining its leadership position.
- By geography, Asia-Pacific contributed 43.36% of the 2025 global volume and is forecast to advance at an 8.38% CAGR, the fastest regional pace.
Note: Market size and forecast figures in this report are generated using Mordor Intelligence’s proprietary estimation framework, updated with the latest available data and insights as of 2026.
Global Recyclate PET Market Trends and Insights
Drivers Impact Analysis*
| Drivers | (~) % Impact on CAGR Forecast | Geographic Relevance | Impact Timeline |
|---|---|---|---|
| Stricter recycled-content mandates (EU SUPD, PPWR, US state EPR) | +2.1% | Europe, North America, selective APAC markets | Medium term (2-4 years) |
| Brand-led 2030 net-zero and rPET procurement targets | +1.8% | Global, concentrated in Europe and North America | Medium term (2-4 years) |
| Cost parity of rPET chips vs. virgin PET in high-oil scenarios | +1.3% | Global, most pronounced in Asia-Pacific and sMiddle East | Short term (≤ 2 years) |
| Scale-up of depolymerization unlocking food-grade colored rPET | +1.2% | North America and Europe core, spillover to APAC | Long term (≥ 4 years) |
| Emerging digital-passport regulations raising traceability premiums | +0.9% | Europe initially, expanding to North America by 2028 | Long term (≥ 4 years) |
| Source: Mordor Intelligence | |||
Stricter Recycled-Content Mandates Drive Structural Demand
The European Packaging and Packaging Waste Regulation mandates that beverage bottles must contain recycled material. Fines for non-compliance can reach up to a company's revenue, effectively establishing a minimum demand for food-grade recyclate. In the U.S., several states, spearheaded by California, are echoing this initiative, setting minimum recycled content thresholds[1]California Legislative Information, “SB 54 Plastic Pollution Producer Responsibility Act,” LEGINFO.LEGISLATURE.CA.GOV. This move particularly benefits converters with expansive multistate collection networks. Furthermore, regulators are tightening the definition of "recycled" to only include post-consumer streams, shifting investment focus towards curbside systems. With verification protocols like ISO 14021 and the introduction of digital passports, the standards for audits are rising. In response, proactive players are adopting blockchain technology for bale tracing. Collectively, these strategies stabilize the recyclate PET market, shielding it from the volatility of virgin-price fluctuations and ensuring consistent demand.
Brand Commitments Anchor Long-Term Offtake
By 2030, Coca-Cola's ambition for recycled content translates to an annual demand of rPET globally. Meanwhile, PepsiCo's European initiative contributes to the tally. Unilever, having swiftly achieved its recycled-plastic target, has now set an ambitious goal for 2030[2]PepsiCo, “PepsiCo Positive Sustainability Report,” PEPSICO.COM. These brands bolster their commitments through multiyear contracts, adjusted for inflation, which empower recyclers to obtain debt financing for new production lines. A testament to this shift in procurement dynamics is Danone's food-grade offtake agreement. While major players secure their positions, smaller mechanical recyclers find it challenging to compete for bales outside these established frameworks.
Cost Parity in High-Oil Scenarios Tilts Economics
When Brent crude prices stay above a certain threshold, the costs of paraxylene and PTA push virgin PET prices close to those of food-grade flakes, eliminating the usual discount that has historically limited the uptake of recycled materials. In early 2025, Europe witnessed the virgin-to-recycled price spread shrink to a margin easily influenced by logistics. This shift underscores that, in today's market, regulations and corporate commitments are the main drivers of demand, overshadowing cost considerations. However, when crude prices fall below a certain level, it results in a significant discount on virgin materials. This price drop has led some recyclers in Europe to temporarily halt operations. On the other hand, chemical recyclers, who command a premium for their output, find themselves somewhat shielded from these fluctuations.
Depolymerization Unlocks Previously Unrecyclable Streams
In 2024, Eastman's Kingsport methanolysis unit achieved commercial scale, transforming mixed fibers and colored bottles into a virgin-equivalent polymer approved for use. Loop Industries is set to launch its glycolysis plant in Normandy in 2026, focusing on cosmetics packaging through supply agreements. These advancements expand the accessible waste pool of post-consumer PET. This not only alleviates the demand for high-quality, clear bales but also diversifies the feedstock base for the recyclate PET industry, even with a price premium.
Restraints Impact Analysis*
| Restraints | (~) % Impact on CAGR Forecast | Geographic Relevance | Impact Timeline |
|---|---|---|---|
| PET bottle collection gaps in emerging economies | -1.4% | Asia-Pacific (ex-Japan, South Korea), Latin America, Middle East and Africa | Medium term (2-4 years) |
| Virgin-PET oversupply cycles depressing rPET margins | -0.9% | Global, most acute in Middle East and Asia-Pacific | Short term (≤ 2 years) |
| High CAPEX for advanced recycling and food-grade compliance | -0.7% | Global, concentrated in North America and Europe | Long term (≥ 4 years) |
| Source: Mordor Intelligence | |||
Collection Infrastructure Gaps Constrain Feedstock
In 2025, India managed to collect only a portion of its PET bottles, leaving a significant amount unrecovered. Indonesia's collection rate was moderate, while Nigeria's was considerably low. This shortfall has left installed recycling lines struggling for a consistent input. In response, major brands are now co-investing in municipal systems. Coca-Cola has set its sights on establishing collection points in Lagos and Abuja by 2027. Meanwhile, PepsiCo is channeling funds into material-recovery facilities in Indonesia, targeting an improved national collection rate by 2028. However, until these initiatives expand, the limited flow of bales will hinder near-term growth, especially for independent recyclers who lack the resources to develop their own networks.
Virgin PET Oversupply Pressures Margins
Between 2024 and 2026, Saudi Arabia, the United Arab Emirates, and China saw the introduction of new virgin capacity, capitalizing on low-cost naphtha and ethane. As crude prices dipped in late 2024, the price of delivered virgin resin in Europe dropped, making it lower than that of food-grade flake and leading many recyclers to temporarily scale back operations. Spectrum recyclers, without the safety net of regulatory mandates or locked-in contracts, find themselves vulnerable to these cyclical compressions, which can erode quarterly margins.
*Our forecasts treat driver/restraint impacts as directional, not additive. The impact forecasts reflect baseline growth, mix effects, and variable interactions.
Segment Analysis
By Product Type: Fiber Momentum Reinforces Volume Leadership
PET staple fiber held 41.58% of 2025 volume on the back of Asian apparel and home-textile demand, and it is set to grow at 7.44% annually through 2031. This momentum positions it as the dominant player in the recyclate PET market over the forecast period. In contrast, PET bottles, specifically food-grade ones, are emerging as the fastest-growing sub-segment. Their growth is bolstered by beverage-bottle mandates in Europe and various U.S. states, alongside advancements in chemical recycling that now accommodate opaque and multilayer feedstock. While PET sheets and films see gradual increases—thanks to a shift by European retailers from polystyrene to circular thermoforms—PET straps, though niche, are making inroads in e-commerce fulfillment as companies seek to reduce virgin plastic use in logistics.
Regulatory frameworks and food-contact guidelines bolster the demand for bottle-grade PET: The EFSA and FDA have set clear standards for mechanical and chemical process validation, alleviating uncertainties for developers. While non-food bottles, such as those for detergents and personal care, face less stringent compliance, they still benefit from brand commitments, exemplified by targets for recycled content in Europe. Other categories, ranging from engineering-grade pellets to films for electronics, currently occupy a small market share but stand to gain momentum as depolymerization plants produce virgin-equivalent resin that meets stringent mechanical standards.


By Application: Packaging Rules the Demand Curve
Packaging represented 50.79% of 2025 volume and is advancing at a 7.57% CAGR. This growth is bolstered by recycled-content mandates in the EU and U.S., ensuring consistent demand even during downturns in virgin prices. Such dominance highlights why packaging commands the largest share of the recyclate PET market and continues to attract the majority of new capacity additions. Industrial yarns, used in applications like seat belts, tire cords, and geotextiles, are set to grow further. This growth is driven by the auto industry's push for lightweighting and a shift away from nylon. Building-material applications are gaining traction, especially with endorsements from green-building labels like LEED. Notably, U.S. decking manufacturers are now incorporating high levels of post-consumer PET into their products.
Regional trends show a divergence: Europe and North America predominantly focus on packaging, while the Asia-Pacific region sees a greater emphasis on textiles and construction. This is largely attributed to the region's population and infrastructure expansion. Although specialty electronics and medical devices currently occupy a niche space, they stand poised for growth. This is due to their ability to utilize depolymerized feedstock, which meets stringent purity and performance standards—something mechanical flakes struggle to achieve.
Geography Analysis
Asia-Pacific accounted for 43.36% of the 2025 volume and is forecast to grow at 8.38% annually through 2031. China's ambitious target for bottle-recycled content by 2028 has prompted capacity expansions from players like Far Eastern New Century. Meanwhile, India, enforcing a threshold from 2025, has seen Reliance and Ganesha Ecosphere invest in substantial capacity. Despite Indonesia and Vietnam lagging with collection rates, brand-funded deposit-return schemes are set to double these rates by 2028. Japan and South Korea, boasting high collection rates, are shifting focus to chemical recycling, with Mitsubishi Chemical and SK Chemicals set to commission glycolysis plants in 2026–2027.
Europe, capturing a significant portion of the global 2025 volume, is projected to expand steadily. Thanks to mature deposit schemes achieving high collection rates and the presence of vertically integrated players like Veolia and Suez, Germany, the United Kingdom, France, and Italy collectively utilize a major share of the region's rPET. In the Nordics, pilots of digital deposits using QR codes have already surpassed impressive return rates. With backing from financing initiatives, Turkey and Russia are establishing new sortation and wash plants, targeting improved collection rates by 2028. The competition landscape is shifting, with mechanical recyclers driving up prices for bale access, while chemical recyclers are honing in on streams that conventional lines overlook.
North America, accounting for a notable share of the 2025 volume, is witnessing steady growth. States like California, New York, Washington, and Oregon are spearheading the demand, setting ambitious thresholds for single-use plastics by 2030. The U.S. is home to significant projects, including Eastman's flagship methanolysis plant and Loop's initiative, both complementing the efforts of mechanical giants Plastipak and PolyQuest. Canada's Federal Plastics Registry is evolving into mandatory thresholds by 2027, projecting incremental annual demand. In Mexico, collection rates are on the rise, thanks to sortation upgrades backed by Alpek. While South America and the Middle-East and Africa account for a smaller share of global demand, they're making strides with development-bank-funded reverse-vending and EPR programs, aiming to elevate regional collection rates by 2028.

Competitive Landscape
The global recyclate PET market is moderately consolidated. Strategic emphasis swings from megaton capacity announcements toward guaranteed offtake and digital traceability. Mechanical recyclers now invest in near-infrared and AI color sorters to push contamination below 50 ppm, while chemical players license depolymerization IP to spread capital risk. Waste-management operators such as Veolia, Suez, and Biffa increasingly bypass independent processors by moving downstream, threatening small recyclers unless they forge feedstock-sharing alliances or specialize in certified, high-viscosity grades. As digital passport rules loom, traceability becomes a margin lever: certified flakes already earn premiums in European spot markets, reinforcing the divide between integrated majors and resource-constrained independents.
Recyclate PET Industry Leaders
Indorama Ventures Public Company Limited
Far Eastern New Century Corporation
Alpla Group
Alpek S.A.B. de C.V.
Plastipak Holdings Inc.
- *Disclaimer: Major Players sorted in no particular order

Recent Industry Developments
- February 2025: Loop Industries and SK Chemicals broke ground on a 70,000-ton depolymerization facility in Ulsan, backed by USD 150 million equity.
- January 2025: Indorama Ventures has committed EUR 120 million to expand its mechanical capacity in Verdun, France, by 50,000 tons, incorporating AI optical sorters.
- December 2024: Veolia has strengthened its position in the recycling market by acquiring a 60% stake in PET Recycling Team for CHF 80 million. This strategic investment expands Veolia's Swiss operations, adding 40,000 tons of food-grade recycling capacity to its portfolio.


Global Recyclate PET Market Report Scope
Recyclate PET is defined as a sustainable, reprocessed thermoplastic material derived from post-consumer or post-industrial Polyethylene Terephthalate (PET) waste, such as plastic bottles, containers, and packaging. It is produced through processes like sorting, washing, and grinding, which convert the waste into high-quality flakes or pellets. These can be further purified and re-polymerized using Solid State Polymerization, offering a versatile, eco-friendly, and cost-effective alternative to virgin PET, often with lower greenhouse gas emissions.
The recyclate PET market is segmented by product type, application, and geography. By product type, the market is segmented into PET Staple Fiber, PET Straps, PET Sheets or Films, PET Bottles (Food Grade), PET Bottles (Non-food Grade), and Other Product Types. By application, the market is segmented into Packaging, Industrial Yarn, Building Materials, and Other Applications. The report also covers the market size and forecasts for the market in 26 countries across the major regions. For each segment, the market sizing and forecasts have been done based on volume (Tons).
| PET Staple Fiber |
| PET Straps |
| PET Sheets or Films |
| PET Bottles (Food Grade) |
| PET Bottles (Non-food Grade) |
| Other Product Types |
| Packaging |
| Industrial Yarn |
| Building Materials |
| Other Applications |
| Asia-Pacific | China |
| India | |
| Japan | |
| South Korea | |
| Malaysia | |
| Thailand | |
| Indonesia | |
| Vietnam | |
| Rest of Asia-Pacific | |
| North America | United States |
| Canada | |
| Mexico | |
| Europe | Germany |
| United Kingdom | |
| France | |
| Italy | |
| Spain | |
| NORDIC Countries | |
| Turkey | |
| Russia | |
| Rest of Europe | |
| South America | Brazil |
| Argentina | |
| Colombia | |
| Rest of South America | |
| Middle-East and Africa | Saudi Arabia |
| Qatar | |
| United Arab Emirates | |
| Nigeria | |
| Egypt | |
| South Africa | |
| Rest of Middle-East and Africa |
| By Product Type | PET Staple Fiber | |
| PET Straps | ||
| PET Sheets or Films | ||
| PET Bottles (Food Grade) | ||
| PET Bottles (Non-food Grade) | ||
| Other Product Types | ||
| By Application | Packaging | |
| Industrial Yarn | ||
| Building Materials | ||
| Other Applications | ||
| By Geography | Asia-Pacific | China |
| India | ||
| Japan | ||
| South Korea | ||
| Malaysia | ||
| Thailand | ||
| Indonesia | ||
| Vietnam | ||
| Rest of Asia-Pacific | ||
| North America | United States | |
| Canada | ||
| Mexico | ||
| Europe | Germany | |
| United Kingdom | ||
| France | ||
| Italy | ||
| Spain | ||
| NORDIC Countries | ||
| Turkey | ||
| Russia | ||
| Rest of Europe | ||
| South America | Brazil | |
| Argentina | ||
| Colombia | ||
| Rest of South America | ||
| Middle-East and Africa | Saudi Arabia | |
| Qatar | ||
| United Arab Emirates | ||
| Nigeria | ||
| Egypt | ||
| South Africa | ||
| Rest of Middle-East and Africa | ||


Key Questions Answered in the Report
What is the projected volume of recyclate PET by 2031?
The recyclate PET market size is forecast to reach 12.42 million tons by 2031, reflecting a 7.19% CAGR from 8.78 million tons in 2026.
How do recycled-content mandates affect supply contracts?
Binding quotas in Europe and several U.S. states push brands to sign multiyear, fixed-volume offtake deals, giving recyclers revenue visibility to finance new capacity.
Which segment currently leads demand?
Packaging holds the largest share at 50.79% of 2025 volume, buoyed by beverage-bottle mandates and rising thermoform tray adoption.
Why is depolymerization gaining traction?
Chemical recycling converts mixed or colored PET into virgin-equivalent resin, expanding the addressable waste pool to streams, mechanical lines reject, and commanding a price premium.
Which region is growing fastest?
Asia-Pacific is expanding at 8.38% CAGR through 2031, powered by China’s and India’s recycled-content requirements and burgeoning textile demand.
Page last updated on:


