Market Overview
| Study Period | 2021 - 2031 |
|---|---|
| Forecast Data Period | 2026 - 2031 |
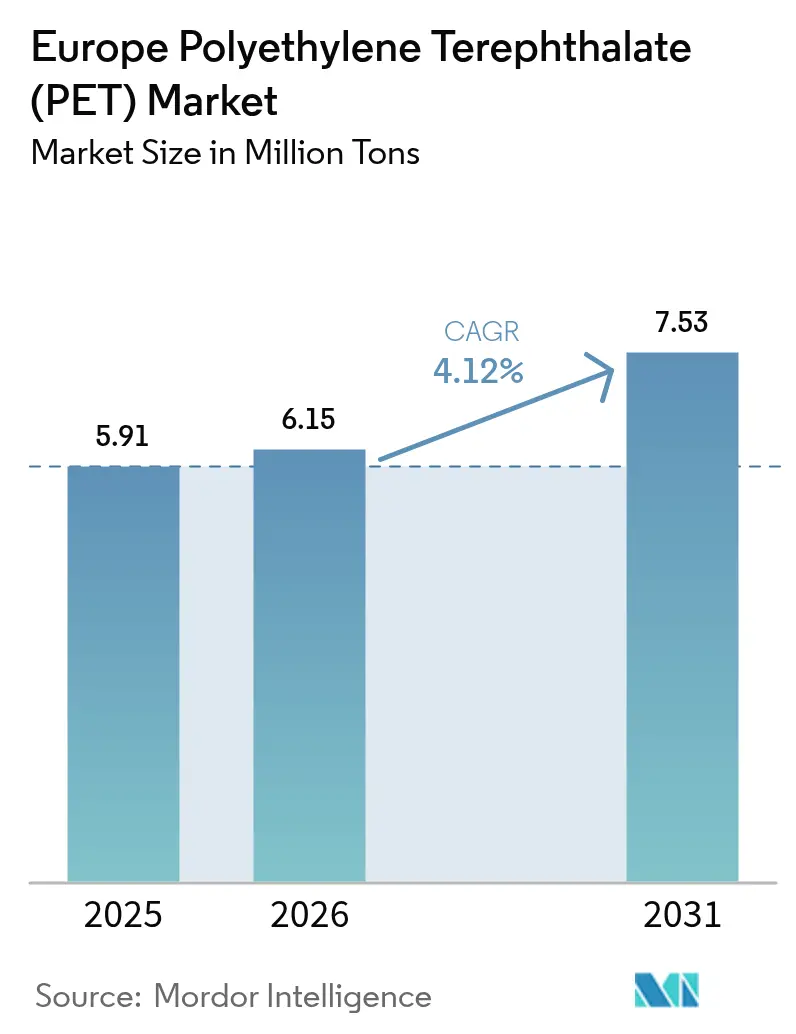
| Base Year Market Size (2025) | 5.91 Million tons |
| Market Volume (2026) | 6.15 Million tons |
| Market Volume (2031) | 7.53 Million tons |
| Growth Rate (2026 - 2031) | 4.12% CAGR |
| Market Concentration | Medium |
Major Players *Disclaimer: Major Players sorted in no particular order Image © Mordor Intelligence. Reuse requires attribution under CC BY 4.0. | |
Europe Polyethylene Terephthalate (PET) Market Analysis by Mordor Intelligence
The European Polyethylene Terephthalate Market size is expected to increase from 5.91 million tons in 2025 to 6.15 million tons in 2026 and reach 7.53 million tons by 2031, growing at a CAGR of 4.12% over 2026-2031. Virgin resin remains dominant, but mandates for recycled content in beverage bottles and a broader deposit-return-scheme coverage are altering procurement decisions. This evolution heightens the demand's responsiveness to collection system efficiencies. Investments in mechanical and chemical recycling, which became operational in 2024 and 2025, have narrowed the price gap between virgin resin and recycled PET (rPET). However, policy incentives for biorecycled plastics have alleviated any remaining cost premium. Even as energy prices have kept European production costs high since 2021, imports from Turkey, Egypt, and Vietnam are squeezing regional margins. Additionally, global beverage brands' lightweighting strategies are changing the resin demand dynamics. These strategies benefit converters skilled in precision molding but simultaneously hinder overall packaging volume growth.
Key Report Takeaways
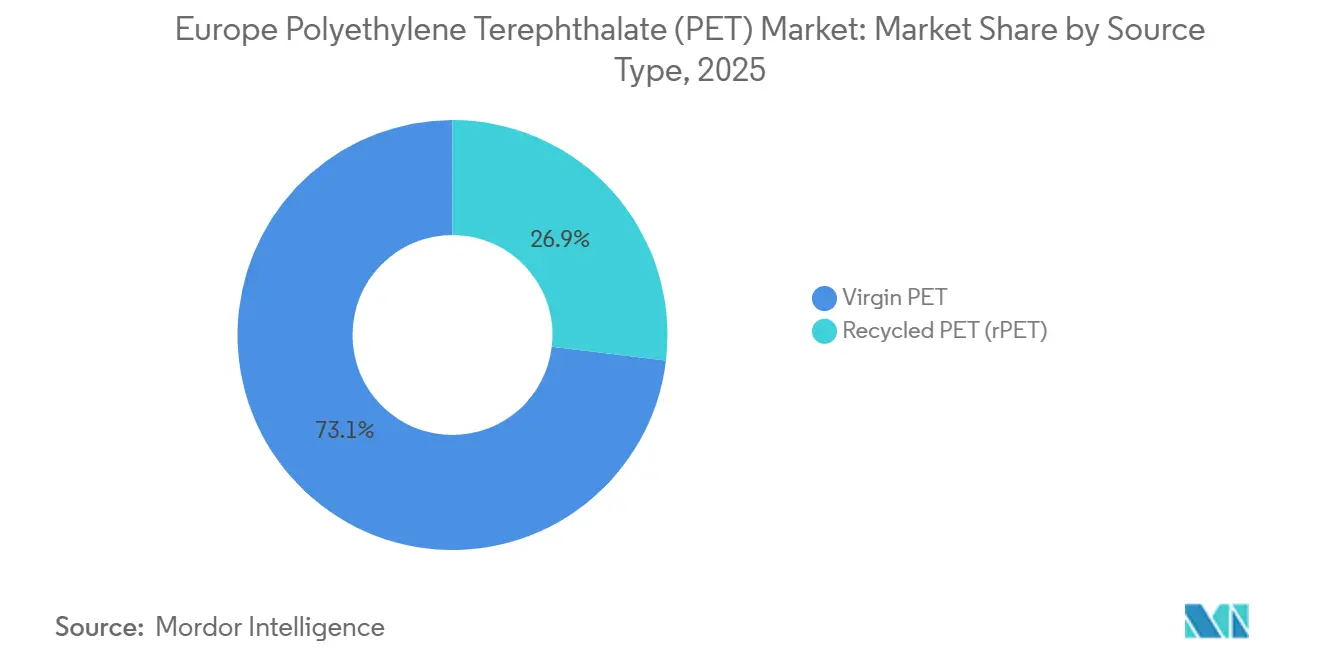
- By source type, virgin PET accounted for 73.11% of the European polyethylene terephthalate (PET) market size in 2025, yet recycled PET is advancing at a 5.73% CAGR over 2026-2031.
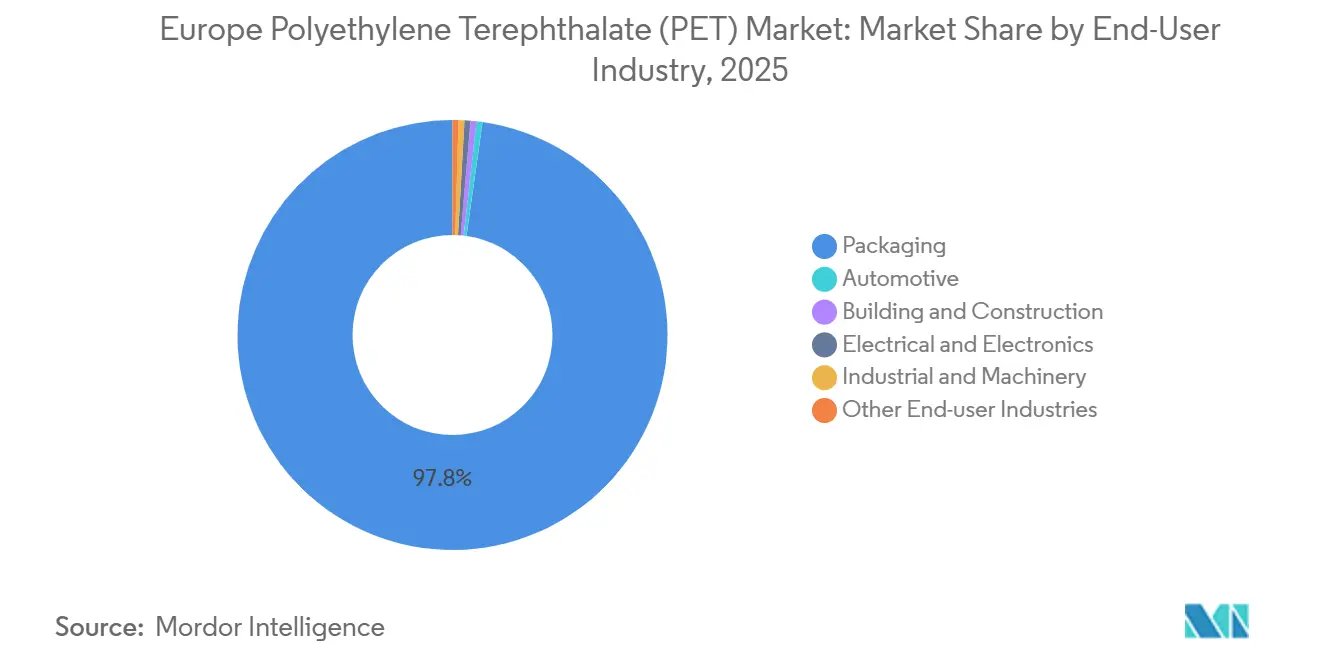
- By end-user industry, packaging dominated with a 97.78% share in 2025; electrical and electronics is forecast to expand at a 4.55% CAGR from 2026 to 2031.
- By geography, the rest of Europe commanded a 37.22% share of the European Polyethylene Terephthalate (PET) market size in 2025, while Russia is the fastest-growing territory at a 4.48% CAGR from 2026 to 2031.
Note: Market size and forecast figures in this report are generated using Mordor Intelligence’s proprietary estimation framework, updated with the latest available data and insights as of 2026.
Europe Polyethylene Terephthalate (PET) Market Trends and Insights
Drivers Impact Analysis*
| Drivers | (~) % Impact on CAGR Forecast | Geographic Relevance | Impact Timeline |
|---|---|---|---|
| EU Single-Use Plastics Directive mandates 25% rPET in beverage bottles | +1.2% | EU-27, with spillover to UK and Switzerland | Medium term (2-4 years) |
| Deposit-Return-Scheme expansion boosts PET bale quality and volumes | +0.9% | Germany (mature), UK and France (emerging), Ireland and Portugal (recent) | Long term (≥ 4 years) |
| Lightweighting shift from glass/metal to PET in alcoholic and dairy drinks | +0.7% | Western Europe (France, Italy, Spain), with adoption in Central Europe | Medium term (2-4 years) |
| Virgin-vs-rPET price spread incentivizes converter substitution | +0.5% | EU-27, particularly Netherlands, Belgium, and Germany with high converter density | Short term (≤ 2 years) |
| Chemical-recycling build-out secures food-grade rPET supply | +0.8% | France (Carbios, Loop), Germany (Loop-BASF), with technology licensing across EU | Long term (≥ 4 years) |
| Source: Mordor Intelligence | |||
EU Single-Use Plastics Directive Mandates 25% rPET in Beverage Bottles
Brand owners now face a mandate, as the directive transforms recycled content from a cost consideration into a compliance requirement. This shift compels them to secure multi-year offtake contracts, which reduces spot-market liquidity. Furthermore, until 2027, the directive provides a tariff-equivalent advantage for EU recyclers, as rPET processed outside the EU does not contribute to compliance targets. This policy channels investments into European facilities[1]European Commission, “Circular Economy Package,” EC.europa.eu. In February 2026, Loop Industries strategically selected BASF’s Schwarzheide site, highlighting the directive's impact.
Deposit-Return-Scheme Expansion Boosts PET Bale Quality and Volumes
Germany's high return rate ensures bales remain largely uncontaminated, facilitating direct bottle-to-bottle recycling with minimal reprocessing. In its inaugural operational year, Ireland's impressive container deposit figures underscore the impact of well-calibrated deposit values on consumer choices. On the other hand, the United Kingdom's postponement to 2027 keeps it dependent on curbside streams, which face contamination issues, restricting the supply of food-grade rPET.
Lightweighting Shift from Glass or Metal to PET in Alcoholic and Dairy Drinks
Advancements in molding technology have allowed Coca-Cola to maintain the integrity of its bottles, and Evian has achieved the same with its formats, even at lower gauges[2]Coca-Cola Company, “Lightweighting Initiatives,” Coca-colacompany.com. Inspired by these innovations, wine and spirits producers are adopting this approach to reduce freight fuel expenses and minimize breakage costs. Meanwhile, dairy processors are leveraging the oxygen-barrier properties of PET to extend the shelf life of their milk. As demand for packaged drinks continues to increase, the moderation in volume growth can be attributed to the reduced resin usage per unit.
Virgin-versus-rPET Price Spread Incentivizes Converter Substitution
In 2024, food-grade rPET commanded a premium over virgin resin. However, converters made a strategic shift, prioritizing regulatory compliance over cost. Expansions in mechanical recycling across Portugal, France, and Italy reduced the price spread, but energy-intensive washing steps maintained a positive differential. Furthermore, France's subsidy for biorecycled plastics further narrowed the price gap, reinforcing demand stability for recycled content.
Restraints Impact Analysis*
| Restraints | (~) % Impact on CAGR Forecast | Geographic Relevance | Impact Timeline |
|---|---|---|---|
| Low-cost PET imports from Turkey, Egypt, and Vietnam squeeze EU producer margins | -0.6% | EU-27, particularly Italy, Belgium, and Netherlands (import hubs) | Short term (≤ 2 years) |
| Elevated EU energy costs erode competitiveness | -0.4% | Germany, Netherlands, Belgium (energy-intensive production clusters) | Medium term (2-4 years) |
| NGO anti-plastic campaigns drive aluminum substitution in beverages | -0.3% | Western Europe (UK, France, Germany) with high environmental awareness | Medium term (2-4 years) |
| Source: Mordor Intelligence | |||
Low-Cost PET Imports from Turkey, Egypt, and Vietnam Squeeze EU Producer Margins
In 2025, Turkey was the largest external supplier of PET to the European Union. The government in Ankara initiated a safeguard investigation when its domestic producers experienced margin compression due to cheaper shipments from Vietnam and Egypt. European manufacturers, who faced higher energy and feedstock-related costs, saw their profit margins narrow. This prompted Indorama Ventures to conduct a review of its Rotterdam site operations in 2024.
Elevated EU Energy Costs Erode Competitiveness
In 2024, a force majeure event at Alpek's Wilton plant highlighted the industry's operational vulnerabilities. Concurrently, natural gas prices, remaining substantially elevated compared to 2020, have escalated energy input costs for regional PET polymerization. In light of these challenges, producers are increasingly turning to recycling, enticed by its reduced power costs per ton and a more stable regulatory landscape.
*Our forecasts treat driver/restraint impacts as directional, not additive. The impact forecasts reflect baseline growth, mix effects, and variable interactions.
Segment Analysis
By Source Type: Regulatory Mandates Tilt Growth Toward Recycled Feedstock
From 2026 to 2031, recycled PET is set to outpace its virgin counterpart, growing at a projected CAGR of 5.73% and steadily expanding its foothold in the European PET market. In 2025, Starlinger's recoSTAR PET art, having secured EFSA approval, adeptly navigated tighter mass-balance regulations. This strategic move not only alleviated compliance hurdles but also drew in fresh investments. While virgin grades, commanding 73.11% of the market (in 2025), remain favored by industries prioritizing consistent melt-flow properties, the ascent of chemical recycling promises to tap into contaminated material streams, diversifying the supply.
Recent mechanical expansions in Portugal, France, and Italy are focusing on clear-bottle loops. In contrast, chemical depolymerization is tackling challenges from opaque and textile waste. To bolster these innovative methods, France has rolled out a cash bonus for biorecycled plastics, effectively mitigating their operational expenses. This initiative highlights a dual recycled-content strategy, customized for different contamination levels. As regulations become more stringent, integrated players proficient in both mechanical and chemical processes gain enhanced sourcing and compliance flexibility, strengthening their competitive edge in the European PET arena.


By End-User Industry: Packaging Dominance Masks Niche Growth in Electrification
In 2025, packaging took the lead in the European Polyethylene Terephthalate (PET) market, securing a commanding 97.78% share. This stronghold highlights the central role of beverage bottling and the heightened regulatory focus on single-use plastics. Innovations, such as the lightweight 13.5 g CSD bottles, are refining resin usage per liter. Although this advancement limits potential volume boosts, unit sales are on the upswing. The electrical and electronics sector, driven by uses such as electric-vehicle battery insulation and high-heat connectors, is poised for a 4.55% compound annual growth rate (CAGR) expansion during the forecast period of 2026–2031, capitalizing on PET’s dielectric and mechanical benefits.
Recognizing the benefits of weight reduction for enhanced driving range, automakers are increasingly adopting PET for interior trims and under-hood components. As manufacturing diversifies, industrial uses of PET are expanding, spanning from conveyor belts to protective films. A significant milestone is the launch of 100% rPET yogurt pots, signaling a strategic move into dairy packaging. These developments indicate a shift: while beverage bottles have long been the mainstay, there is an escalating demand for specialized PET grades across various European sectors.
Geography Analysis
Germany's well-established Pfand system minimizes bale contamination, enabling the country to export sorted flakes to neighboring nations with less efficient collection systems. This high-quality feedstock not only supports multiple mechanical plants but has also piqued the interest of Loop Industries for its chemical recycling ventures. While France is slow to implement its DRS, it compensates with subsidies for depolymerization and endorsements of enzymatic methods. This strategy suggests a deliberate policy shift, aiming to decouple rPET supply from collection quality.
Russia, leveraging import substitution and feedstock integration from SIBUR’s new polymer complex, is projected to grow at a 4.48% CAGR during the forecast period of 2026–2031. This complex guarantees a consistent supply of PTA and MEG for both virgin and recycled blends. The United Kingdom's delay of its deposit scheme until 2027 prolongs its reliance on curbside collection, restricting the influx of high-grade rPET into Alpek’s Wilton facility. Conversely, Ireland's rapid embrace of deposit incentives highlights strong consumer support. Portugal plans to debut in 2026, while Romania's notable return rate aids in bridging regional disparities in the European Polyethylene Terephthalate (PET) landscape.
In 2025, the "Rest of Europe" held a 37.22% volume share, catering to the diverse demands of Central and Southern markets. With maturing DRS infrastructure and advancements in chemical recycling for lower-grade inputs, supply chains are becoming more dynamic. This shift is set to enhance cross-border bale trading and empower integrated players skilled in managing feedstock and technology throughout Europe.
Competitive Landscape
The European polyethylene terephthalate (PET) market is moderately consolidated. ALPLA and Plastipak are blurring the lines between producers and converters by venturing into recycling. Their goal is to integrate post-consumer content into their bottle preforms. On another front, emerging chemical recyclers are either piloting or licensing cutting-edge depolymerization technologies. These companies are capitalizing on the green light from EFSA, which has eased certain regulatory concerns. Furthermore, imports from Turkey, Egypt, and Vietnam are curbing price surges in the EU. This development is compelling established players to either streamline costs or focus on specialized niches. In the European Polyethylene Terephthalate (PET) arena, the competitive landscape is evolving. The emphasis is shifting from merely scaling polymerization to mastering recycled feedstock management and regulatory alignment. This evolution is set to shape future capital investments.
Europe Polyethylene Terephthalate (PET) Industry Leaders
Indorama Ventures Public Company Limited
Alpek S.A.B. de C.V.
Plastipak Holdings, Inc.
ALPLA Group
Equipolymers
- *Disclaimer: Major Players sorted in no particular order

Recent Industry Developments
- May 2025: The European Commission initiated an anti-dumping probe into PET imports from Vietnam in response to EU industry complaints regarding injurious under-pricing.
- January 2024: Bormioli Pharma and Loop Industries debuted a pharmaceutical bottle made from 100% Loop PET, illustrating Infinite Loop technology’s capacity to upcycle low-grade waste into food- and pharma-contact resin.


Europe Polyethylene Terephthalate (PET) Market Report Scope
Polyethylene Terephthalate (PET) is a lightweight, durable, and versatile thermoplastic polymer belonging to the polyester family. Known for its clarity and strength, it is extensively used in the packaging and textile industries. PET is produced through the polymerization of ethylene glycol and terephthalic acid (or DMT) and is highly recyclable, contributing to waste reduction and sustainability efforts.
The European polyethylene terephthalate (PET) market is segmented by source type, end-user industry, and geography. By source type, the market is segmented into virgin PET and recycled PET (rPET). By end-user industry, the market is segmented into packaging, automotive, building and construction, electrical and electronics, industrial and machinery, and other end-user industries. The report also covers the market size and forecasts for the market in 5 countries across the region. For each segment, the market sizing and forecasts are done based on volume (Tons).
By Source Type
| Virgin PET |
| Recycled PET (rPET) |
By End-User Industry
| Packaging |
| Automotive |
| Building and Construction |
| Electrical and Electronics |
| Industrial and Machinery |
| Other End-user Industries |
By Geography
| France |
| Germany |
| Italy |
| Russia |
| United Kingdom |
| Rest of Europe |
| By Source Type | Virgin PET |
| Recycled PET (rPET) | |
| By End-User Industry | Packaging |
| Automotive | |
| Building and Construction | |
| Electrical and Electronics | |
| Industrial and Machinery | |
| Other End-user Industries | |
| By Geography | France |
| Germany | |
| Italy | |
| Russia | |
| United Kingdom | |
| Rest of Europe |


Market Definition
- End-user Industry - Building & Construction, Packaging, Automotive, Industrial Machinery, Electrical & Electronics, and Others are the end-user industries considered under the polyethylene terephthalate market.
- Resin - Under the scope of the study, virgin polyethylene terephthalate resin in primary forms such as liquid, powder, pellet, etc. are considered.
| Keyword | Definition |
|---|---|
| Acetal | This is a rigid material that has a slippery surface. It can easily withstand wear and tear in abusive work environments. This polymer is used for building applications such as gears, bearings, valve components, etc. |
| Acrylic | This synthetic resin is a derivative of acrylic acid. It forms a smooth surface and is mainly used for various indoor applications. The material can also be used for outdoor applications with a special formulation. |
| Cast film | A cast film is made by depositing a layer of plastic onto a surface then solidifying and removing the film from that surface. The plastic layer can be in molten form, in a solution, or in dispersion. |
| Colorants & Pigments | Colorants & Pigments are additives used to change the color of the plastic. They can be a powder or a resin/color premix. |
| Composite material | A composite material is a material that is produced from two or more constituent materials. These constituent materials have dissimilar chemical or physical properties and are merged to create a material with properties unlike the individual elements. |
| Degree of Polymerization (DP) | The number of monomeric units in a macromolecule, polymer, or oligomer molecule is referred to as the degree of polymerization or DP. Plastics with useful physical properties often have DPs in the thousands. |
| Dispersion | To create a suspension or solution of material in another substance, fine, agglomerated solid particles of one substance are dispersed in a liquid or another substance to form a dispersion. |
| Fiberglass | Fiberglass-reinforced plastic is a material made up of glass fibers embedded in a resin matrix. These materials have high tensile and impact strength. Handrails and platforms are two examples of lightweight structural applications that use standard fiberglass. |
| Fiber-reinforced polymer (FRP) | Fiber-reinforced polymer is a composite material made of a polymer matrix reinforced with fibers. The fibers are usually glass, carbon, aramid, or basalt. |
| Flake | This is a dry, peeled-off piece, usually with an uneven surface, and is the base of cellulosic plastics. |
| Fluoropolymers | This is a fluorocarbon-based polymer with multiple carbon-fluorine bonds. It is characterized by high resistance to solvents, acids, and bases. These materials are tough yet easy to machine. Some of the popular fluoropolymers are PTFE, ETFE, PVDF, PVF, etc. |
| Kevlar | Kevlar is the commonly referred name for aramid fiber, which was initially a Dupont brand for aramid fiber. Any group of lightweight, heat-resistant, solid, synthetic, aromatic polyamide materials that are fashioned into fibers, filaments, or sheets is called aramid fiber. They are classified into Para-aramid and Meta-aramid. |
| Laminate | A structure or surface composed of sequential layers of material bonded under pressure and heat to build up to the desired shape and width. |
| Nylon | They are synthetic fiber-forming polyamides formed into yarns and monofilaments. These fibers possess excellent tensile strength, durability, and elasticity. They have high melting points and can resist chemicals and various liquids. |
| PET preform | A preform is an intermediate product that is subsequently blown into a polyethylene terephthalate (PET) bottle or a container. |
| Plastic compounding | Compounding consists of preparing plastic formulations by mixing and/or blending polymers and additives in a molten state to achieve the desired characteristics. These blends are automatically dosed with fixed setpoints usually through feeders/hoppers. |
| Plastic pellets | Plastic pellets, also known as pre-production pellets or nurdles, are the building blocks for nearly every product made of plastic. |
| Polymerization | It is a chemical reaction of several monomer molecules to form polymer chains that form stable covalent bonds. |
| Styrene Copolymers | A copolymer is a polymer derived from more than one species of monomer, and a styrene copolymer is a chain of polymers consisting of styrene and acrylate. |
| Thermoplastics | Thermoplastics are defined as polymers that become soft material when it is heated and becomes hard when it is cooled. Thermoplastics have wide-ranging properties and can be remolded and recycled without affecting their physical properties. |
| Virgin Plastic | It is a basic form of plastic that has never been used, processed, or developed. It may be considered more valuable than recycled or already used materials. |


Research Methodology
Mordor Intelligence follows a four-step methodology in all our reports.
- Step-1: Identify Key Variables: The quantifiable key variables (industry and extraneous) pertaining to the specific product segment and country are selected from a group of relevant variables & factors based on desk research & literature review; along with primary expert inputs. These variables are further confirmed through regression modeling (wherever required).
- Step-2: Build a Market Model: In order to build a robust forecasting methodology, the variables and factors identified in Step-1 are tested against available historical market numbers. Through an iterative process, the variables required for market forecast are set and the model is built on the basis of these variables.
- Step-3: Validate and Finalize: In this important step, all market numbers, variables and analyst calls are validated through an extensive network of primary research experts from the market studied. The respondents are selected across levels and functions to generate a holistic picture of the market studied.
- Step-4: Research Outputs: Syndicated Reports, Custom Consulting Assignments, Databases & Subscription Platforms


