
Polyethylene Terephthalate (PET) Foam Market Size and Share
Market Overview
| Study Period | 2021 - 2031 |
|---|---|
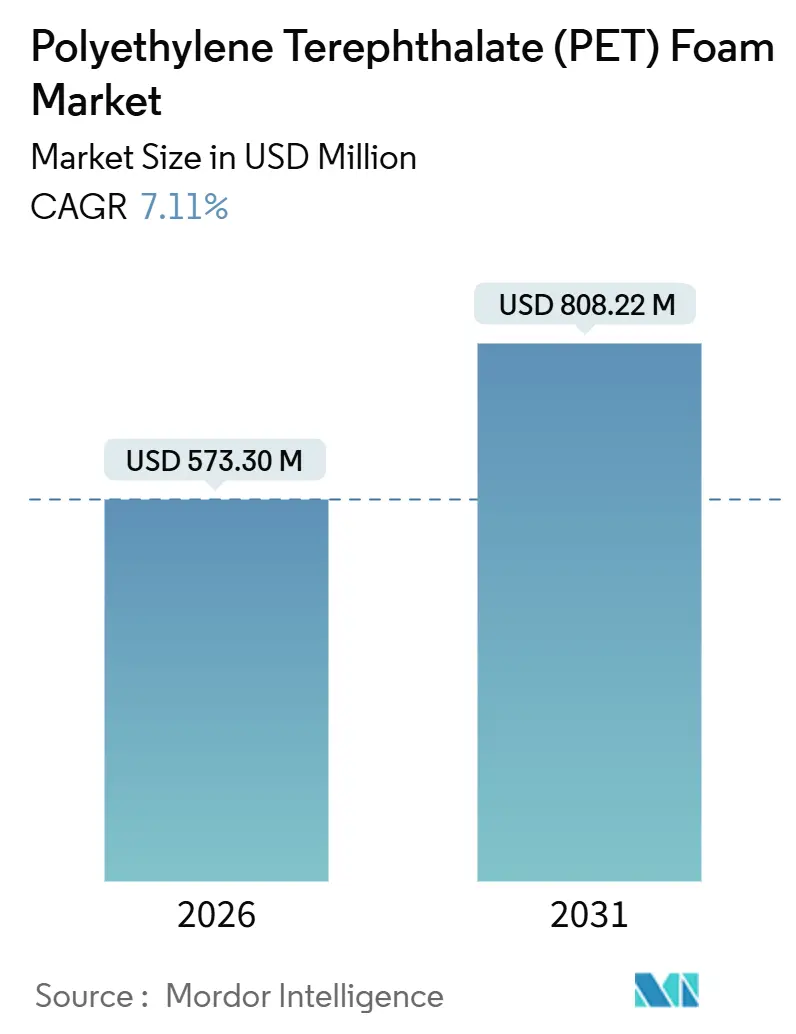
| Market Size (2026) | USD 573.30 Million |
| Market Size (2031) | USD 808.22 Million |
| Growth Rate (2026 - 2031) | 7.11 % |
| Fastest Growing Market | Asia Pacific |
| Largest Market | Asia Pacific |
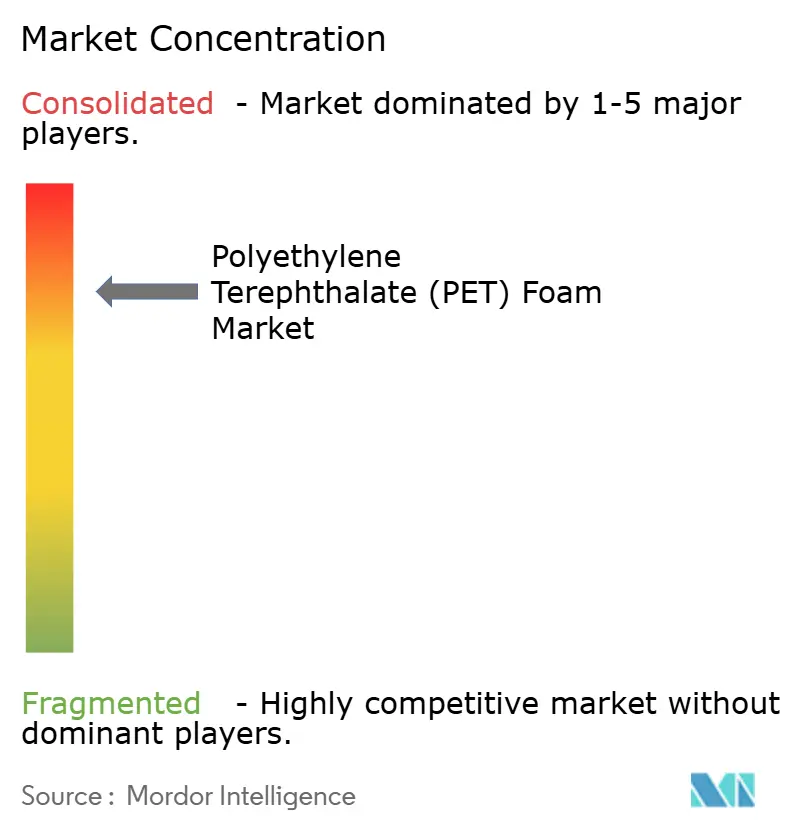
| Market Concentration | High |
Major Players *Disclaimer: Major Players sorted in no particular order Image © Mordor Intelligence. Reuse requires attribution under CC BY 4.0. | |
Polyethylene Terephthalate (PET) Foam Market Analysis by Mordor Intelligence
The Polyethylene Terephthalate Foam Market size is estimated at USD 573.30 million in 2026, and is expected to reach USD 808.22 million by 2031, at a CAGR of 7.11% during the forecast period (2026-2031). Demand is tracking long-term structural shifts toward lightweight, recyclable sandwich cores in wind-turbine blades, electric-vehicle structures, and marine hulls. Longer blades for offshore turbines, tougher fleet-average fuel-economy mandates, and stricter green-building codes are tilting procurement away from balsa, polyvinyl-chloride, and styrene-acrylonitrile cores. Incumbents are responding with capacity additions in Asia-Pacific, low-resin-uptake surface treatments, and higher recycled-content grades. Cost differentials between virgin and recycled feedstocks, together with heat-deflection limits above 100 °C, continue to cap substitution potential in some high-temperature mobility parts.
Key Report Takeaways
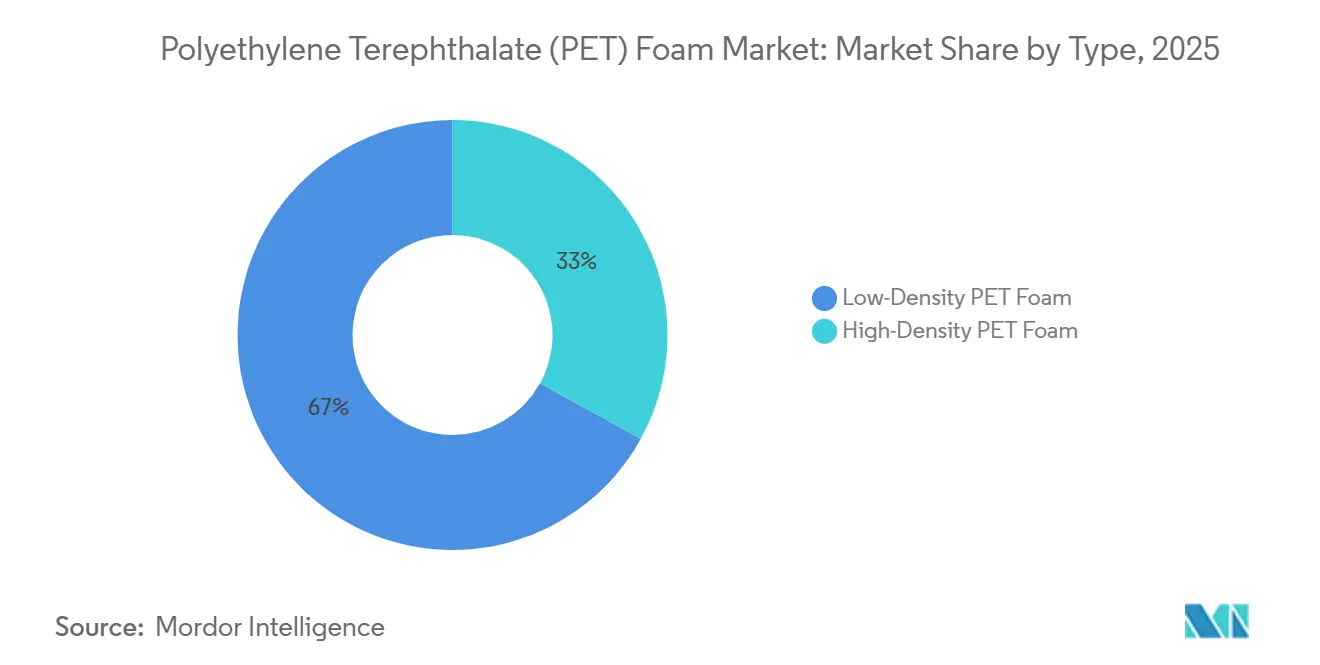
- By type, low-density grades captured 66.98% of the Polyethylene Terephthalate (PET) foam market share in 2025, and are projected to register a 7.22% CAGR through 2031.
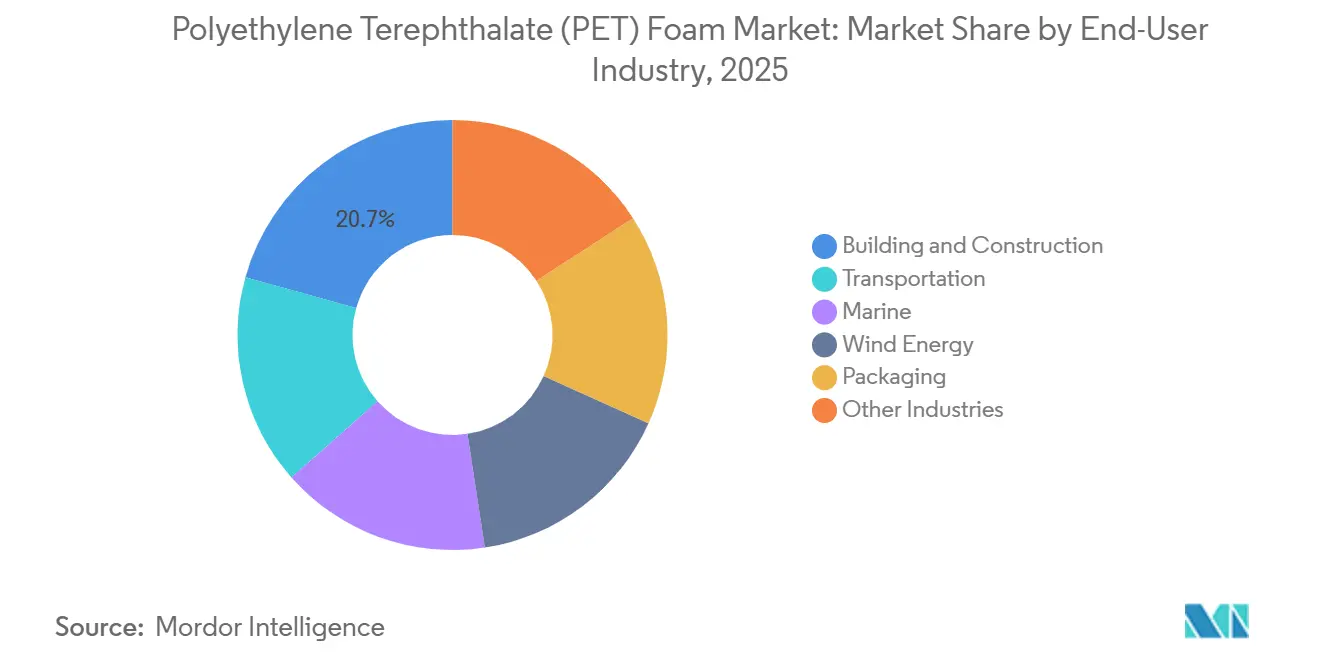
- By end-user, building and construction captured 20.67% of the Polyethylene Terephthalate (PET) foam market share in 2025, and wind energy is advancing at an 8.02% CAGR through 2031, outpacing all other applications.
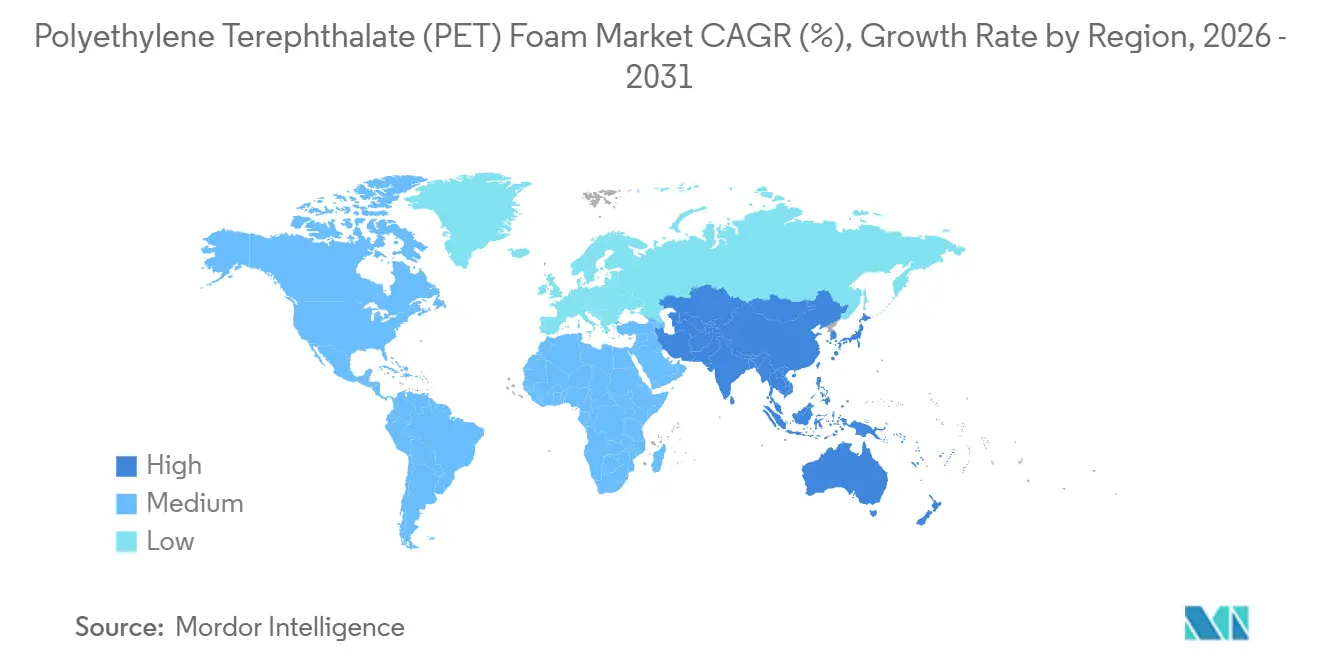
- By geography, Asia-Pacific accounted for 57.67% of revenue in 2025 and is expanding at 8.11% a year to 2031.
Note: Market size and forecast figures in this report are generated using Mordor Intelligence’s proprietary estimation framework, updated with the latest available data and insights as of January 2026.
Market Trends and Insights
Drivers Impact Analysis of Polyethylene Terephthalate (PET) Foam Market*
| Drivers | (~) % Impact on CAGR Forecast | Geographic Relevance | Impact Timeline |
|---|---|---|---|
| Light-weighting push across mobility platforms | +1.8% | Global, with concentration in North America, EU, and China | Medium term (2-4 years) |
| Wind-energy capacity expansion and larger blades | +2.3% | Global, led by APAC (China, India) and Europe (offshore North Sea, Baltic) | Long term (≥ 4 years) |
| Green-building insulation demand | +0.9% | North America and EU, early adoption in urban China | Medium term (2-4 years) |
| Shift to circular, recycled PET feedstocks | +1.4% | EU core, APAC spill-over, North America emerging | Long term (≥ 4 years) |
| Emergence of PET foam cores for UAV/Drone airframes | +0.5% | North America and EU defense sectors, APAC commercial drones | Long term (≥ 4 years) |
| Source: Mordor Intelligence | |||
Light-Weighting Push Across Mobility Platforms
Fuel-economy and carbon-emission regulations in the United States and European Union are forcing automakers to lower vehicle mass while protecting crashworthiness[1]U.S. Department of Transportation, “Corporate Average Fuel Economy Standards,” transportation.gov. PET foam sandwich panels inside battery enclosures deliver weight savings against aluminum and extend electric-vehicle range. Commercial-vehicle builders are retrofitting refrigerated truck bodies with PET-cored panels to mix thermal insulation and structural stiffness. Aerospace adopters are qualifying the material for unmanned-aerial-vehicle wings, but certification cycles extend market entry beyond 2028. Penetration is still limited in engine-bay or exhaust-adjacent zones because foam properties fall rapidly above 100 °C.
Wind-Energy Capacity Expansion and Larger Blades
Global wind additions are poised to grow annually through 2028. Offshore blade lengths have now surpassed significant thresholds, leading to centrifugal loads that sidestep the use of heavier core materials. Dominating the outer sections of the tip, PET foam outperforms balsa in fatigue resistance and sustains tensile strength at lower densities. By sourcing recycled content for its cores, LM Wind Power has successfully reduced the blade's life-cycle carbon footprint. China's wind-blade manufacturers, accounting for over half of the global production, are ramping up efforts as the country sets its sights on achieving significant offshore capacity by 2030.
Green-Building Insulation Demand
Updated commercial codes in North America and Europe mandate roof and wall assemblies to achieve R-values exceeding 30. With a thermal conductivity of less than 0.030 W/m-K and compression strengths that outdo expanded polystyrene, PET foam paves the way for slimmer facades and more expansive rentable floor plates. In China, green-building certifications are driving a swift uptake in upscale high-rise developments. Meeting stringent safety standards, fire-resistance ratings of Class B-s2,d0 under EN 13501-1, do so without the use of halogenated retardants. However, with costs above those of polyurethane, its application remains confined to luxury towers.
Shift to Circular, Recycled PET Feedstocks
Chemical depolymerization technologies convert waste bottles into virgin-grade monomers with high purity. SOPRALOOP’s pilot in 2024 targets recycled resin production by 2027, though capital spending slows rollouts[2]SOPRALOOP, “Chemical Recycling Pilot Plant Announcement,” sopraloop.eu . Beverage mandates for recycled content in China redirect bottle flows, tightening supply for structural foams. Gurit’s Kerdyn FR+ incorporates recycled content and retains marine flame-retardant certification. Recycled-resin prices stress converter margins compared to virgin material.
Restraints Impact Analysis of Polyethylene Terephthalate (PET) Foam Market*
| Restraints | (~) % Impact on CAGR Forecast | Geographic Relevance | Impact Timeline |
|---|---|---|---|
| Mature substitutes (PVC, SAN, balsa) constrain pricing | -1.2% | Global, acute in cost-sensitive wind and marine segments | Short term (≤ 2 years) |
| Volatile rPET resin supply and cost | -0.8% | EU and North America core, APAC emerging | Medium term (2-4 years) |
| Heat-deflection limits above 100°C for high-temp parts | -0.6% | North America and EU automotive, aerospace applications | Long term (≥ 4 years) |
| Source: Mordor Intelligence | |||
Mature Substitutes Constrain Pricing Power
Balsa wood, polyvinyl-chloride, and styrene-acrylonitrile foams, by undercutting PET on cost, have solidified their foothold in wind-blade root sections. Balsa sales are growing annually, thanks to blade makers' familiarity with its processing. Evonik’s polymethacrylimide foam conserves resin and dominates high-temperature aerospace niches. To achieve comparable stiffness, PET needs to increase its density, a move that escalates costs in price-sensitive marine applications.
Volatile Recycled-PET Resin Supply and Cost
Due to bottle-to-bottle loops aggressively bidding for feedstock, recycled resin commands a premium in the market. Eastman operates two depolymerization sites, which cater to packaging, textiles, and foams. While EU producer-responsibility regulations set to take effect in 2025 aim to elevate collection targets, new chemical plants grapple with capital constraints. To mitigate market fluctuations and temper sustainability claims, converters are blending recycled pellets with virgin materials.
*Our forecasts treat driver/restraint impacts as directional, not additive. The impact forecasts reflect baseline growth, mix effects, and variable interactions.
Polyethylene Terephthalate (PET) Foam Market Segment Analysis
By Type:
Low-Density Dominance in Blade TipsLow-density grades held 66.98% of the Polyethylene Terephthalate (PET) foam market value in 2025 and are expanding at 7.22% a year to 2031, propelled by use in wind-blade tip sections that value fatigue resistance and minimal inertia. Compressive strengths suitable for outer blades and marine decks are achieved with specific densities, allowing for a reduction in laminate weight. High-density grades are utilized for supporting blade roots and hull bottoms. Despite growth, the expansion appears subdued, likely due to competition from balsa and PVC. In May 2024, Armacell inaugurated its fourth extrusion line in Suzhou, with a strategic focus on low-density outputs tailored for China's offshore projects.
Prototypes featuring hierarchical groove-perforation demonstrate a potential future balance between strength and lightweight properties. Surface treatments, such as 3A Composites’ AIREX T92 SealX, achieve a reduction in resin uptake, subsequently lowering both cost and carbon metrics. While high-density foam is sought after for protective packaging and flat-roof insulation—both demanding compression resistance—its volumes remain modest when compared to those used in turbines and marine constructions.


By End-User Industry:
Wind Energy Outpaces ConstructionBuilding and construction owned 20.67% of 2025 revenue, yet wind energy clocks the fastest 8.02% CAGR through 2031 as global offshore deployments mushroom. New 15-MW turbines now incorporate low-density core in their blades, significantly boosting demand for PET. In the transportation sector, PET is utilized for battery covers and the sides of refrigerated trucks. While demand grows, heat constraints limit its use under the hood. Marine sandwich structures witness growth, driven by yacht builders in Europe and North America shifting to recyclable cores to comply with eco-label regulations.
Packaging, though accounting for a small share, reaps benefits from shipments in electronics and medical devices that require impact protection, steering clear of polystyrene. Other smaller sectors, including sports, furniture, and consumer electronics, collectively hold a notable share. Notably, drone airframes are poised for a surge post-2028, contingent on the finalization of structural standards. The wind energy sector's growing influence is reshaping sourcing dynamics. Blade OEMs are now targeting recycled content, pushing foam suppliers to prioritize chemical depolymerization outputs.

Geography Analysis
APAC Polyethylene Terephthalate (PET) Foam Market
Asia-Pacific generated 57.67% of 2025 revenue and is expanding 8.11% yearly to 2031, reflecting concentrated blade manufacturing in China and nascent marine-composite hubs in Southeast Asia. China is set to achieve a target of offshore wind capacity by 2030, with an estimated annual consumption of core for tip sections. Domestic players, Changzhou Tiansheng and Wankai, are undercutting European imports, heightening price competition. While India adds wind capacity annually, its absence of domestic depolymerization leads to elevated resin import costs. Meanwhile, Vietnam and Thailand are capitalizing on their advantageous labor and port infrastructure to export PET-cored boats to Europe.
North America Polyethylene Terephthalate (PET) Foam Market
North America is projected to grow, buoyed by the momentum of Atlantic offshore wind farms and electric vehicle mandates. The U.S. bolstered its capacity in 2024, marking the debut of large-scale offshore arrays in Massachusetts and New York, necessitating 100-m blades. With CAFE standards pushing for higher fuel efficiency by 2026, there's a surge in composite demand, even as heat constraints limit PET's application to cabin-temperature components. Canada's national building code is now advocating for elevated wall R-values, driving the adoption of PET cores in structural-insulated panels, albeit at a premium.
EMEA and South America Polyethylene Terephthalate (PET) Foam Market
Europe is set to grow as projects in the North Sea and Baltic progress, and circular-economy directives push for recycled materials in construction. In 2024, Germany, Denmark, and the U.K. collectively installed offshore wind capacity. While extended-producer-responsibility rules set to take effect in 2025 are boosting demand for recycled-content foam, the limited capacity for chemical recycling is curbing volume growth. South America, along with the Middle East and Africa, collectively represents a small portion of the market; however, Brazil's onshore wind developments and South Africa's marine craft industry signal budding growth.

Value Chain Analysis
PET foam value creation starts with feedstock sourcing (virgin PET and increasingly recycled PET flakes or pellets) and compounding of additives, including fire-retardant packages for construction and marine grades. Foam producers convert resin via extrusion and expansion into blocks or sheets, then support secondary processing such as CNC cutting, grooving or perforation, kitting, and surface treatments that reduce resin uptake in composite layups. Key material suppliers and converters include Armacell, 3A Composites Core Materials (Airex), Diab Group, Gurit, along with regional Asian producers such as Changzhou Tiansheng and Wankai that compete on cost and proximity to blade and marine composite hubs.
Downstream, PET foam moves through composite fabricators and distributors into wind-blade OEM supply chains, marine hull and deck builders, transportation panel makers (including refrigerated bodies), and building insulation and sandwich panel manufacturers. The main bottlenecks are rPET availability and price volatility, as well as trade-policy friction that affects resin and foam logistics. China-side PET tightness ahead of Chinese New Year has periodically constrained input availability for converters, and expanded US tariffs on PET and rPET imports (announced in September 2025) increased incentives for regionalized sourcing and supplier qualification to reduce duty exposure and lead-time risk.
Competitive Landscape
The polyethylene terephthalate (PET) foam market is consolidated. White-space lies in drone airframes and protective packaging, but slow certification and pricing hurdles keep volumes small. Chinese machinery providers offer turnkey extrusion lines at lower capital cost, lowering entry barriers for regional converters. Patent filings around fire-retardant chemistries and hierarchical cell structures suggest incumbents are defending performance advantages, yet commodity low-density grades are already experiencing price erosion from new Asian entrants.
Polyethylene Terephthalate (PET) Foam Industry Leaders
Armacell
3A Composites (Schweiter Technologies AG)
Diab Group
Gurit Services AG
CoreLite
- *Disclaimer: Major Players sorted in no particular order
Polyethylene Terephthalate (PET) Foam Market Companies Covered in this Report
- 3A Composites (Schweiter Technologies AG)
- Airex AG
- Armacell
- BASF SE
- Carbon-Core Corp.
- Changzhou Tiansheng New Materials Co., Ltd.
- Composites One
- CoreLite
- Diab Group
- Feininger (Nanjing) Energy Saving Technology Co.,ltd.
- Gneuss Kunststofftechnik GmbH
- Gurit Services AG
- Liner
- Longhua Technology Group (Luoyang) Co., Ltd.
- Nanjing Chuangbo Machinery Co., Ltd.
- Nitto Denko Corporation
- Polyumac USA, LLC.
- Sekisui Kasei Co., Ltd.
- Shanghai Yueke New Materials
- TOPOLO
- USEON Technology Limited
- Wankai New Materials Co., Ltd.
Read Analysis of Polyethylene Terephthalate (PET) Foam Companies

Market Opportunities and Future Outlook
White-space is opening where buyers want recyclable sandwich cores with documented recycled content, but supply and verification of recycled feedstocks remains uneven. The European Commission adopted a methodology in July 2026 for calculating, verifying, and reporting chemically recycled content in single-use PET bottles under the Single-Use Plastics Directive (SUPD), which strengthens mass-balance style accounting and sets clearer rules for claims that matter for PET foam producers competing for rPET streams and certification-ready inputs. In the United Kingdom, PackUK issued RAM 2027 materials assessment guidance in July 2026 that tightens design-for-recycling criteria (including color and PFAS-related limits), pushing packaging value chains toward clearer, more compliant PET formats and affecting the quality and sortability of post-consumer PET entering recycling.
Opportunities also track conversion and service models rather than foam output alone. Wind energy and marine buyers increasingly purchase kitted and shaped cores to cut layup time and resin consumption, which favors suppliers that combine extrusion with downstream machining, finishing, and application engineering. On the feedstock side, recycling performance gaps highlight investable needs in collection, sorting, and closed-loop preparation of suitable rPET for structural foams: NAPCOR reported PET thermoform recovery reached 264 million pounds in 2024, while PCR use fell to 12%, underscoring the mismatch between recovered volumes and high-quality PCR incorporation that PET foam converters need to bridge through qualification, cleaning, and consistent pellet supply.
Recent Industry Developments in Polyethylene Terephthalate (PET) Foam Market
- July 2026: Armacell deepened its Asia-Pacific industry engagement by rolling out technical exchange programs and the ArmaLive Experience Centre, reinforcing its downstream support for insulation specification, energy efficiency, and fire-safety practices. The programs support application engineering pull-through for PET foam and adjacent insulation solutions in a region that leads global PET foam consumption.
- January 2025: Gurit signed a multi-year contract with Genesis Products to supply Kerdyn PET foam containing up to 100% recycled content for North American commercial-interior panels. The agreement links recycled-content grades to a steady outlet in interior panel applications and supports broader qualification of circular PET foam solutions outside wind and marine.
- December 2024: Diab Group acquired Subsea Composite Solutions AS (SCS), expanding into end-to-end subsea buoyancy solutions by adding machining and finishing capabilities. This integration improves Diab's ability to deliver higher-value, application-ready buoyancy systems and can raise adoption of PET-based core materials in subsea and offshore use cases.


Polyethylene Terephthalate (PET) Foam Market Report Scope and Research Methodology
Market Definition and Coverage
For this study, the PET foam market covers rigid, closed-cell core materials made from polyethylene terephthalate that are sold as sheets, blocks, or panels for structural sandwich applications and related uses, measured in revenue terms.
Scope exclusions: Adhesives, resins, fiberglass/carbon skins, balsa/PVC cores, and finished composite parts are excluded unless they are sold as PET foam products.
Segments Covered in This Report
- By Type
- Low-Density PET Foam
- High-Density PET Foam
- By End-User Industry
- Building and Construction
- Transportation
- Marine
- Wind Energy
- Packaging
- Other Industries (Aerospace, Sports, Electronics, Furniture)
- By Geography
- Asia-Pacific
- China
- India
- Japan
- South Korea
- ASEAN Countries
- Rest of Asia-Pacific
- North America
- United States
- Canada
- Mexico
- Europe
- Germany
- United Kingdom
- Italy
- France
- Spain
- Russia
- NORDIC Countries
- Rest of Europe
- South America
- Brazil
- Argentina
- Rest of South America
- Middle-East and Africa
- Saudi Arabia
- South Africa
- Rest of Middle-East and Africa
- Asia-Pacific
Data Sources, Market Sizing, and Validation
Desk Research
Desk work starts with building the demand map for PET foam across construction, transport, marine, wind energy, and packaging. We mainly rely on public sources such as UN Comtrade trade statistics, the US International Trade Commission data, Eurostat industrial and trade series, International Energy Agency renewables statistics, and publications from composite and wind energy associations for context on blade and laminate activity.
To convert activity into an addressable market, we also review manufacturer product datasheets, safety documents, and public price indications to set realistic density ranges and typical thickness mixes. We use company annual reports, investor presentations, and reputable press to track capacity moves, plant locations, and end-use exposure. Where needed, paid subscriptions for company financials and intelligence, patent databases, and shipment-level trade datasets were used to cross-check timelines and fill gaps. The desk sources listed here are illustrative only, and additional references were used during collection, validation, and clarification.
Primary Interviews and Surveys
Primary work focuses on checking what is actually being bought and specified, and how pricing shifts with resin, recycled content, and energy costs. We spoke with a mix of material suppliers, converters, distributors, and downstream users tied to construction panels, marine composites, and wind blade supply chains across APAC, EMEA, and the Americas to validate assumptions and sanity-check the modeled totals.
Distribution of primary research fieldwork respondents
| Company type | Respondent position | Region |
|---|---|---|
| Top tier: 31% | CXOs: 20% | APAC: 45% |
| Mid tier: 47% | Functional/Unit leaders: 36% | EMEA: 31% |
| Smaller Players: 22% | Managers: 44% | Americas: 24% |
Market-Sizing & Forecasting
Sizing is built using a top-down approach where end-use activity indicators are reconstructed into a PET foam demand pool, and then converted into value using realistic density and price bands. Inputs that typically matter here include wind blade build rates and refurbishment cycles, composite panel demand in building and transport, resin and rPET availability trends, typical core thickness and density preferences by application, and import-export flows that indicate where supply is being served from.
Once the demand pool is formed, we corroborate results with selective bottom-up approximations such as supplier revenue splits, sampled price per cubic meter by density grade, and channel checks on how much of a project bill of materials is attributable to core materials. Where data is missing for smaller countries, we apply proxy logic based on similar industrial structure and trade intensity, and then review outputs to avoid overstating fast-growing markets.
For forecasting, we use scenario analysis because adoption is closely tied to wind project pipelines, construction activity, and substitution from other core materials. Scenario paths are anchored to expert views on capacity additions, pricing pass-through timing, and region-level demand momentum, and then the final forecast is normalized back to what the historical trend can reasonably support.
Data Validation & Update Cycle
Outputs are checked against independent signals such as trade values, resin price direction, and announced capacity changes, and then reviewed for outliers at the region and end-use level. When a variance shows up, we revisit the assumptions and, if needed, trigger follow-up calls to confirm whether the change is price-led or volume-led.
Before sign-off, the model goes through stepwise analyst reviews where definitions, conversion factors, and year-on-year movements are examined together, and then stress-tested for currency timing and inflation effects. The report is refreshed annually, and interim updates are done when relevant material events occur. Right before delivery, a final pass is completed so clients receive the latest updated view.
Mordor Intelligence's Pet Foam Market Size Compared Against Other Published Estimates
It is normal to see different market numbers for PET foam because publishers do not always count the same products, years, or end-use boundaries, and they also apply different pricing logic. Differences show up most often when one estimate blends adjacent foam cores, or when volumes are converted to value using broad average prices that are not tied to density and grade mix.
Key gap drivers in PET foam tend to be whether recycled-content grades are priced separately, how wind energy demand is timed (new builds versus servicing), and whether construction panels are counted at ex-works prices or downstream selling prices. By tracking blade build activity, construction panel indicators, and density-grade price bands, Mordor Intelligence anchors the 2026 value to a defined core-material revenue pool, and then keeps the model aligned through annual refresh checks on trade signals and capacity moves.
Benchmark comparison
| Source | Market Size | Gaps in Research Methodology |
|---|---|---|
| Mordor Intelligence | USD 573.30 M (2026) | |
| Global Consultancy A | USD 534.23 M (2025) | Uses a different base year and mixes raw material splits into the headline number, which can shift the value depending on assumed recycled versus virgin pricing and currency timing. |
| Industry Publisher B | USD 493.07 M (2025) | Broader segmentation is shown, but the headline size appears to rely on generalized average prices and may not fully reflect application-level density mix, especially for wind and marine core grades. |
The spread across sources mainly comes from the base year chosen and how price is converted from volume across grades and end uses. Our approach stays traceable because the demand pool is tied to visible activity indicators, and the value is built using grade-aware price bands that can be rechecked as market conditions change.


Key Questions Answered in the Report
What is the current value of the Polyethylene Terephthalate (PET) foam market?
The market is worth USD 573.30 million in 2026 and is forecast to reach USD 808.22 million by 2031, registering a CAGR of 7.11%.
Which segment is growing fastest?
Wind energy applications are advancing at an 8.02% CAGR through 2031 as offshore turbine blades lengthen.
How significant is recycled content?
Leading blade OEMs now specify recycled feedstock, pushing foam suppliers toward chemical depolymerization contracts.
Which region dominates demand?
Asia-Pacific commands 57.67% of revenue thanks to China’s large blade-manufacturing base and offshore wind targets.
Page last updated on:


 Your data is secure and never sold or shared.


