Market Overview
| Study Period | 2020 - 2031 |
|---|---|
| Forecast Data Period | 2026 - 2031 |
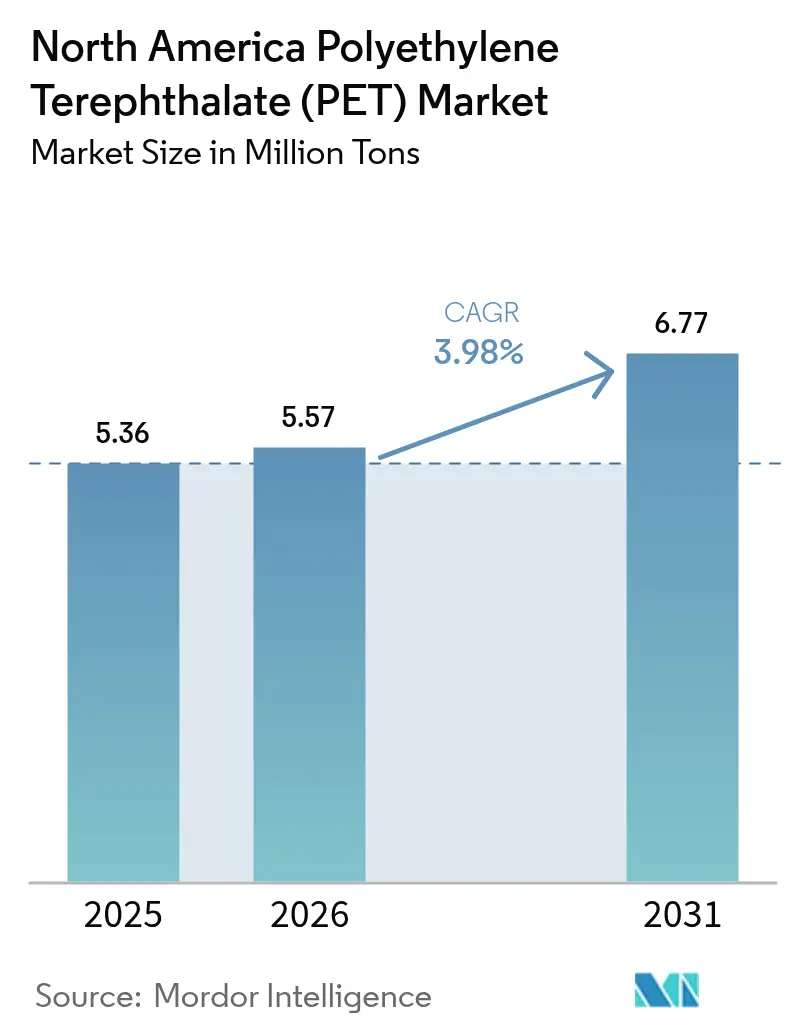
| Base Year Market Size (2025) | 5.36 Million tons |
| Market Volume (2026) | 5.57 Million tons |
| Market Volume (2031) | 6.77 Million tons |
| Growth Rate (2026 - 2031) | 3.98% CAGR |
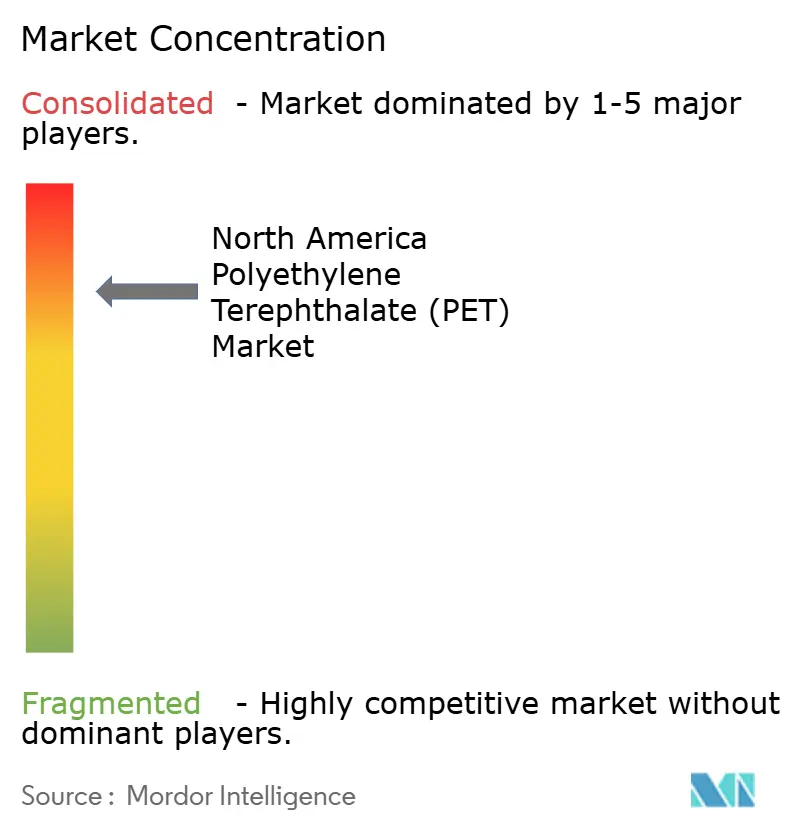
| Market Concentration | High |
Major Players *Disclaimer: Major Players sorted in no particular order Image © Mordor Intelligence. Reuse requires attribution under CC BY 4.0. | |
North America Polyethylene Terephthalate (PET) Market Analysis by Mordor Intelligence
The North America Polyethylene Terephthalate market size is expected to grow from 5.36 Million tons in 2025 to 5.57 Million tons in 2026 and is forecast to reach 6.77 Million tons by 2031 at 3.98% CAGR over 2026-2031. Robust brand-owner sustainability mandates, chemical recycling scale-ups, and expanding bottle-to-bottle collection programs underpin the growth trajectory even as virgin resin still dominates overall consumption. The United States accounts for the largest regional consumption, while Mexico is the fastest-growing geography, due to near-shoring manufacturing and rapid infrastructure development. Standardized Extended Producer Responsibility (EPR) schemes in four U.S. states plus multiple Canadian provinces are revising fee structures, accelerating the shift toward circular grades and pressuring converters that remain tied to traditional formats.
Key Report Takeaways
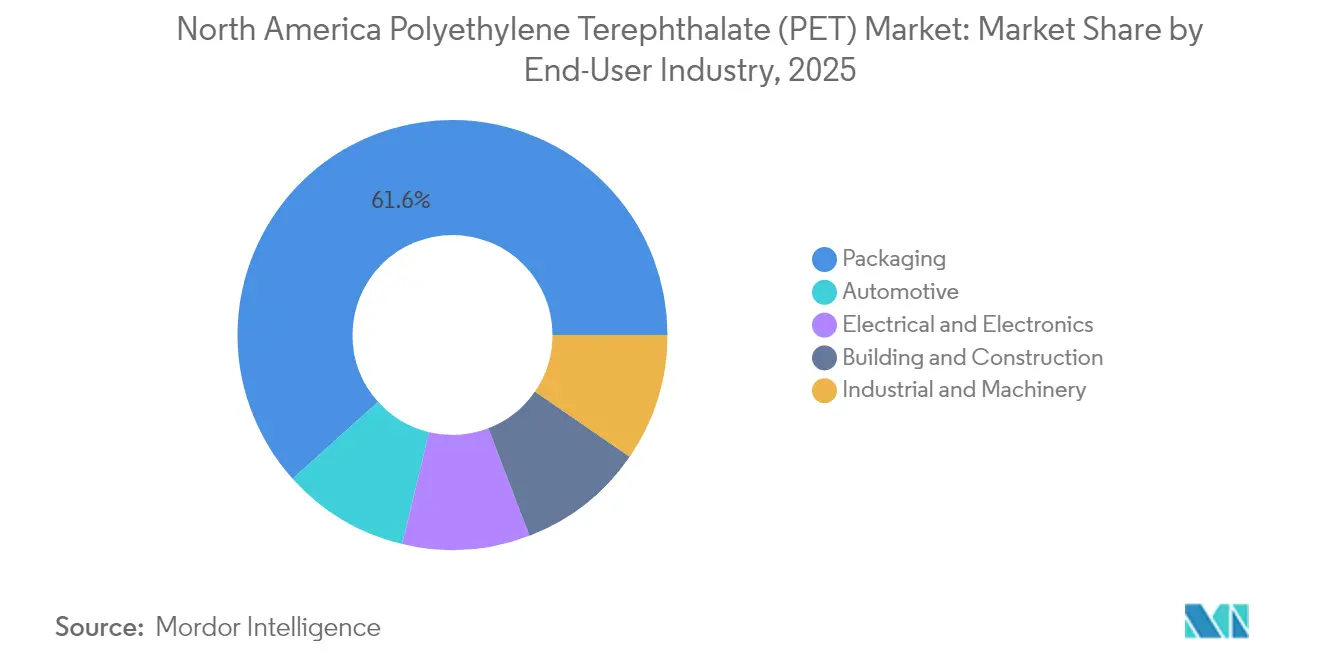
- By end-user industry, packaging led with a 61.65% revenue share in 2025; the automotive industry is advancing at a 4.81% CAGR through 2031.
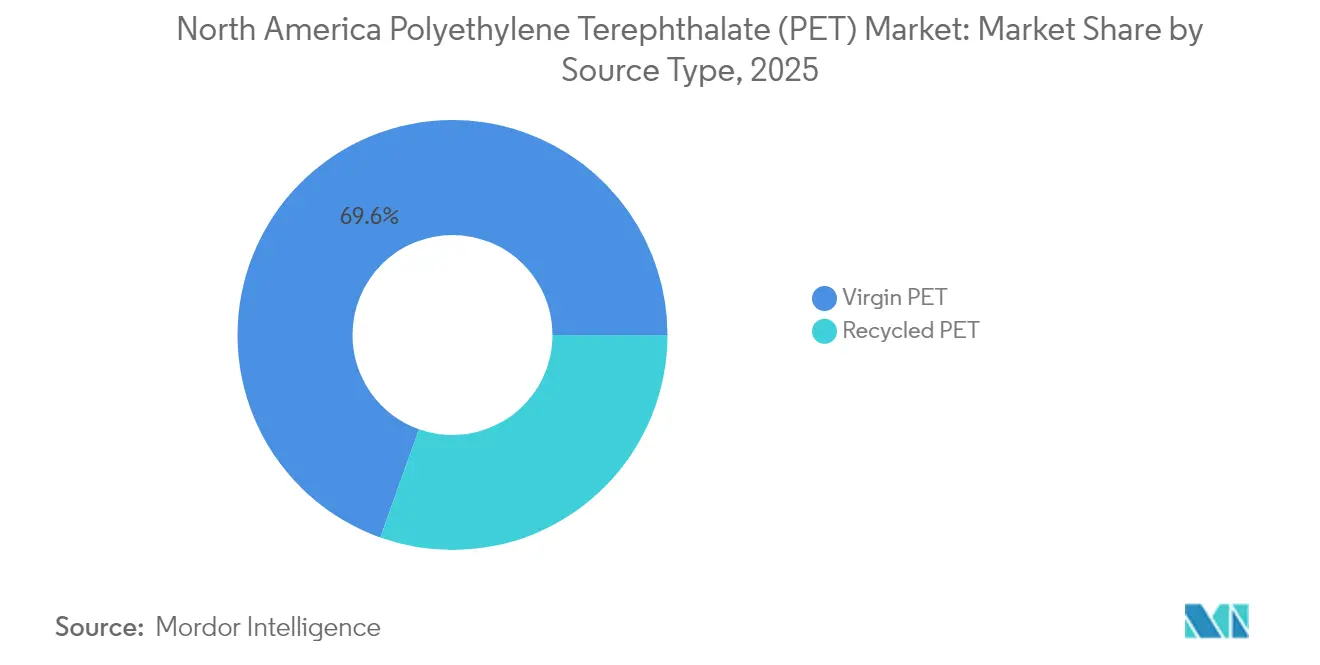
- By source type, virgin PET held 69.55% of the polyethylene terephthalate market share in 2025, while recycled PET is projected to post the highest CAGR at 6.10% through 2031.
- By geography, the United States captured 77.55% of the regional volume in 2025, whereas Mexico is projected to post the highest growth rate at a 5.09% CAGR through 2031.
Note: Market size and forecast figures in this report are generated using Mordor Intelligence’s proprietary estimation framework, updated with the latest available data and insights as of 2026.
North America Polyethylene Terephthalate (PET) Market Trends and Insights
Drivers Impact Analysis*
| Drivers | (~) % Impact on CAGR Forecast | Geographic Relevance | Impact Timeline |
|---|---|---|---|
| Growing demand for rPET in food-grade packaging | +1.2% | California, Northeast United States | Medium term (2-4 years) |
| Surge in lightweighting initiatives among soft-drink brands | +0.8% | United States core, spill-over to Mexico | Short term (≤ 2 years) |
| Rise of chemical recycling capacity announcements post-2025 | +1.5% | U.S. Gulf Coast, Great Lakes region | Long term (≥ 4 years) |
| Inflation-linked resin price pass-through clauses in contracts | +0.7% | United States and Mexico | Short term (≤ 2 years) |
| Brand-owner pledges for 50% recycled content by 2030 | +1.1% | United States and Mexico | Medium term (2-4 years) |
| Source: Mordor Intelligence | |||


Growing Demand for rPET in Food-Grade Packaging
The surging use of food-grade recycled PET is anchored by Coca-Cola’s commitment to 35-40% recycled material by 2035 and PepsiCo’s goal of 40% recycled content in plastic packaging. The U.S. Food and Drug Administration’s rigorous letter-of-no-objection protocol underpins confidence in the safety of rPET for food contact, while Health Canada follows parallel guidelines that harmonize North American supply chains. The Association of Plastic Recyclers (APR) has established design-for-recycling guidelines, and ISCC PLUS certification at converters, such as Tetra Pak’s Querétaro site, provides chain-of-custody transparency. These developments collectively enhance the value proposition of chemically and mechanically recycled grades, driving resilient demand across beverage, dairy, and ready-to-eat meal channels.
Surge in Lightweighting Initiatives Among Soft-Drink Brands
Coca-Cola’s breakthrough bottle re-engineering reduced preform weight from 21 g to 18.5 g, subtracting 30 million lb of virgin PET during 2025. KHS and Husky validated ultralight 591 mL bottles at 5.89 g, reflecting a 30% material reduction that major co-packers are rapidly converting. Brand owners are responding to dual cost pressures from volatile purified terephthalic acid (PTA) and monoethylene glycol (MEG) feedstocks, as well as emerging source-reduction laws in several U.S. municipalities. Alpla’s pledge to reach 700,000 tons of recycled PET capacity by 2030 intensifies competition, encouraging converters to adopt aggressive lightweighting to maintain cost competitiveness while meeting recycled-content ambitions. Simultaneous advancements in injection-stretch blow molding and proprietary barrier coatings enable the preservation of carbonation shelf life, even at lower wall thicknesses, thereby broadening adoption beyond carbonated soft drinks to include water and dairy categories.
Rise of Chemical Recycling Capacity Announcements Post-2025
ExxonMobil is investing more than USD 200 million to increase advanced recycling output by 350 million pounds per year across its Baytown and Beaumont complexes by 2026. PureCycle is deploying USD 300 million toward global purification lines aimed at 1 billion lb capacity by 2030, signaling robust investor confidence in depolymerization economics. Eastman, following a U.S. Department of Energy grant shortfall, redirected focus to Kingsport, Tennessee, where commercial production of chemically recycled PET is slated for mid-2025. SABIC’s pyrolysis-oil demonstration unit in Geleen boosts its TRUCIRCLE portfolio and positions the firm to capture new demand as MERCOSUR regulators formally recognize chemical recycling under Resolution 07/24. Origin Materials expands feedstock options through CapFormer technology, enabling the recovery of PET from caps and closures—an incremental stream that is often excluded from mechanical bottle recycling.
Inflation-Linked Resin Price Pass-Through Clauses in Contracts
North American converters have negotiated dynamic price escalators indexed to the PTA and MEG benchmarks, allowing for partial cost recovery when feedstock prices spike. While these clauses mitigate revenue volatility, lag effects can compress margins during rapid down cycles, forcing processors to recalibrate their inventory and sourcing strategies. Multi-year supply pacts between brand owners and integrated resin suppliers provide volume predictability; however, demand-driven allocation clauses remain in effect during force majeure or severe feedstock shortages. Resource buyers in Mexico increasingly adopt similar mechanisms to align with U.S. procurement norms as near-shoring deepens cross-border contract standardization. Forward-curve hedging through PTA futures on Asia-based exchanges is being explored to complement traditional physical inventories, introducing sophisticated risk management tools that are previously unfamiliar to many converters.
Restraints Impact Analysis*
| Restraints | (~) % Impact on CAGR Forecast | Geographic Relevance | Impact Timeline |
|---|---|---|---|
| Price volatility of PTA and MEG feedstocks | -0.9% | United States Gulf Coast | Short term (≤ 2 years) |
| Aluminum can substitution in carbonated soft drink (CSD) segment | -0.6% | United States core, emerging Mexico | Medium term (2-4 years) |
| Low bottle-to-bottle collection rates in Mexico | -0.4% | Mexico | Medium term (2-4 years) |
| Source: Mordor Intelligence | |||
Price Volatility of PTA and MEG Feedstocks
The price disadvantages of paraxylene in North America versus Northeast Asia expose PET resin producers to cyclical import surges when Asian oversupply depresses prices. Indorama Ventures booked a USD 308 million impairment on its paused Corpus Christi PTA-PET complex, highlighting the fragile economics of domestic feedstock integration. For converters, inflation-linked pass-through clauses offer a buffer, but can lag rapidly falling raw-material costs, thereby narrowing spreads during downcycles. Strategic responses include dual-sourcing PTA from Asia, increasing recycled feedstock blends to hedge virgin volatility, and optimizing plant scheduling to align production with favorable feedstock price windows.
Aluminum Can Substitution in CSD Segment
Many new North American beverage launches in 2025 utilized aluminum cans, a significant increase from the rate five years prior. Projections suggest aluminum will surpass PET in CSD volume by 2027. Younger consumers perceive aluminum as more sustainable despite PET’s lower energy footprint in lightweight, multi-serve applications. Sonoco’s USD 3.9 billion purchase of Eviosys enhanced global metal-can capacity, adding competitive pressure. Nonetheless, PET retains advantages in 2-liter and multi-serve formats where aluminum’s weight and cost negate shelf-space gains.
*Our forecasts treat driver/restraint impacts as directional, not additive. The impact forecasts reflect baseline growth, mix effects, and variable interactions.
Segment Analysis
By End-User Industry: Packaging Retains Scale as Automotive Accelerates
Packaging opened 2025 with 61.65% of regional volume, underscoring its long-standing role in beverage, dairy, and personal-care supply chains. The segment leverages widespread blow-molding infrastructure, a strong brand presence on shelves, and robust compliance with U.S. Food and Drug Administration and Health Canada regulations. The expansion of food delivery in Mexico’s economy has added incremental demand for take-out lids, cups, and multilayer trays that improve heat retention. Automotive demand is growing at a 4.81% CAGR, driven by 13% year-over-year vehicle output growth in Mexico and increased resin substitution for metal under-hood parts. Lightweighting synergies with recycled content goals position seat-back frames, air-management ducts, and wheel-well liners for further conversion away from aluminum and steel. Electrical and electronics manufacturers benefit from near-shoring trends that reduce lead times for home appliance housings and laptop bezels. Building and construction contractors utilize PET panels for insulation, where flame-retardant additives enable UL94-V0 compliance without the use of halogen compounds. Industrial and machinery demand gains traction from Nestlé Purina’s USD 450 million North Carolina plant and ADM’s USD 39 million Mexican wet-food factory, both adopting reusable PET totes for bulk ingredient handling.
The polyethylene terephthalate market will continue to be reshaped by OEM sustainability scorecards that favor recycled content, eco-modulated fees, and low-carbon packaging. Deposit-return expansion in U.S. states is likely to divert post-consumer bottles directly into packaging reprocessors, limiting competition from automotive and textile users. At the same time, automotive tier-ones are negotiating multi-year contracts that bundle virgin and chemical rPET streams to secure supply during model redesigns. Cross-segment competition for food-grade rPET therefore intensifies, with converters prioritizing applications that tolerate slight haze or color variation. Packaging volumes will still dominate until at least 2030, yet faster relative growth in automotive and electrical markets will gradually diversify demand and reduce concentration risk. These cross-currents ensure the polyethylene terephthalate market remains highly sensitive to feedstock economics, design-for-recycling rules, and evolving OEM procurement standards.


By Source Type: Recycled PET Outpaces Virgin Dominance
Virgin PET maintained a 69.55% polyethylene terephthalate market share in 2025 because bottle-grade clarity, mechanical strength, and food-contact approvals are most easily guaranteed with prime resin. However, rPET is expanding at a 6.10% CAGR, driven by ExxonMobil’s USD 200 million debottlenecking project at its Baytown and Beaumont facilities. PureCycle’s USD 300 million rollout and SABIC’s Geleen pyrolysis facility strengthen the supply base for depolymerized feedstocks that meet stringent U.S. Food and Drug Administration requirements.
Over the forecast horizon, virgin PET will relinquish single-digit percentage points of volume each year as mandatory recycled-content thresholds in California, Oregon, and Colorado escalate. Chemical rPET’s ability to deliver near-virgin properties at scale positions it as the preferred grade for high-clarity beverage applications and multilayer thermoforms. Mechanical recyclers will focus on sheet, strapping, and non-food bottles, where minor haze is acceptable. As a result, supply-demand equilibrium will hinge on how quickly chemical depolymerization lines ramp, their energy footprints, and the availability of mixed-color bottles that once move into export streams.
Geography Analysis
The United States contributed 77.55% of the regional volume in 2025, buoyed by B2C e-commerce, high per-capita bottled-water consumption, and concentrated recycling infrastructure. Extended Producer Responsibility laws in California, Maine, Oregon, and Colorado were introduced in 2025, featuring eco-modulated fees that reward mono-material bottle designs and penalize hard-to-recycle formats. U.S. bottle recycling climbed to 33% in 2023, the highest level since 2017, although MIT modeling suggests that 82% is feasible under nationwide deposit schemes. Supply rationalization, including Alpek’s Fayetteville closure, improved domestic operating rates, while ExxonMobil’s advanced-recycling build-out added forward integration options for major brands.
Canada follows with comprehensive provincial EPR frameworks across Ontario, Quebec, British Columbia, Alberta, and Saskatchewan that set clear post-consumer resin targets. Harmonized guidelines enable cross-border shipments of bottles for reprocessing and ensure that Health Canada’s food-contact rulings align with those of the U.S. Food and Drug Administration. Canadian converters benefit from higher bale quality due to depot collection systems, but still rely on U.S. chemical recyclers for food-grade output. Investments such as The Crump Group’s USD 85 million Nashville expansion position Canadian pet-food brands to source rPET trays domestically while exporting finished goods to the United States.
Mexico is the fastest-growing geography, with a 5.09% CAGR through 2031. Near-shoring inflows drive demand for packaging of auto parts, appliances, and consumer goods transported to U.S. distribution hubs. Tesla’s planned USD 5 billion plant, combined with 13% year-over-year automotive production gains in 2023, boosts resin off-take for under-hood and fluid-handling components. Mexico also hosts PetStar and PLANETA, two of the world’s largest bottle-to-bottle recycling facilities, which collectively convert 136,000 tons per year, thereby enhancing the country's national recycling credentials. Policy signals deepen: Mexico City enforced single-use bans in 2025 and the State of Mexico mirrored restrictions, triggering investment in reverse-vending machines and curbside pilots. Low collection rates remain a headwind; however, they are counterbalanced by multinational bottler programs that subsidize community collection centers and public education campaigns.
Competitive Landscape
North America’s polyethylene terephthalate value chain is led by integrated petrochemical majors that combine feedstock, polymerization, and advanced recycling operations. Corporate focus now extends beyond hardware to digital compliance and supply-chain resilience. Indorama Ventures rolled out SAP S/4HANA and AI-supported procurement to synchronize real-time feedstock pricing with finished-resin sales across North American plants. The Circular Action Alliance became the Producer Responsibility Organization for multiple U.S. states, standardizing eco-modulated fees and data-reporting templates that reshape cost curves for converters. Brand owners negotiate multi-year take-or-pay contracts bundling virgin and chemical rPET to hedge availability risks created by step-up recycled-content mandates. Against this backdrop, strategic alliances, capacity rationalizations, and digital-traceability upgrades collectively redefine competitive advantage across the polyethylene terephthalate market.
North America Polyethylene Terephthalate (PET) Industry Leaders
Indorama Ventures Public Company Limited
Alfa S.A.B. de C.V.
Far Eastern New Century Corporation
Formosa Plastics Group (Nan Ya)
Eastman Chemical Company
- *Disclaimer: Major Players sorted in no particular order

Recent Industry Developments
- May 2025: Alfa S.A.B. de C.V. announced the closure of its Cedar Creek PET facility in Fayetteville, North Carolina, effective July 31, 2025. The site had an installed capacity of 170,000 tons of PET resin and 35,000 tons of rPET flake.
- May 2025: Indorama Ventures Public Company Limited is considering resuming construction of its USD 2.3 billion PET and PTA facility in Texas, which is 80% complete but has been paused since 2023 due to cost and labor constraints. The plant would add 1.1 million tonnes of PET.


North America Polyethylene Terephthalate (PET) Market Report Scope
Automotive, Building and Construction, Electrical and Electronics, Industrial and Machinery, Packaging are covered as segments by End User Industry. Canada, Mexico, United States are covered as segments by Country.By End-User Industry
| Packaging |
| Automotive |
| Electrical and Electronics |
| Building and Construction |
| Industrial and Machinery |
By Source Type
| Virgin PET |
| Recycled PET |
By Country
| United States |
| Canada |
| Mexico |
| By End-User Industry | Packaging |
| Automotive | |
| Electrical and Electronics | |
| Building and Construction | |
| Industrial and Machinery | |
| By Source Type | Virgin PET |
| Recycled PET | |
| By Country | United States |
| Canada | |
| Mexico |


Market Definition
- End-user Industry - Building & Construction, Packaging, Automotive, Industrial Machinery, Electrical & Electronics, and Others are the end-user industries considered under the polyethylene terephthalate market.
- Resin - Under the scope of the study, virgin polyethylene terephthalate resin in primary forms such as liquid, powder, pellet, etc. are considered.
| Keyword | Definition |
|---|---|
| Acetal | This is a rigid material that has a slippery surface. It can easily withstand wear and tear in abusive work environments. This polymer is used for building applications such as gears, bearings, valve components, etc. |
| Acrylic | This synthetic resin is a derivative of acrylic acid. It forms a smooth surface and is mainly used for various indoor applications. The material can also be used for outdoor applications with a special formulation. |
| Cast film | A cast film is made by depositing a layer of plastic onto a surface then solidifying and removing the film from that surface. The plastic layer can be in molten form, in a solution, or in dispersion. |
| Colorants & Pigments | Colorants & Pigments are additives used to change the color of the plastic. They can be a powder or a resin/color premix. |
| Composite material | A composite material is a material that is produced from two or more constituent materials. These constituent materials have dissimilar chemical or physical properties and are merged to create a material with properties unlike the individual elements. |
| Degree of Polymerization (DP) | The number of monomeric units in a macromolecule, polymer, or oligomer molecule is referred to as the degree of polymerization or DP. Plastics with useful physical properties often have DPs in the thousands. |
| Dispersion | To create a suspension or solution of material in another substance, fine, agglomerated solid particles of one substance are dispersed in a liquid or another substance to form a dispersion. |
| Fiberglass | Fiberglass-reinforced plastic is a material made up of glass fibers embedded in a resin matrix. These materials have high tensile and impact strength. Handrails and platforms are two examples of lightweight structural applications that use standard fiberglass. |
| Fiber-reinforced polymer (FRP) | Fiber-reinforced polymer is a composite material made of a polymer matrix reinforced with fibers. The fibers are usually glass, carbon, aramid, or basalt. |
| Flake | This is a dry, peeled-off piece, usually with an uneven surface, and is the base of cellulosic plastics. |
| Fluoropolymers | This is a fluorocarbon-based polymer with multiple carbon-fluorine bonds. It is characterized by high resistance to solvents, acids, and bases. These materials are tough yet easy to machine. Some of the popular fluoropolymers are PTFE, ETFE, PVDF, PVF, etc. |
| Kevlar | Kevlar is the commonly referred name for aramid fiber, which was initially a Dupont brand for aramid fiber. Any group of lightweight, heat-resistant, solid, synthetic, aromatic polyamide materials that are fashioned into fibers, filaments, or sheets is called aramid fiber. They are classified into Para-aramid and Meta-aramid. |
| Laminate | A structure or surface composed of sequential layers of material bonded under pressure and heat to build up to the desired shape and width. |
| Nylon | They are synthetic fiber-forming polyamides formed into yarns and monofilaments. These fibers possess excellent tensile strength, durability, and elasticity. They have high melting points and can resist chemicals and various liquids. |
| PET preform | A preform is an intermediate product that is subsequently blown into a polyethylene terephthalate (PET) bottle or a container. |
| Plastic compounding | Compounding consists of preparing plastic formulations by mixing and/or blending polymers and additives in a molten state to achieve the desired characteristics. These blends are automatically dosed with fixed setpoints usually through feeders/hoppers. |
| Plastic pellets | Plastic pellets, also known as pre-production pellets or nurdles, are the building blocks for nearly every product made of plastic. |
| Polymerization | It is a chemical reaction of several monomer molecules to form polymer chains that form stable covalent bonds. |
| Styrene Copolymers | A copolymer is a polymer derived from more than one species of monomer, and a styrene copolymer is a chain of polymers consisting of styrene and acrylate. |
| Thermoplastics | Thermoplastics are defined as polymers that become soft material when it is heated and becomes hard when it is cooled. Thermoplastics have wide-ranging properties and can be remolded and recycled without affecting their physical properties. |
| Virgin Plastic | It is a basic form of plastic that has never been used, processed, or developed. It may be considered more valuable than recycled or already used materials. |


Research Methodology
Mordor Intelligence follows a four-step methodology in all our reports.
- Step-1: Identify Key Variables: The quantifiable key variables (industry and extraneous) pertaining to the specific product segment and country are selected from a group of relevant variables & factors based on desk research & literature review; along with primary expert inputs. These variables are further confirmed through regression modeling (wherever required).
- Step-2: Build a Market Model: In order to build a robust forecasting methodology, the variables and factors identified in Step-1 are tested against available historical market numbers. Through an iterative process, the variables required for market forecast are set and the model is built on the basis of these variables.
- Step-3: Validate and Finalize: In this important step, all market numbers, variables and analyst calls are validated through an extensive network of primary research experts from the market studied. The respondents are selected across levels and functions to generate a holistic picture of the market studied.
- Step-4: Research Outputs: Syndicated Reports, Custom Consulting Assignments, Databases & Subscription Platforms


