Peanut Ingredients Market Size and Share
Market Overview
| Study Period | 2020 - 2030 |
|---|---|
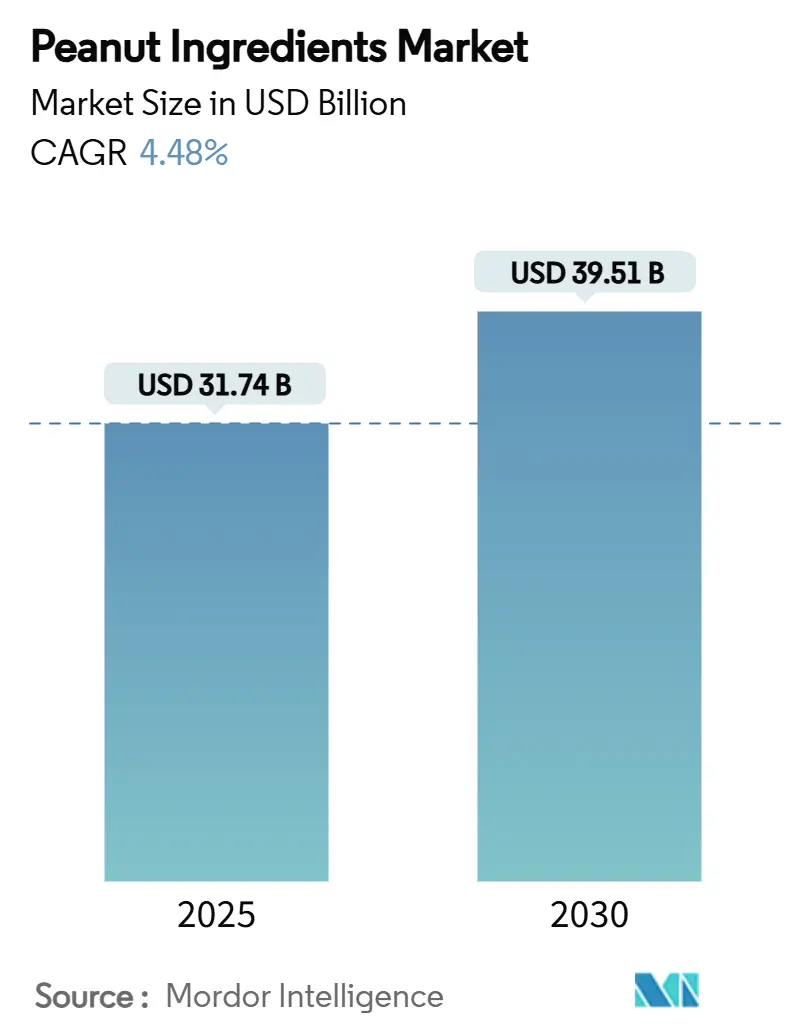
| Market Size (2025) | USD 31.74 Billion |
| Market Size (2030) | USD 39.51 Billion |
| Growth Rate (2025 - 2030) | 4.48% CAGR |
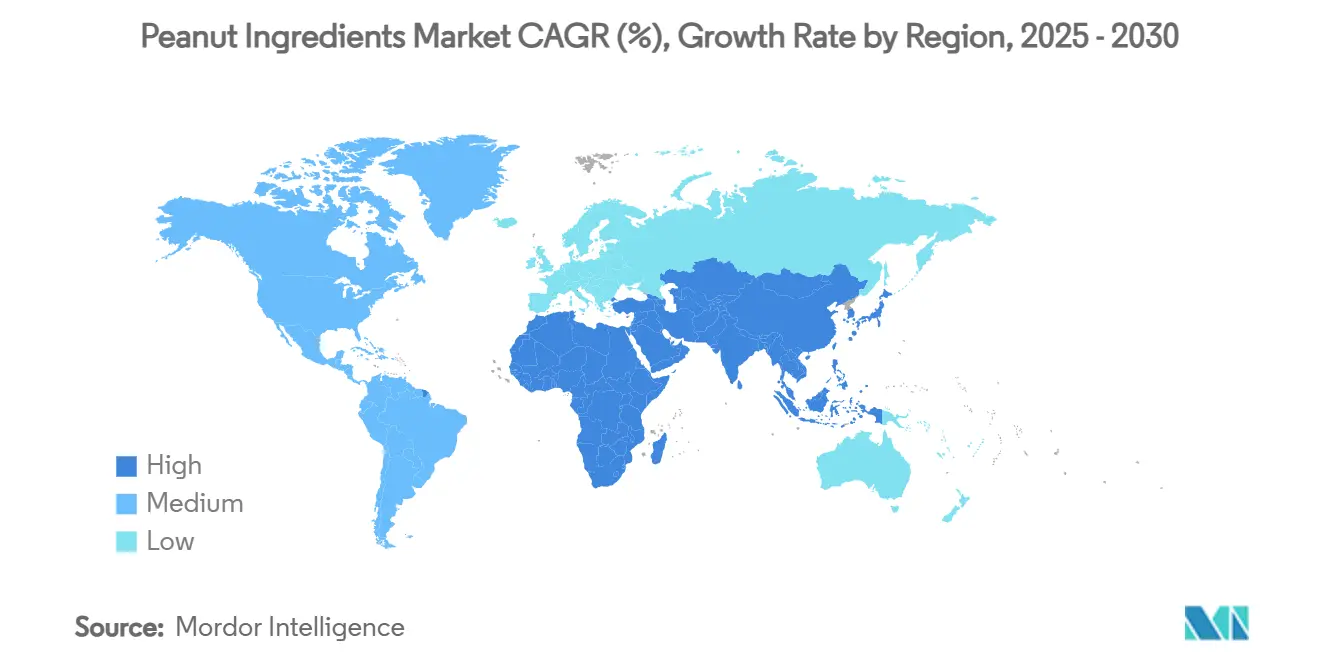
| Fastest Growing Market | Asia Pacific |
| Largest Market | Asia Pacific |
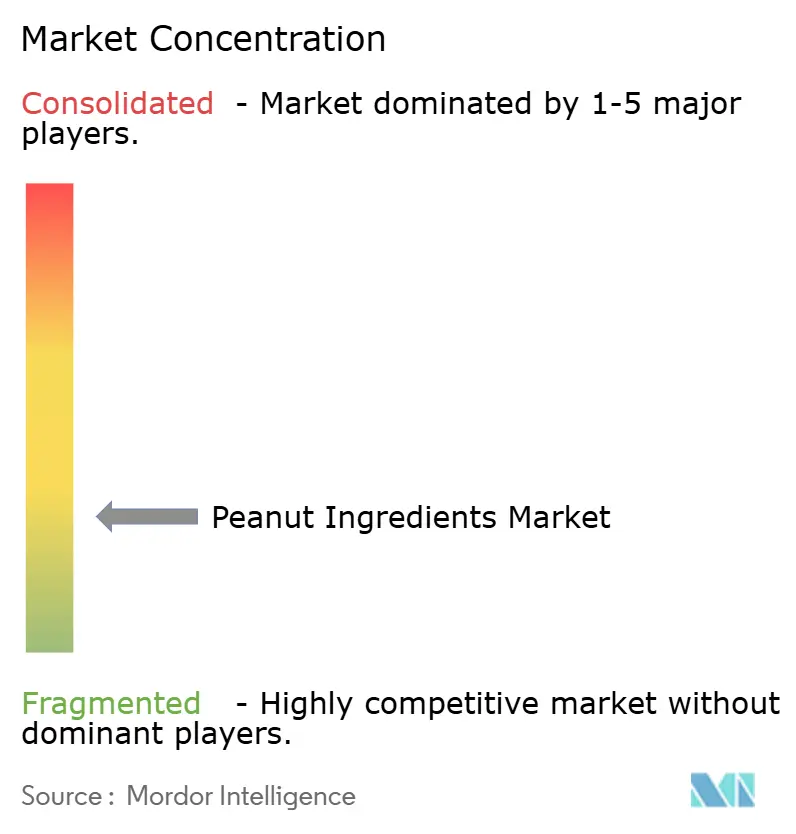
| Market Concentration | Low |
Major Players *Disclaimer: Major Players sorted in no particular order Image © Mordor Intelligence. Reuse requires attribution under CC BY 4.0. | |
Peanut Ingredients Market Analysis by Mordor Intelligence
The peanut ingredients market size stood at USD 31.74 billion in 2025 and is projected to reach USD 39.51 billion in 2030, advancing at a 4.48% CAGR during the forecast period. Consistent consumer shifts toward plant-based nutrition, sustained investment in precision sorting technologies that deliver aflatoxin-free kernels, and tightening sustainability standards are reinforcing a stable growth runway. Asia-Pacific’s consumption surge, ongoing varietal research targeting high-oleic profiles, and escalating demand for up-cycled fibers further strengthen market fundamentals. At the same time, regulatory scrutiny around allergens and mycotoxins acts as a quality catalyst rather than a brake, rewarding compliant suppliers with premium pricing power. Competitive intensity remains moderate because fragmented production structures allow regional specialists to coexist with global agribusiness majors.
Key Report Takeaways
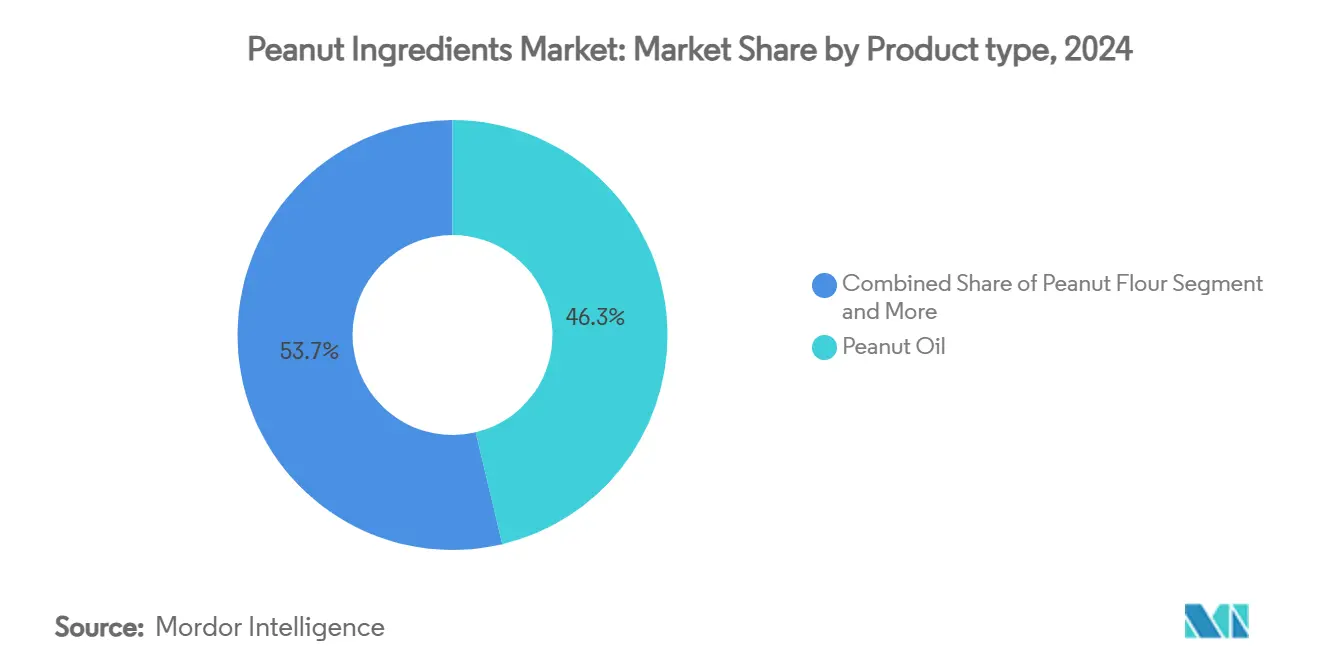
- By product type, peanut oil led with 46.28% of peanut ingredients market share in 2024; peanut protein and isolate are forecast to grow at a 9.25% CAGR to 2030.
- By form, liquid ingredients accounted for 50.61% of the peanut ingredients market size in 2024, while powder ingredients are projected to expand at a 9.83% CAGR through 2030.
- By end-user industry, food and beverage manufacturing held 61.38% of the peanut ingredients market share in 2024; personal care and cosmetics are pacing ahead at a 7.61% CAGR to 2030.
- By geography, Asia-Pacific commanded 38.19% of 2024 revenues and is also the fastest-growing region with a 6.18% CAGR forecast through 2030.
Global Peanut Ingredients Market Trends and Insights
Drivers Impact Analysis*
| Driver | (~) % Impact on CAGR Forecast | Geographic Relevance | Impact Timeline |
|---|---|---|---|
| Rising demand for high-oleic peanut oil in Asian foodservice | +0.8% | Asia-Pacific core, spill-over to North America | Medium term (2-4 years) |
| Growth of plant-based protein and clean-label snacks | +0.9% | Global, with early gains in North America & EU | Long term (≥ 4 years) |
| Emerging middle-class in Africa & South-East Asia driving nut-based spreads | +0.6% | APAC & MEA, concentrated in urban centers | Long term (≥ 4 years) |
| Adoption of peanut hull fiber as up-cycled functional ingredient | +0.4% | Global, led by sustainability-focused markets | Medium term (2-4 years) |
| Rapid scale-up of precision-sorted aflatoxin-free kernels for EU exports | +0.5% | Global exporters to EU, US producers benefit most | Short term (≤ 2 years) |
| Carbon-negative peanut cultivation pilots attracting CPG off-take deals | +0.3% | North America & Brazil, expanding to other regions | Long term (≥ 4 years) |
| Source: Mordor Intelligence | |||
Rising demand for high-oleic peanut oil in Asian foodservice
Asia’s quick-service and full-service restaurant operators prize frying media that endures repeated heat cycles. High-oleic peanut oil delivers oxidative stability 25% superior to conventional grades, extending replacement intervals and lowering total oil spend. India’s Girnar-4 and Girnar-5 varieties contain 78.9%-80.7% oleic acid, cutting stabilizer use in packaged foods and easing clean-label formulation. Georgia’s USDA-backed USD 490,000 research program deepens the trait pipeline and embeds climate resilience attributes that stabilize supply[1]University of Georgia, “CAES Experts Study Oil Production,” newswire.caes.uga.edu. As Asia-Pacific urbanization accelerates, chain restaurants standardize ingredient specifications, making certified high-oleic oil a procurement prerequisite. Suppliers that guarantee aflatoxin compliance and oxidative stability outperform in large tenders.
Growth of plant-based protein and clean-label snacks
Peanut protein concentrates provide 17%-40% protein, out-scoring many legumes while retaining a mainstream flavor that requires minimal masking[2]MDPI Editors, “Alternative Protein Sources—An Overview,” mdpi.com. Allergen guidance effective January 2025 clarifies labeling for highly refined peanut ingredients, reducing reformulation risk for CPG innovators. Food-grade flours and isolates enrich bar, cookie, and beverage recipes at up to 25% inclusion without texture penalties, unlocking cost savings against pea or almond protein. Inclusion of 5% peanut skin powder allows “good source of fiber” claims, broadening label appeal. Demand intensifies in North America and Western Europe, where retailer private-label lines champion short, recognizable ingredient decks.
Emerging middle-class in Africa & South-East Asia driving nut-based spreads
Developing Asia’s middle class rose from 21% of the population in 1990 to 56% in 2008 and will exceed 5.4 billion people by 2030, lifting annual food expenditure to USD 63 trillion. As disposable incomes climb, shoppers trade up from staple cereals to protein-rich spreads that fit modern breakfast habits. Ghana’s fortified groundnut spreads, certified aflatoxin-safe, illustrate local processing gains that keep value addition in origin countries. China’s tree-nut intake is growing 5% annually, with per-capita consumption on track for 1 kg by 2030, signaling spill-over demand for peanut-based products. Brands able to pivot pack sizes and flavors to regional palates secure early-mover advantages.
Adoption of peanut hull fiber as up-cycled functional ingredient
Peanut hulls represent 21%-29% of pod weight and generated 9.4 million t globally in 2017, yet were historically burned or landfilled. Novel milling and steam-explosion methods create fine, flavor-neutral fibers that boost total dietary fiber in bread by 42% without degrading loaf volume. Adsorption studies show hull powders remove up to 88.6% of cadmium from aqueous food extracts, hinting at future nutraceutical applications. Sustainability-centric retailers value the circular-economy narrative, helping processors negotiate shelf-space premiums. Side-stream valorization also offsets waste-disposal fees, improving processor margins by 1-2 percentage points.
Restraints Impact Analysis*
| Restraint | (~) % Impact on CAGR Forecast | Geographic Relevance | Impact Timeline |
|---|---|---|---|
| Heightened allergen-labeling regulations | -0.7% | North America & EU | Short term (≤ 2 years) |
| Volatile farm-gate prices & weather-linked supply swings | -0.9% | Global producing regions | Medium term (2-4 years) |
| Competition from chickpea & seed-butter alternatives | -0.5% | Global health-conscious markets | Long term (≥ 4 years) |
| Rising mycotoxin-testing costs for China exports | -0.4% | Exporters to China | Short term (≤ 2 years) |
| Source: Mordor Intelligence | |||
Heightened allergen-labeling regulations in North America & EU
FDA final guidance effective January 2025 compels manufacturers to disclose highly refined peanut oils in ingredient lists, while exempting them from “Contains” panels, adding pack-design complexity and revalidation costs[3]Allergy Force, “2025 FDA Guidance on Allergen Food Labeling,” allergyforce.com. The USDA Allergen Verification Sampling Program, launched in September 2024, intensifies audit frequency of “peanut-free” claims, with non-compliance triggering recalls. In the EU, January 2026 cross-contact rules require documented risk assessments before precautionary labeling, obligating additional hygienic zoning investments. Smaller exporters lacking in-house regulatory expertise risk margin erosion.
Volatile farm-gate prices & weather-linked supply swings
Extreme heat and drought shrank 2024 Alabama yields and caused premature nut drop, echoing USD 50 million in annual drought losses across the U.S. belt. NOAA records show spot prices widening from USD 2.00/lb to USD 2.80/lb during prior drought cycles, jolting processor input costs. Fertilizer and labor inflation further compressed 2023 farmer margins even as acreage climbed 12.9%. Manufacturers respond by boosting safety stocks, tying up working capital.
*Our forecasts treat driver/restraint impacts as directional, not additive. The impact forecasts reflect baseline growth, mix effects, and variable interactions.
Segment Analysis
By Product Type: Oil Dominance Meets Protein Innovation
Peanut oil contributed 46.28% of 2024 revenue, reinforcing the peanut ingredients market size leadership of liquid fats in both culinary and pharmaceutical channels. High-oleic breeding programs in Georgia and India improve oxidative life by up to 1.7 times, a key differentiator for QSR frying lines. In industrial uses, the oil’s non-allergenic refined grades serve as carriers in injectables listed in the FDA’s Inactive Ingredients Database. Supply chains capitalize on WHO-aligned trans-fat elimination, an area where Cargill invested USD 8.5 million to retrofit refineries.
Peanut protein and isolate, the fastest-growing slice of the peanut ingredients market, is forecast at a 9.25% CAGR to 2030. Food technologists value its 2.9 PDCAAS score coupled with familiar flavor, enabling up to 30% cost savings compared with almond protein in bar formulations. Spray-drying advances curb Maillard browning, expanding use in neutral-taste RTD beverages. The FDA’s clearer allergen rules have reduced reformulation hesitance, unlocking new beverage and bakery lines for mainstream brands. Together, oil and protein segments illustrate the dual track toward traditional volume drivers and value-added ingredients in the peanut ingredients market.


By End-User Industry: Manufacturing Scale Drives Personal Care Growth
Food and beverage manufacturing captured 61.38% of 2024 consumption, underlining the peanut ingredients market share dominance of mass-scale processors reliant on predictable supply. Skippy’s double-digit volume gains during Hormel’s FY 2024 reflect sustained household penetration, while bakery chains integrate peanut oil in shortenings to meet trans-fat targets. Integrating hull fiber into breads lifts insoluble fiber content 35%, meeting retailer wellness scorecards with minimal recipe disruption.
Personal care and cosmetics, advancing at 7.61% CAGR, are emerging as a springboard for higher-margin derivatives. Pharmaceutical-grade peanut oil’s emollient performance positions it in anti-aging serums, and in 2025, the ingredient earned EcoCert approval, widening its use in clean-beauty SKUs. Antioxidant studies confirm free-radical scavenging capacity increases up to 38% when blended with vitamin E, supporting skin-health claims. Niche formulators source cold-pressed grades at USD 6/kg, three times the refined edible price, illustrating the premium potential within the peanut ingredients market.
By Form: Liquid Leadership Challenged by Powder Innovation
Liquid ingredients—chiefly oil—represented 50.61% of 2024 demand and remain the logistics backbone of the peanut ingredients market size, owing to mature storage infrastructure and bulk tanker economics. Restaurant chains report 12% lower annual oil purchases after switching to high-oleic varieties, reflecting durability gains that reinforce cost leadership.
Powder ingredients are expanding fastest at 9.83% CAGR. Low-fat peanut flour with 52% protein provides natural thickening and enables “protein added” front-of-pack claims. B2B sports-nutrition brands double up flavors with chocolate-coated peanut protein inclusions that mask earthy notes common in pea protein. Ground skin inclusions raise ORAC antioxidant values by 19%, presenting a functional-plus-flavor hook. Powder’s lightweight nature slashes freight cost per protein unit, further enticing exporters.

Geography Analysis
In 2024, the Asia-Pacific region secures a commanding 38.19% share of the market, while outpacing others with a projected 6.18% CAGR growth rate through 2030. This growth underscores the region's robust production capabilities and swiftly rising consumption trends. China's tree nut consumption has grown 5% annually over the last five years, with per-capita intake projected to reach 1 kilogram by 2030, signaling market expansion beyond traditional patterns. The burgeoning middle class in developing Asia, which surged from 21% of the population in 1990 to 56% in 2008, continues to expand, driving demand for premium food offerings. The peanut ingredients market in Asia-Pacific benefits from balanced supply and demand. China's growing tree nut appetite, projected to hit 1 kg per capita by 2030, is fueling demand for downstream ingredients in confectionery and snacks. In India, Girnar-series high-oleic seeds cater to a street-food culture reliant on multiple oil cycles. Southeast Asian quick-service restaurant chains, expanding at double-digit rates, are incorporating peanut-based sauces inspired by local cuisines, broadening their usage beyond spreads.
North America stands as a hub for technology and branding. In Georgia, precision sorters have reduced aflatoxin rejections by two-thirds, ensuring premium market access to the EU and Japan. A regenerative farming collaboration between ADM and Smucker’s spans 202,000 acres, targeting a 30% greenhouse gas reduction by 2030. In response to weather volatility, R&D focuses on drought-tolerant phenotypes, with the USDA allocating an additional USD 18 million for peanut genomic research in FY 2025. Europe prioritizes safety and sustainability. Retailers mandate aflatoxin certificates for every lot, pushing processors to adopt near-infrared monitoring at intake. Cross-contact allergen regulations set for 2026 are driving plant layout redesigns, raising capex but offering reputational benefits. Mediterranean restaurants increasingly favor high-oleic oils for their extended shelf life and neutral flavor.
South America's harvests provide a hedge against supply fluctuations. Brazil's 40.6% production surge positions it to bridge gaps in the Asian summer shipping window. Argentina's investment in double-crop systems enhances land-use efficiency, bolstering export stability. In Africa, nations like Ghana and Nigeria focus on kernel roasting and spread production, ensuring a larger share of GDP remains within their borders.

Competitive Landscape
Competitive intensity is fragmented in the peanut ingredients market because no single supplier commands more than 10% of global revenues. Integrated conglomerates like ADM, Olam Group, and Cargill leverage farm-gate procurement, crushing, and R&D to maximize economies of scale across multiple ingredient categories. Olam’s Ingredients & Solutions arm lifted EBIT 71.5% to SGD 475.5 million in H1 2024, helped by margin management in nuts. Cargill’s USD 8.5 million refinery upgrades allow it to meet WHO trans-fat limits ahead of peers, capturing reformulation contracts with more than 100 food customers.
Strategic alliances shape differentiation. ADM partners with Smucker on regenerative farming, securing longer-term supply visibility while sharing the cost of agronomic interventions. Mid-tier processors such as Golden Peanut & Tree Nuts invest in color-sorter retrofits that elevate EU compliance rates and open new specialty-roast SKUs. White-space innovators focus on hull-fiber extraction and cold-pressed cosmetic oils, attracting venture capital that seeks impact-linked returns.
Regional specialists maintain relevance by tailoring formats. Chinese mills supply skin-on kernels preferred for local confectionery, while Vietnamese exporters carve a niche in vacuum-fried snacks. African SMEs secure fair-trade certifications that win shelf space in European ethical-food chains. Collectively, these dynamics produce a market concentration score of 3, reflecting fragmentation that favors both global and local champions.
Peanut Ingredients Industry Leaders
Olam International
Archer Daniels Midland Company
Cargill Incorporated
Wilmer International
Shandong Luhua Group
- *Disclaimer: Major Players sorted in no particular order

Recent Industry Developments
- July 2024: Alpino Health Food, the sole global player in peanut protein, has unveiled India's inaugural 100% peanut-based protein powder, poised to revolutionize the nation's health sector. Crafted in the Netherlands, this groundbreaking product establishes a fresh benchmark, offering a premium alternative to conventional protein supplements, suitable for universal consumption.
- June 2023: Goa's first Organic Food Company Ambrosia Organic Farm, introduced world's first mango-flavored peanut butter.


Global Peanut Ingredients Market Report Scope
| Peanut Oil |
| Peanut Butter and Spreads |
| Peanut Flour |
| Peanut Protein and Isolate |
| Others |
| Food and Beverage Manufacturing | Bakery and Confectionery |
| Snacks and Nutrition Bars | |
| Dairy Alternatives and Beverages | |
| Sauces, Dressings and Ready-Meals | |
| Retail/Household | Supermarkets/Hypermarkets |
| Convenience Stores | |
| Online Retailers | |
| Others | |
| Personal Care and Cosmetics | |
| Animal Feed and Pet Food | |
| Food service |
| Liquid |
| Powder |
| Granular/Pieces |
| North America | United States |
| Canada | |
| Mexico | |
| Rest of North America | |
| Europe | Germany |
| United Kingdom | |
| Italy | |
| France | |
| Spain | |
| Netherlands | |
| Russia | |
| Belgium | |
| Sweden | |
| Rest of Europe | |
| Asia-Pacific | China |
| India | |
| Japan | |
| Australia | |
| Indonesia | |
| South Korea | |
| Thailand | |
| Singapore | |
| Rest of Asia-Pacific | |
| South America | Brazil |
| Argentina | |
| Chile | |
| Peru | |
| Rest of South America | |
| Middle East and Africa | South Africa |
| Saudi Arabia | |
| United Arab Emirates | |
| Nigeria | |
| Egypt | |
| Iran | |
| Turkey | |
| Rest of Middle East and Africa |
| Product Type | Peanut Oil | |
| Peanut Butter and Spreads | ||
| Peanut Flour | ||
| Peanut Protein and Isolate | ||
| Others | ||
| End User Industry | Food and Beverage Manufacturing | Bakery and Confectionery |
| Snacks and Nutrition Bars | ||
| Dairy Alternatives and Beverages | ||
| Sauces, Dressings and Ready-Meals | ||
| Retail/Household | Supermarkets/Hypermarkets | |
| Convenience Stores | ||
| Online Retailers | ||
| Others | ||
| Personal Care and Cosmetics | ||
| Animal Feed and Pet Food | ||
| Food service | ||
| Form | Liquid | |
| Powder | ||
| Granular/Pieces | ||
| Geography | North America | United States |
| Canada | ||
| Mexico | ||
| Rest of North America | ||
| Europe | Germany | |
| United Kingdom | ||
| Italy | ||
| France | ||
| Spain | ||
| Netherlands | ||
| Russia | ||
| Belgium | ||
| Sweden | ||
| Rest of Europe | ||
| Asia-Pacific | China | |
| India | ||
| Japan | ||
| Australia | ||
| Indonesia | ||
| South Korea | ||
| Thailand | ||
| Singapore | ||
| Rest of Asia-Pacific | ||
| South America | Brazil | |
| Argentina | ||
| Chile | ||
| Peru | ||
| Rest of South America | ||
| Middle East and Africa | South Africa | |
| Saudi Arabia | ||
| United Arab Emirates | ||
| Nigeria | ||
| Egypt | ||
| Iran | ||
| Turkey | ||
| Rest of Middle East and Africa | ||


Key Questions Answered in the Report
How fast is demand for peanut protein expected to grow through 2030?
Peanut protein and isolate are projected to rise at a 9.25% CAGR through 2030, outpacing all other product categories.
Which region currently leads global consumption of peanut ingredients?
Asia-Pacific held 38.19% of 2024 revenues and is expanding fastest at a 6.18% CAGR to 2030.
What share of 2024 revenues came from food and beverage manufacturers?
Food and beverage manufacturers accounted for 61.38% of spending on peanut ingredients in 2024.
Why are high-oleic varieties important for foodservice operators?
High-oleic peanut oil offers up to 25% better oxidative stability than conventional grades, extending fry life and lowering operating costs.
How do allergen regulations affect smaller exporters?
New FDA and EU rules require detailed labeling and cross-contact controls that demand capital investments, compressing margins for smaller suppliers.
Page last updated on:


