Pea Processed Ingredients Market Size and Share
Market Overview
| Study Period | 2021 - 2031 |
|---|---|
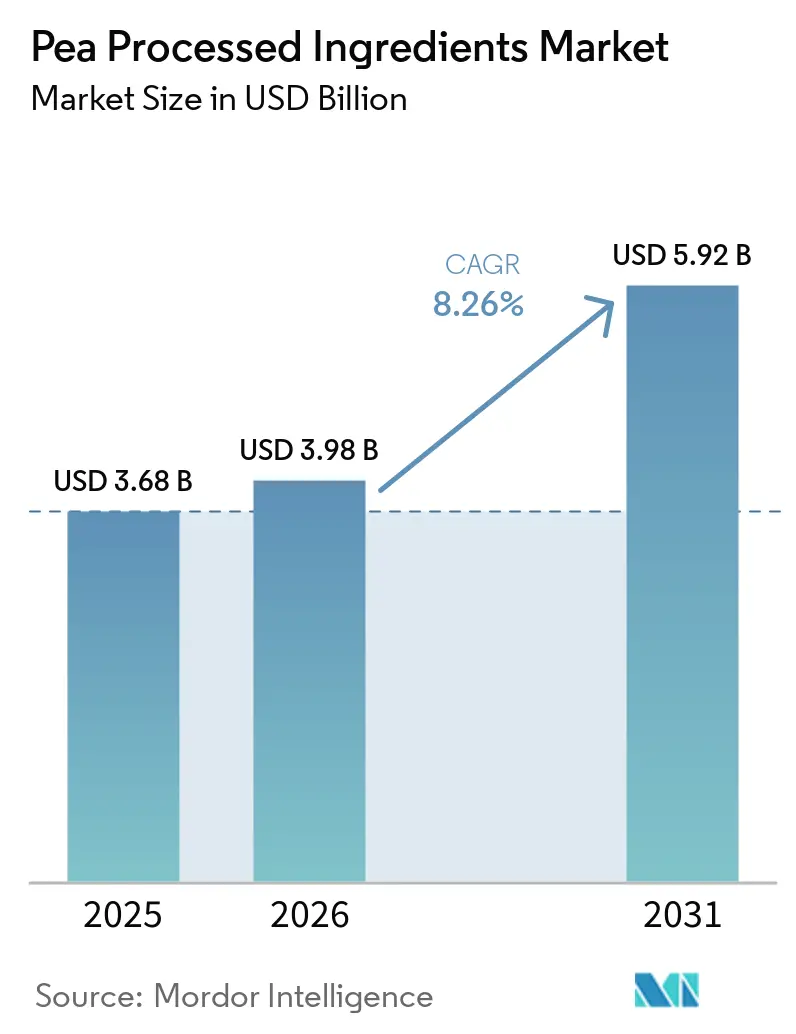
| Market Size (2026) | USD 3.98 Billion |
| Market Size (2031) | USD 5.92 Billion |
| Growth Rate (2026 - 2031) | 8.26% CAGR |
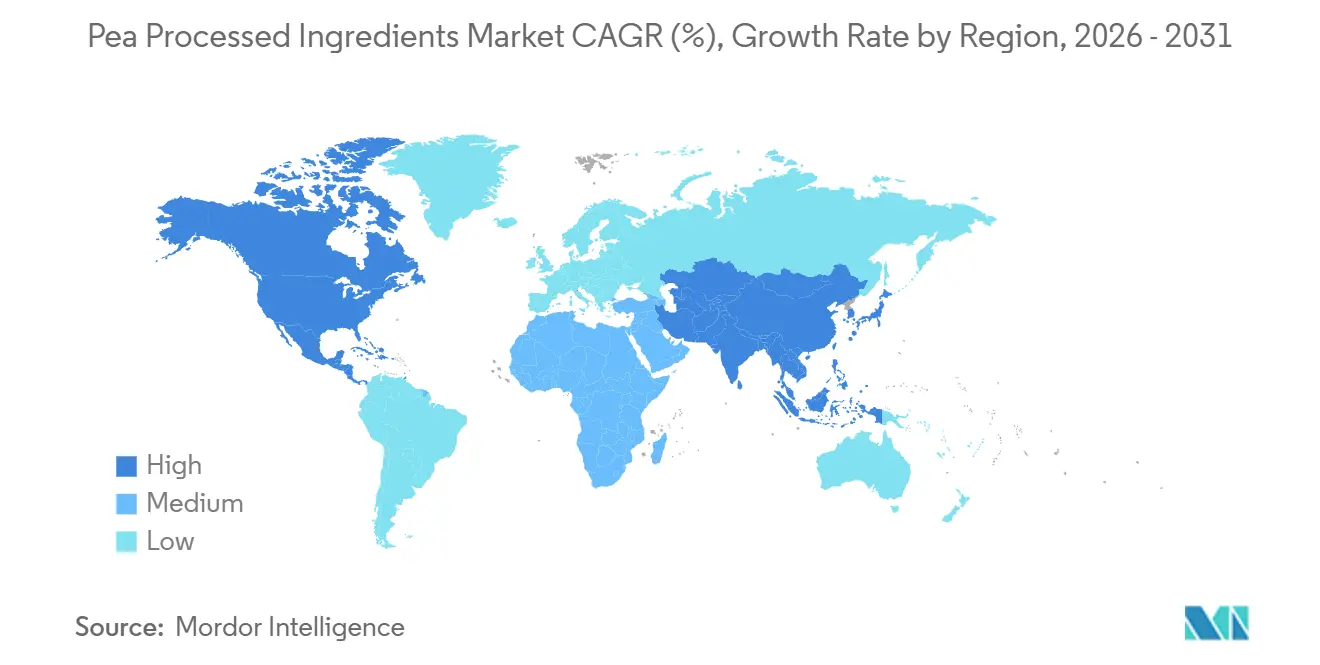
| Fastest Growing Market | Asia-Pacific |
| Largest Market | North America |
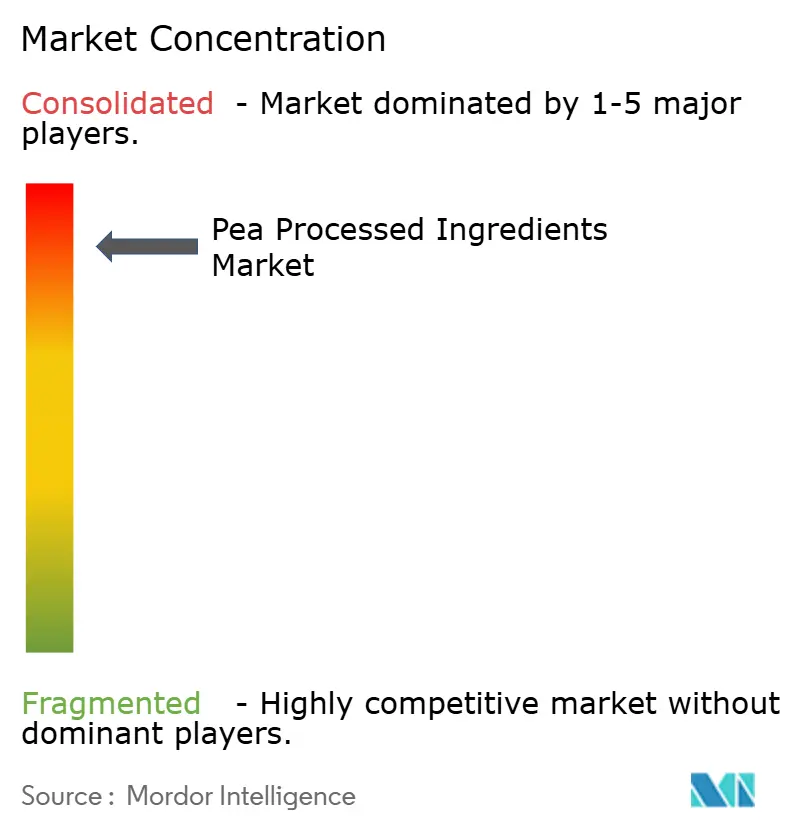
| Market Concentration | High |
Major Players
*Disclaimer: Major Players sorted in no particular order Image © Mordor Intelligence. Reuse requires attribution under CC BY 4.0. |
|
Pea Processed Ingredients Market Analysis by Mordor Intelligence
The pea processed ingredients market is anticipated to grow significantly, increasing from USD 3.68 billion in 2025 and USD 3.98 billion in 2026 to USD 5.92 billion by 2031. This represents a compound annual growth rate (CAGR) of 8.26% during the forecast period from 2026 to 2031. The market's growth is largely driven by rising demand for plant-based protein ingredients, which are increasingly used in products such as meat substitutes, dairy alternatives, baked goods, snacks, and specialized nutrition items. By type, protein remains the leading segment due to its widespread application, while fiber is gaining momentum as a high-growth category, particularly in health-oriented products. In terms of nature, conventional pea ingredients dominate the market; however, the growing preference for organic products is reshaping the market dynamics, as consumers are willing to pay more for organic options. The market is highly consolidated, with a few key players holding a significant share. This consolidation impacts competition and drives innovation, as companies strive to differentiate their offerings and meet evolving consumer demands.
Key Report Takeaways
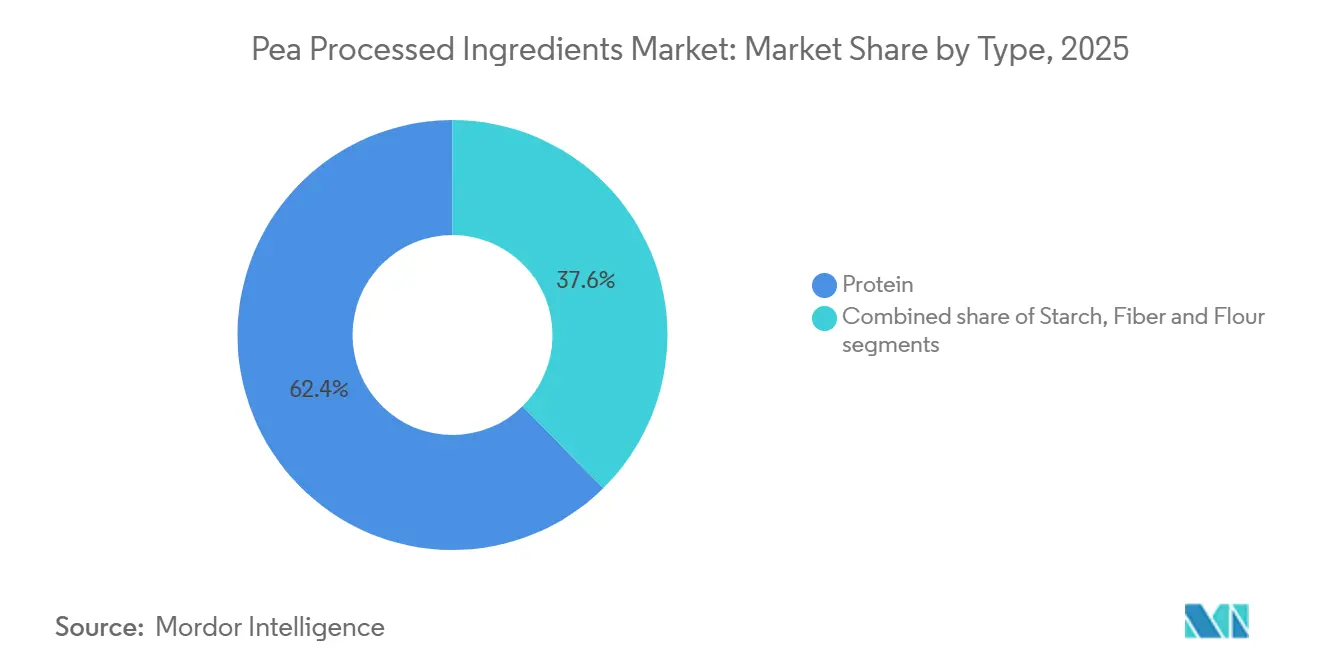
- By type, protein held 62.36% of the pea processed ingredients market share in 2025, while fiber is projected to expand at a 9.01% CAGR through 2031.
- By nature, conventional accounted for 80.92% of demand in 2025, while organic is forecast to grow at an 8.15% CAGR through 2031.
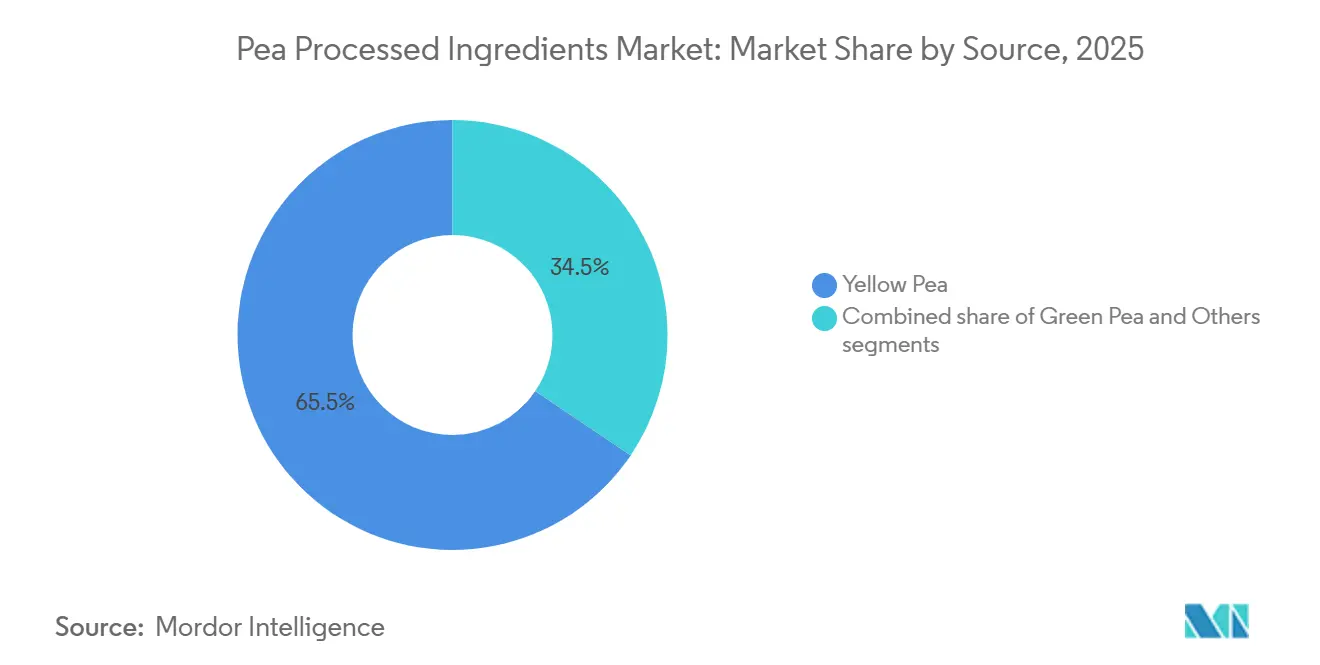
- By source, yellow pea led with 65.54% share in 2025, while green pea is expected to grow at an 8.59% CAGR through 2031.
- By application, food and beverage accounted for 72.33% of the pea-processing ingredients market in 2025, while nutraceuticals and supplements are advancing at an 8.98% CAGR through 2031.
- By geography, North America held 32.66% share in 2025, while Asia-Pacific is projected to expand at a 9.25% CAGR through 2031.
Note: Market size and forecast figures in this report are generated using Mordor Intelligence’s proprietary estimation framework, updated with the latest available data and insights as of January 2026.
Global Pea Processed Ingredients Market Trends and Insights
Drivers Impact Analysis*
| Driver | (~) % Impact on CAGR Forecast | Geographic Relevance | Impact Timeline |
|---|---|---|---|
| Surging Appetite for Plant-Based Diets | +2.0% | Global, with peak demand in North America and Europe | Short term (≤ 2 years) |
| Heightened Interest in Alternative Meat and Dairy Products | +1.8% | North America, Europe, and urban Asia-Pacific | Medium term (2-4 years) |
| Innovations in Processing Technology | +1.4% | Global, with Research and Development hubs in France, Canada, and the United States | Long term (≥ 4 years) |
| Government and Industry Backing for Sustainability Initiatives | +1.1% | North America, Europe, and emerging Asia-Pacific markets | Medium term (2-4 years) |
| Allergen-Friendly and Hypoallergenic Properties | +0.8% | Global, most pronounced in North America and Japan | Short term (≤ 2 years) |
| Expansion into Ready-to-Eat and Convenience Foods | +0.7% | Asia-Pacific and North America, with spillover to Middle East and Africa | Medium term (2-4 years) |
| Source: Mordor Intelligence | |||
Surging appetite for plant-based diets
The global pea processed ingredients market is witnessing significant growth, driven by the increasing adoption of plant-based diets and consumers' growing inclination toward sustainable, nutrient-rich food options. Pea-derived ingredients, such as protein, starch, and fiber, are increasingly popular across applications, including meat substitutes, dairy-free products, bakery items, and functional foods. This trend is attributed to their high nutritional value and suitability for individuals with allergies. According to the World Animal Foundation, the global vegan population is projected to reach approximately 88 million by 2026, underscoring the growing consumer shift toward plant-based nutrition[1]Source: World Animal Foundation, "How Many Vegans Are in the World in 2026? Latest Vegan Stats", worldanimalfoundation.org. Additionally, the growing number of flexitarians individuals who primarily consume plant-based foods while occasionally including animal products is further fueling demand. This shift in dietary preferences is encouraging food manufacturers to incorporate pea-based ingredients into a wider range of products, thereby expanding their application scope and market potential.
Heightened interest in alternative meat and dairy products
The increasing demand for plant-based meat and dairy alternatives is driving substantial growth in the global pea processed ingredients market. Pea protein, starch, and fiber are extensively utilized in various applications, including meat substitutes, non-dairy beverages, vegan cheese, and yogurt, due to their high nutritional value and functional versatility. The global adoption of these products is steadily rising. For example, data from the Good Food Institute as of May 2024 revealed that 26% of Brazilians consumed plant-based meat alternatives at least once a month, while 48% consumed plant-based milk and dairy alternatives monthly[2]Source: Good Food Institute, "The Brazilian Consumer and the Plant-Based Market 2024", gfi.org.br. This growing trend is motivating food manufacturers to diversify their plant-based product portfolios and incorporate pea-derived ingredients more widely. Furthermore, advancements in pea protein processing technologies are enhancing key attributes such as texture, flavor, and emulsification properties, making pea-based ingredients increasingly suitable for premium food and beverage formulations.
Government and industry backing for sustainability initiatives
Increasing public and private investments in sustainable protein infrastructure are significantly driving the growth of the global pea processed ingredients market. For instance, in July 2025, Protein Industries Canada announced a CAD 48.7 million collaborative project with Louis Dreyfus Company (LDC) and the Canadian Digestive Health Foundation Innovation Center (CDIC)[3]Source: Protein Industries Canada, "Investment into Saskatchewan Pea Protein Processing to Create New Canadian Food Options", proteinindustriescanada.ca. This initiative aims to support the development and commercialization of pea protein ingredients. A key component of this investment is LDC’s new pea protein isolate facility in Yorkton, Saskatchewan, which is poised to enhance domestic processing capabilities and create expanded market opportunities for Canadian pea growers. Such investments are fostering innovation, boosting processing capacity, and ensuring a steady supply of sustainable plant-based ingredients. Furthermore, these government-backed initiatives are playing a crucial role in strengthening supply chain resilience, promoting sustainability, and driving the long-term expansion of the pea processed ingredients market.
Innovations in processing technology
Technological advancements in processing methods are significantly enhancing the functionality and expanding the application range of pea-based ingredients, thereby driving the growth of the global pea processed ingredients market. Manufacturers are increasingly focusing on innovative extraction and texturization techniques to improve critical attributes such as taste, texture, solubility, and overall product performance. For example, in February 2026, Roquette introduced NUTRALYS Pea 850F, a pea protein specifically developed to minimize undesirable vegetal notes while enhancing sensory appeal in various food applications. Furthermore, the adoption of dry fractionation technology is gaining momentum, as it not only improves production efficiency but also reduces the environmental footprint compared to traditional wet processing methods. These advancements in protein texturization and ingredient functionality are enabling pea-based ingredients to meet the stringent performance requirements of diverse applications, including meat alternatives, dairy substitutes, and other high-value food products.
Restraint Impact Analysis*
| Restraint | (~) % Impact on CAGR Forecast | Geographic Relevance | Impact Timeline |
|---|---|---|---|
| Fluctuations in Supply Chains and Raw Materials | -1.0% | North America and Europe, with spillover to Asia-Pacific import-dependent markets | Medium term (2-4 years) |
| Competition from Alternative Proteins | -0.9% | Global, most pronounced in North America and Asia-Pacific sports nutrition | Short term (≤ 2 years) |
| Concerns over Labeling and Regulations | -0.5% | Europe and China, with emerging complexity in Asia-Pacific | Medium term (2-4 years) |
| Limitations in Functionality and Sensory Appeal | -0.7% | Global, most acute in clear beverage and high-acid applications | Short term (≤ 2 years) |
| Source: Mordor Intelligence | |||
Fluctuations in supply chains and raw materials
The pea processed ingredients market is facing significant challenges due to fluctuations in yellow pea supply, volatile raw material prices, and shifting trade policies. As the market heavily relies on stable pea production, adverse weather conditions, inconsistent crop yields, and supply chain disruptions can severely affect raw material availability and escalate procurement costs. Furthermore, international trade restrictions, including tariffs and anti-dumping measures, add another layer of complexity by hindering cross-border sourcing and creating pricing uncertainties for manufacturers. In addition to supply chain issues, the production of pea-based ingredients, particularly through wet fractionation processes, presents its own set of challenges. These processes are resource-intensive, requiring substantial operational expenditures and effective wastewater management systems, which place additional financial strain on producers. Such high production costs, combined with supply instability, pose significant barriers to market growth and profitability.
Competition from alternative proteins
The growing adoption of alternative plant-based proteins is posing challenges to the pricing power and market share growth of the global pea processed ingredients market. Food manufacturers assess protein ingredients based on several factors, including cost-effectiveness, taste, functionality, nutritional benefits, and formulation versatility. This has intensified competition from other protein sources such as soy, fava beans, chickpeas, lentils, mycoprotein, and fermentation-derived proteins. Among these, soy protein holds a significant competitive edge due to its well-established supply chain, large-scale production capabilities, and cost efficiency. Additionally, the increasing use of blended protein formulations is reducing dependency on single-source pea ingredients, further impacting the market. As consumer preferences shift toward improved taste and texture in plant-based products, manufacturers are compelled to invest heavily in product innovation and sensory enhancements. While these efforts are essential to meet consumer demands, they also lead to higher development costs, creating obstacles in maintaining competitive pricing and securing a larger market share.
*Our forecasts treat driver/restraint impacts as directional, not additive. The impact forecasts reflect baseline growth, mix effects, and variable interactions.
Segment Analysis
By Type: Protein Dominates, Fiber Emerges as the High-Growth Fraction
In 2025, pea protein led the global pea-processed ingredients market, accounting for 62.36% of the total market value. This dominance is due to its widespread use in products like meat substitutes, dairy alternatives, and sports nutrition, where its functional properties, such as emulsification, gelation, foaming, and water-binding, are essential. Additionally, high-protein isolates, which contain over 80% protein, have become popular in premium applications because of their neutral flavor and stable solubility, making them suitable for a variety of formulations.
Pea fiber is expected to grow at the fastest rate in the global pea processed ingredients market, with a CAGR of 9.01% projected through 2031. This growth is fueled by rising consumer demand for products that support digestive health and weight management. Pea fiber is increasingly being used in functional food formulations due to its health benefits. Furthermore, its cost-effectiveness, as it is often derived as a by-product of protein processing, has encouraged its adoption across various industries, making it a versatile and economical ingredient.


By Nature: Conventional Leads, Organic Premiumization Reshapes Margins
In 2025, conventional pea ingredients held the largest share of the global pea processed ingredients market, accounting for 80.92% of the total market. This dominance is attributed to their widespread use in large-scale food and beverage production, as well as in animal nutrition. These ingredients are preferred due to their cost-effectiveness and suitability for bulk purchasing. Additionally, conventional pea ingredients benefit from well-established supply chains and greater availability in key production regions, making them a reliable choice for manufacturers.
On the other hand, organic pea ingredients are expected to grow at the fastest rate, with a projected CAGR of 8.15% through 2031. The increasing demand for clean-label, non-GMO, and sustainably sourced products is driving the popularity of organic options in food, beverages, and nutritional products. Consumers are increasingly willing to pay a premium for organic products, especially in health-focused categories. This trend, combined with the growing availability of organic pea ingredients, is fueling their rapid expansion in the global market.
By Source: Yellow Pea Sustains the Core Base, Green Pea Builds Niche Growth
Yellow pea held the largest share of the global pea processed ingredients market in 2025, contributing 65.54% to the total market. This dominance is attributed to its suitability for industrial processing, offering higher protein yields and a milder flavor profile. Additionally, the presence of well-established wet-fractionation facilities in key producing countries like Canada, France, and China has further boosted its adoption. These factors have made yellow pea a preferred ingredient for food, beverages, and nutritional products worldwide.
Green pea is expected to be the fastest-growing source segment, with a projected CAGR of 8.59% through 2031. This growth is driven by rising consumer interest in locally sourced legumes, particularly in Europe and the Asia-Pacific. The rising demand for premium plant-based ingredients and the nutritional benefits of green peas, such as their flavonoid and antioxidant content, are also contributing to their popularity. These attributes make green peas an attractive option for health-conscious consumers and manufacturers focusing on wellness-oriented products.
By Application: Food and Beverage Holds Scale, Nutraceuticals Move Up the Value Chain
The food and beverage sector was the largest application segment in the global pea processed ingredients market in 2025, contributing 72.33% of the total market value. This dominance was driven by the extensive use of pea protein, starch, fiber, and flour in various products such as bakery items, meat alternatives, dairy substitutes, and snacks. These ingredients are valued for their functional benefits, including improved texture and enhanced nutrition, as well as their appeal as clean-label options. The growing consumer demand for plant-based and allergen-free food products further boosted their adoption in this sector.
The nutraceuticals and supplements segment is expected to grow at the fastest rate, with a projected CAGR of 8.98% through 2031. This growth is attributed to the increasing use of pea ingredients in health-focused products designed for satiety management, muscle health, and cardiovascular support. Pea-based ingredients are gaining popularity in clinical nutrition and senior nutrition due to their high protein content and other health benefits. Additionally, the rising consumer interest in preventive healthcare and plant-based diets is driving the demand for these ingredients in the nutraceuticals and supplements market.
Geography Analysis
North America led the global pea processed ingredients market in 2025, contributing 32.66% of the total market value. This dominance is largely due to the high demand for plant-based foods, sports nutrition products, and meat alternatives in the United States and Canada. The region benefits from a well-established food processing industry and the presence of major pea ingredient manufacturers, which drive innovation and production. Additionally, the growing preference for clean-label, high-protein food products has further boosted the adoption of pea-based ingredients across industries.
The Asia-Pacific region is expected to be the fastest-growing market, with a projected CAGR of 9.25% through 2031. Factors such as rapid urbanization, increasing disposable incomes, and heightened awareness of health and nutrition are driving the demand for plant-based ingredients. Countries like China, India, Japan, and Australia are seeing increased consumption of functional foods, dairy alternatives, and nutritional supplements made with pea ingredients. The growing popularity of vegan and flexitarian diets, along with increased investments in food processing, is anticipated to further fuel market growth in this region.
Europe ranks as the second-largest market for pea processed ingredients, driven by a strong focus on sustainability, organic sourcing, and premium food products. Consumers in the region are increasingly influenced by environmental concerns, the need to reduce carbon footprints, and the demand for certified clean-label products. Supportive regulatory policies promoting plant-based innovation and sustainable food production have also contributed to market growth. Additionally, the rising adoption of vegan, vegetarian, and flexitarian diets in countries like Germany, France, and the United Kingdom continues to support steady demand for pea-based ingredients.

Competitive Landscape
The global pea processed ingredients market is highly consolidated with major players like Roquette Frères, Cargill, Ingredion, and Cosucra Groupe Warcoing. These companies have a strong foothold due to their large-scale production capabilities, well-established supply chains, and partnerships with global food and nutrition manufacturers. The market competition is shifting from production capacity to factors such as product functionality, quality, and consistent sourcing. Additionally, the high costs and technical expertise required for entering this market make it challenging for new players to compete effectively.
Innovation is becoming a key focus in the market, with companies working on improving the taste, texture, and versatility of pea-based ingredients. Leading manufacturers are expanding their product offerings to include cleaner flavor profiles and ingredients that are easier to process and use in a variety of food and beverage applications. To ensure a stable supply, many companies are also increasing their regional production and sourcing capabilities, reducing reliance on imports. Furthermore, businesses are exploring new application areas such as dairy alternatives, confectionery, clinical nutrition, and pet food to diversify their revenue streams and capture a broader market share.
Despite the dominance of large players, there are opportunities for smaller, innovation-driven companies to grow by addressing specific challenges in emerging applications. Areas like clinical nutrition, functional beverages, and GLP-1 supportive products offer room for unique ingredient solutions. Companies such as PURIS, Vestkorn Milling, and Burcon NutraScience are gaining recognition for their advanced extraction technologies and specialized ingredient development. While the market remains concentrated at the top, these smaller players with niche expertise and innovative approaches are finding ways to carve out their space and contribute to the market's growth.
Pea Processed Ingredients Industry Leaders
-
Roquette Frères S.A
-
Cargill Incorporated
-
Ingredion Incorporated
-
Puris Proteins LLC
-
Cosucra Groupe Warcoing S.A.
- *Disclaimer: Major Players sorted in no particular order

Recent Industry Developments
- March 2026: PURIS introduced ClearP Hydrolyzed Pea Protein to expand its range of plant-based protein ingredients for beverages, snacks, and nutrition products. This product is designed to offer better solubility, clarity, and taste in functional formulations.
- September 2025: Meala FoodTech teamed up with Groundbaker to introduce a new pea protein ingredient for clean-label egg replacements. This ingredient improves texture, stability, and functionality in plant-based foods while keeping production costs low.
- July 2025: Prot introduced Prot Block, a pea protein-based ingredient created as a flexible plant-based protein option for everyday meals. The product is designed to offer better texture, a neutral taste, and clean-label features, meeting the rising demand for convenient, protein-rich foods.
- June 2025: Roquette Frères introduced new wheat and pea protein ingredients designed to improve texture and functionality in meat alternatives. This launch expanded the company’s plant-based product range to meet the growing demand for cleaner-label and high-protein meat substitutes.


Global Pea Processed Ingredients Market Report Scope
Pea processed ingredients are made from yellow or green peas and include protein, starch, fiber, and flour. These ingredients are widely used in food, beverages, nutraceuticals, and animal feed applications. The global pea processed ingredients market is classified by type, nature, source, application, and geography. Based on type, the market is classified into protein, starch, fiber, and flour. Based on nature, the market is classified into conventional and organic. Based on the source, the market is classified into yellow pea, green pea, and others. Based on application, the market is classified into food and beverages, animal nutrition, nutraceuticals/supplements, personal care and cosmetics, and others. Based on geography, the market is classified into North America, Europe, Asia-Pacific, South America, and the Middle East and Africa. The market forecasts are provided in terms of value (USD).
| Protein |
| Starch |
| Fiber |
| Flour |
| Conventional |
| Organic |
| Yellow Pea |
| Green Pea |
| Others (Split Pea/Chickpeas/Lentils/Other Legumes) |
| Food and Beverage | Bakery Products |
| Meat Substitutes/Analogues | |
| Dairy Alternatives | |
| Snacks and Cereals | |
| Confectionery | |
| Beverages | |
| Soups and Sauces | |
| Animal Nutrition | Pet Food |
| Feed for Livestock and Aquaculture | |
| Nutraceuticals/Supplements | |
| Personal Care and Cosmetics | |
| Others |
| North America | United States |
| Canada | |
| Mexico | |
| Rest of North America | |
| Europe | Germany |
| United Kingdom | |
| Italy | |
| France | |
| Spain | |
| Netherlands | |
| Poland | |
| Belgium | |
| Sweden | |
| Rest of Europe | |
| Asia-Pacific | China |
| India | |
| Japan | |
| Australia | |
| Indonesia | |
| South Korea | |
| Thailand | |
| Singapore | |
| Rest of Asia-Pacific | |
| South America | Brazil |
| Argentina | |
| Colombia | |
| Chile | |
| Peru | |
| Rest of South America | |
| Middle East and Africa | South Africa |
| Saudi Arabia | |
| United Arab Emirates | |
| Nigeria | |
| Egypt | |
| Morocco | |
| Turkey | |
| Rest of Middle East and Africa |
| By Type | Protein | |
| Starch | ||
| Fiber | ||
| Flour | ||
| By Nature | Conventional | |
| Organic | ||
| By Source | Yellow Pea | |
| Green Pea | ||
| Others (Split Pea/Chickpeas/Lentils/Other Legumes) | ||
| By Application | Food and Beverage | Bakery Products |
| Meat Substitutes/Analogues | ||
| Dairy Alternatives | ||
| Snacks and Cereals | ||
| Confectionery | ||
| Beverages | ||
| Soups and Sauces | ||
| Animal Nutrition | Pet Food | |
| Feed for Livestock and Aquaculture | ||
| Nutraceuticals/Supplements | ||
| Personal Care and Cosmetics | ||
| Others | ||
| By Geography | North America | United States |
| Canada | ||
| Mexico | ||
| Rest of North America | ||
| Europe | Germany | |
| United Kingdom | ||
| Italy | ||
| France | ||
| Spain | ||
| Netherlands | ||
| Poland | ||
| Belgium | ||
| Sweden | ||
| Rest of Europe | ||
| Asia-Pacific | China | |
| India | ||
| Japan | ||
| Australia | ||
| Indonesia | ||
| South Korea | ||
| Thailand | ||
| Singapore | ||
| Rest of Asia-Pacific | ||
| South America | Brazil | |
| Argentina | ||
| Colombia | ||
| Chile | ||
| Peru | ||
| Rest of South America | ||
| Middle East and Africa | South Africa | |
| Saudi Arabia | ||
| United Arab Emirates | ||
| Nigeria | ||
| Egypt | ||
| Morocco | ||
| Turkey | ||
| Rest of Middle East and Africa | ||


Key Questions Answered in the Report
Which ingredient type leads demand?
Protein led with 62.36% of market value in 2025 because it remains the most functional fraction for meat analogues, dairy alternatives, and sports nutrition.
Which application is expanding the fastest?
The nutraceuticals and supplements application segment is anticipated to grow at the fastest rate, with a CAGR of 8.98% through 2031. This growth is attributed to the rising incorporation of pea ingredients in formats such as satiety support, senior nutrition, and clinical nutrition.
Which region is the most important today?
North America led with 32.66% share in 2025 because of Canadian yellow pea supply, established processing capacity, and stronger regional sourcing after recent trade actions.
How concentrated is competition among suppliers?
Competition is concentrated among a small group of large processors, but the field still leaves room for specialists that solve specific formulation issues in taste, texture, or application performance.
Page last updated on:


