
Market Overview
| Study Period | 2021 - 2031 |
|---|---|
| Forecast Data Period | 2026 - 2031 |
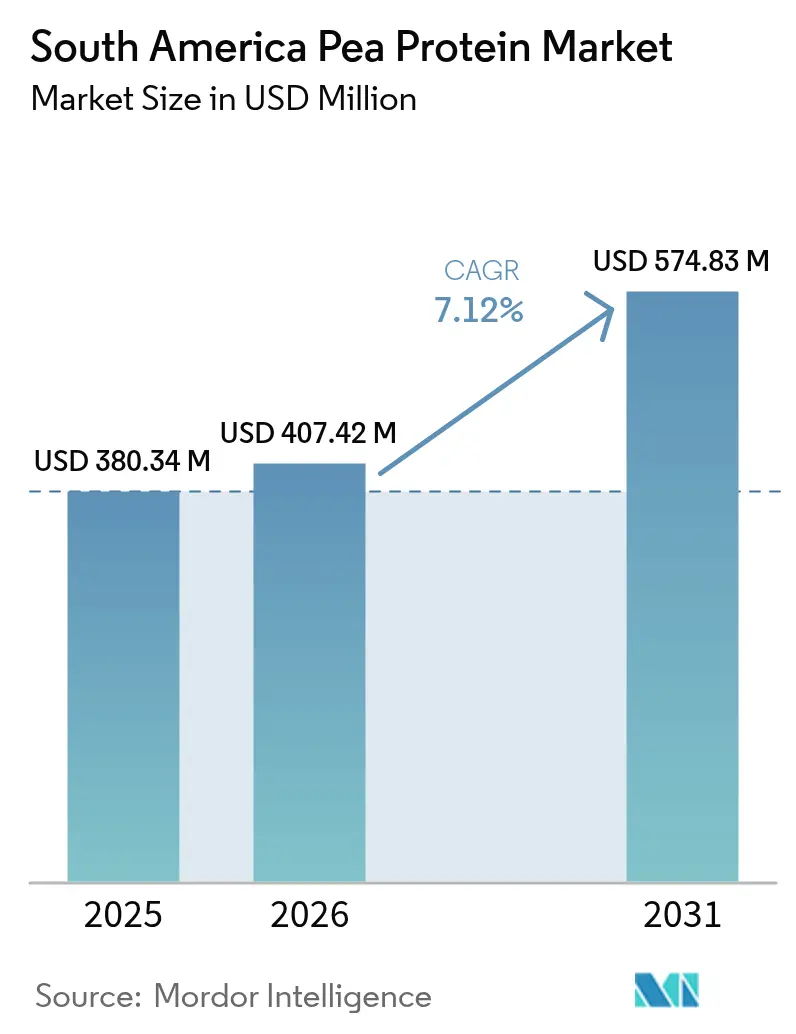
| Base Year Market Size (2025) | USD 380.34 Million |
| Market Size (2026) | USD 407.42 Million |
| Market Size (2031) | USD 574.83 Million |
| Growth Rate (2026 - 2031) | 7.12 % |
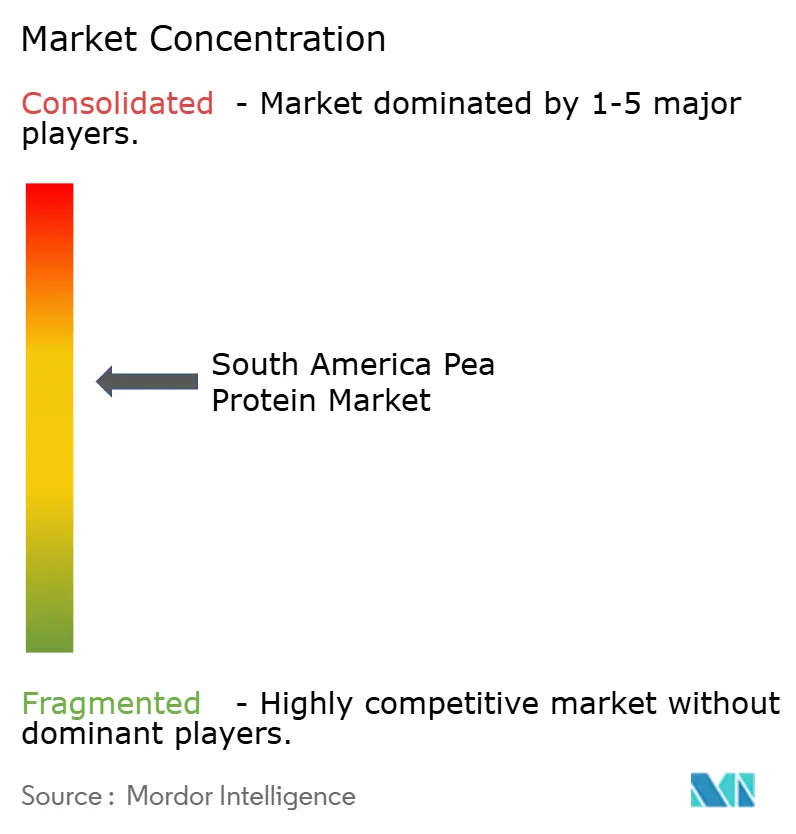
| Market Concentration | Medium |
Major Players
*Disclaimer: Major Players sorted in no particular order Image © Mordor Intelligence. Reuse requires attribution under CC BY 4.0. |
|
South America Pea Protein Market Analysis by Mordor Intelligence
The South America pea protein market size was valued at USD 380.34 million in 2025 and estimated to grow from USD 407.42 million in 2026 to reach USD 574.83 million by 2031, at a CAGR of 7.12% during the forecast period (2026-2031). Rising urban income, a widening consumer shift toward plant-based nutrition, and tightening clean-label rules are the primary accelerants behind this trajectory. Brazil’s food-processing industry earned USD 233 billion in revenue during 2024, generating large-volume demand even as the country relies on imports for roughly 90% of its pea requirements, a mismatch that magnifies currency-driven input risk. Argentina, the region’s principle pulse supplier, harvested 52 million metric tons of soybeans in the 2024/25 campaign, yet soaring inflation and currency depreciation continue to squeeze processor margins and elevate finished-goods prices. Meanwhile, Peru, Chile, and Colombia are witnessing a rapid uptick in plant-protein demand through modern grocery channels, encouraged by favorable regulatory signals such as Chile’s 2024 court ruling that protects plant-based nomenclature rights. Collectively, these developments point to sustained expansion in the South America pea protein market as manufacturers localize sourcing and differentiation strategies to hedge against supply volatility.
Key Report Takeaways
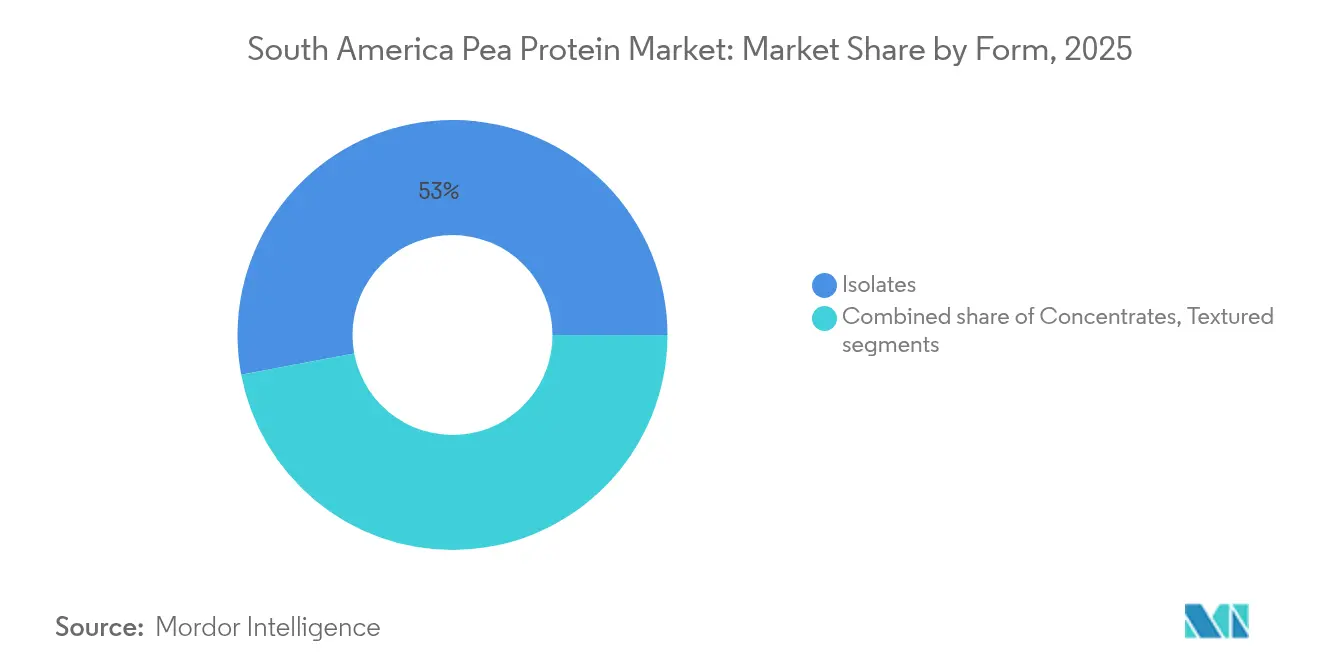
- By form, isolates captured 52.96% of the South America pea protein market share in 2025, while hydrolyzed and textured formats are expected to post the fastest 8.54% CAGR through 2031.
- By nature, conventional accounted for 88.92% of 2025 volume, whereas organic is set to accelerate at a 7.93% CAGR up to 2031.
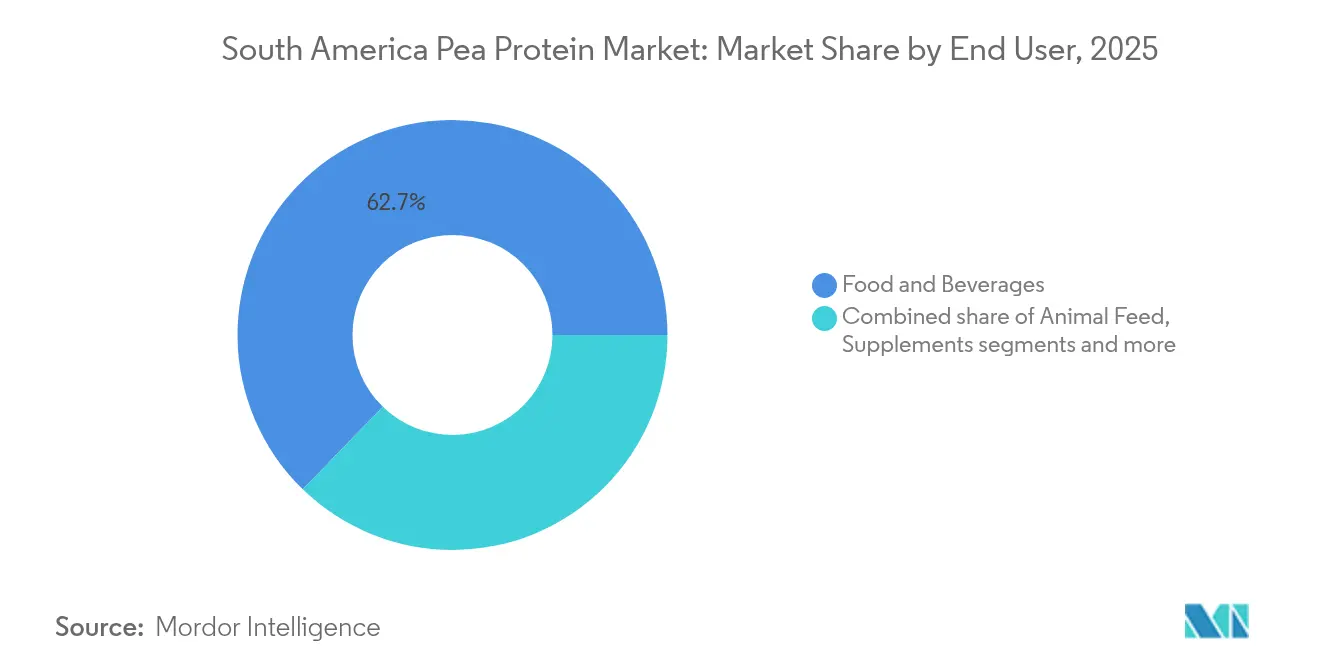
- By end user, food and beverages led with 62.74% of the South America pea protein market size in 2025, and personal care and cosmetics are forecast to expand at an 8.41% CAGR to 2031.
- By geography, Brazil held 44.88% share in 2025, while Peru is expected to register the quickest 8.58% CAGR between 2026 and 2031.
Note: Market size and forecast figures in this report are generated using Mordor Intelligence’s proprietary estimation framework, updated with the latest available data and insights as of 2026.
Market Trends and Insights
Drivers Impact Analysis of South America Pea Protein Market*
| Driver | (~) % Impact on CAGR Forecast | Geographic Relevance | Impact Timeline |
|---|---|---|---|
| Increasing demand for plant-based protein alternatives | +1.5% | Brazil, Argentina, Chile, with urban centers leading adoption | Medium term (2-4 years) |
| Rising vegan and vegetarian population | +0.9% | Brazil (São Paulo, Rio de Janeiro), Argentina (Buenos Aires), Chile (Santiago) | Long term (≥ 4 years) |
| Rising demand for clean label and allergen-free products | +1.2% | Brazil, Chile, with regulatory push from ANVISA and Chilean Ministry of Health | Medium term (2-4 years) |
| Growing awareness about health benefits of pea protein | +1.0% | Urban Brazil, Peru (Lima), Argentina, driven by digital health platforms | Medium term (2-4 years) |
| Increased consumer preference for sustainable and eco-friendly products | +0.8% | Brazil, Chile, Argentina, with younger demographics in metropolitan areas | Long term (≥ 4 years) |
| Rising popularity of meat substitutes and plant-based meat | +1.3% | Brazil, Argentina, Chile, with retail expansion in modern trade channels | Short term (≤ 2 years) |
| Source: Mordor Intelligence | |||
Increasing demand for plant-based protein alternatives
The South America pea protein market is experiencing strong growth driven by the rising demand for plant-based protein alternatives. Growing health consciousness, shifting dietary preferences toward vegan and vegetarian lifestyles, and concerns over animal welfare and environmental sustainability are fueling this trend. In 2024, 74% of Brazilians expressed a willingness to reduce or completely eliminate meat from their diets, according to a survey conducted by the Brazilian Vegetarian Society [1]Source: Vegconomist, "Study: 74% of Brazilians Would Consider Cutting Down on or Eliminating Meat", vegconomist.com. Consumers increasingly view plant-based proteins as clean-label, allergen-free, and highly digestible substitutes for animal-derived proteins. The expanding adoption of flexitarian diets across major economies such as Brazil, Argentina, and Chile is further supporting market expansion. Food and beverage manufacturers are incorporating pea protein in products like meat alternatives, nutritional supplements, and dairy substitutes. The popularity of plant-based diets among fitness enthusiasts and environmentally conscious consumers is also accelerating demand. Overall, pea protein’s versatility and nutritional profile are positioning it as a key ingredient in South America’s evolving protein landscape.
Rising vegan and vegetarian population
The rising vegan and vegetarian population is a major driver of the South America pea protein market. Consumers are increasingly shifting toward plant-based diets driven by growing health awareness, environmental sustainability, and ethical concerns over animal welfare. This trend is especially evident in Brazil, where an estimated 10 million people identified as vegan in 2024, marking a significant rise in plant-based lifestyle adoption [2]Source: The Vegan Society, "The Right to be a Vegano: How are Vegans Protected Under Brazilian Law? vegansociety.com. Urban youth and health-conscious consumers are leading this transition, influenced by global wellness and sustainability movements. Pea protein’s clean-label, allergen-free, and nutrient-rich profile makes it an ideal choice for vegan food and beverage formulations. The expanding retail and foodservice availability of plant-based meat, dairy alternatives, and snack products further supports market growth. As consumer adoption strengthens, the South America pea protein market continues to witness robust expansion driven by rising demand for plant-forward nutrition.
Rising demand for clean label and allergen-free products
The rising demand for clean-label and allergen-free products is a key driver of the South America pea protein market. Consumers are increasingly seeking transparency in food ingredients, preferring natural, minimally processed, and easily recognizable components. Pea protein aligns well with this trend as it is plant-based, non-GMO, gluten-free, and free from common allergens such as soy and dairy. Growing awareness of food intolerances and sensitivity issues is further reinforcing consumer trust in pea protein-based formulations. Food and beverage manufacturers are capitalizing on this preference by launching products positioned as clean, sustainable, and health-oriented. The shift toward ingredient simplicity and label transparency is particularly strong among urban and health-conscious populations. As a result, clean-label demand continues to accelerate pea protein adoption across South America’s functional food and beverage segments.
Rising popularity of meat substitutes and plant-based meat
The rising popularity of meat substitutes and plant-based meat is a key driver of the South America pea protein market. Growing consumer preference for healthier, sustainable, and ethical food choices is accelerating the shift from traditional animal-based products. Pea protein has become a preferred ingredient for plant-based meat due to its high protein content, neutral flavor, and functional flexibility. In Argentina, where livestock dominance sets high standards for sensory quality, economic pressures are creating opportunities for affordable plant-based options that undercut premium beef prices. Meanwhile, Chile’s 2024 NotCo legal victory removed labeling restrictions, allowing clearer marketing of plant-based product benefits and accelerating category growth [3]Source: Good Food Institute, "Reimagining protein", gfi.org. Regional food manufacturers are expanding portfolios to meet rising demand from vegan and flexitarian consumers. Overall, technological advancements, supportive policy shifts, and affordability factors continue to drive the expansion of the South America pea protein market.
Restraints Impact Analysis of South America Pea Protein Market*
| Restraint | (~) % Impact on CAGR Forecast | Geographic Relevance | Impact Timeline |
|---|---|---|---|
| High production costs of pea protein extraction | -1.1% | Brazil, Argentina, with import-dependent supply chains amplifying cost pressures | Medium term (2-4 years) |
| Limited availability of raw peas in certain regions | -0.8% | Brazil, Chile, Peru, with Argentina as primary regional supplier | Long term (≥ 4 years) |
| Taste and texture challenges in product formulations | -0.7% | Brazil, Argentina, Chile, affecting consumer acceptance in traditional food categories | Short term (≤ 2 years) |
| Lack of awareness and knowledge about pea protein in some markets | -0.6% | Peru, Paraguay, Bolivia, and rural areas across South America | Medium term (2-4 years) |
| Source: Mordor Intelligence | |||
High production costs of pea protein extraction
High production costs associated with pea protein extraction act as a significant restraint on the South America pea protein market. The extraction and isolation process involves complex technologies such as wet fractionation, which require substantial energy input and specialized equipment. Limited regional processing infrastructure further adds to operational costs, making locally produced pea protein less price-competitive compared to imported or alternative plant proteins. Fluctuating raw material prices and supply chain inefficiencies also contribute to cost pressures. These high production expenses often translate into elevated pricing for end products, restricting affordability for mass-market consumers. Small and mid-sized food manufacturers face additional challenges in scaling production due to capital-intensive processing requirements. Consequently, cost constraints continue to limit the broader penetration and competitiveness of pea protein within South America’s plant-based protein market.
Taste and texture challenges in product formulations
Taste and texture challenges in product formulations remain a key restraint for the South America pea protein market. Pea protein often imparts a distinct earthy or beany flavor, which can affect the sensory appeal of plant-based foods and beverages. Achieving desirable texture and mouthfeel comparable to animal-based products also poses difficulties, particularly in meat and dairy alternatives. These limitations can hinder consumer acceptance, especially in markets like Argentina and Brazil, where taste expectations are high. Manufacturers face increasing research and development costs to improve flavor masking, texture enhancement, and product consistency. Although advancements in processing technologies are addressing these issues, solutions remain costly and not yet widespread. As a result, sensory challenges continue to constrain the large-scale adoption of pea protein in diverse food formulations across South America.
*Our forecasts treat driver/restraint impacts as directional, not additive. The impact forecasts reflect baseline growth, mix effects, and variable interactions.
South America Pea Protein Market Segment Analysis
By Form:
Isolates Lead on Purity, Textured Forms Gain in Meat AlternativesPea protein isolates commanded the largest market share of 52.96% in 2025 within the South America pea protein market. This dominance is largely attributed to their high protein content ranging between 80-85%, which aligns well with stringent formulation requirements in key applications such as sports nutrition, infant formula, and dairy alternatives. These sectors prioritize not only nutritional value but also functional performance and clean labeling, where pea protein isolates excel. Their versatility and ability to maintain stability and texture make them preferred choices among manufacturers. Additionally, the growing consumer awareness around plant-based proteins and allergen-free options further reinforce the leading position of pea protein isolates.
Hydrolyzed and textured pea protein forms represent the fastest-growing segments within the market, forecasted to expand at a compound annual growth rate of 8.54% through 2031. This rapid growth is propelled by increasing demand for enhanced functional properties such as improved solubility, easier digestibility, and better mouthfeel, which these forms provide. Hydrolyzed proteins are particularly favored in specialized nutrition products, including sports supplements and infant nutrition, due to their superior bioavailability. Textured pea protein caters to the meat substitute market by offering desirable texture and structure, aiding the shift toward plant-based diets. Market players are investing heavily in research and development to optimize these forms to meet evolving consumer preferences.



By Nature:
Conventional Dominates, Organic Expands on Clean-Label MandatesConventional pea protein dominated the South America pea protein market with an 88.92% share in 2025. This substantial lead stems from its well-established supply chains that ensure consistent availability across the region. Lower raw material costs make it particularly appealing to cost-conscious manufacturers seeking to maintain competitive pricing. The broader accessibility of conventional options positions it as the default choice for large-scale production in various applications. Manufacturers benefit from reliable sourcing without the complexities associated with certification processes. Overall, these advantages solidify conventional pea protein's entrenched role in meeting mainstream market demands.
Organic pea protein emerges as the fastest-growing segment, projected to expand at 7.93% annually through 2031. This growth is fueled by rising clean-label mandates that prioritize transparent and natural ingredients in product formulations. Retailer sustainability commitments increasingly favor organic certifications to align with environmental goals. Consumer willingness to pay premiums for verified organic products accelerates adoption in premium segments like health foods and plant-based alternatives. The segment benefits from heightened awareness of sustainable farming practices amid global eco-trends. This trajectory highlights organic pea protein's potential to capture value-added market niches despite its smaller current base.
By End User:
Food and Beverages Anchor Demand, Personal Care SurgesFood and beverages dominated the South America pea protein market, capturing 62.74% of end-user demand in 2025. This leading position is anchored by key applications including dairy alternatives, meat substitutes, bakery products, and sports nutrition. Pea protein's hypoallergenic profile makes it ideal for consumers avoiding common allergens like soy or dairy. Its complete amino-acid spectrum provides essential nutritional benefits that align with health-focused formulations. Manufacturers leverage these attributes to enhance product functionality, texture, and protein content across diverse offerings. The segment's established infrastructure and high-volume consumption further reinforce its commanding market presence.
Personal care and cosmetics represent the fastest-growing end-user segment, forecasted to expand at 8.41% annually through 2031. This rapid growth stems from formulators increasingly incorporating pea peptides into innovative products like anti-aging serums and hair-care solutions. These peptides mimic keratin properties, offering natural strengthening and repair benefits for skin and hair. The shift toward clean-beauty formulations favors pea protein's plant-based, sustainable credentials over synthetic alternatives. Rising consumer demand for multifunctional, eco-friendly cosmetics accelerates adoption in premium beauty lines. Overall, this segment's trajectory underscores pea protein's expanding role beyond food into high-value personal care applications.
Geography Analysis
Brazil Pea Protein Market
Brazil holds the dominant position in the South America pea protein market, commanding 44.88% of the market share in 2025. This leadership is underpinned by the country's vast agricultural infrastructure and established processing capabilities for pea sourcing and extraction. Brazil's large population and robust food processing industry drive substantial demand across key applications like meat substitutes and dairy alternatives. The nation's advanced manufacturing ecosystem supports high-volume production and export-oriented supply chains. Favorable trade policies and proximity to key raw material suppliers further solidify its market stronghold. Overall, Brazil's scale and efficiency make it the cornerstone of regional pea protein dynamics.
Peru Pea Protein Market
Peru emerges as the fastest-growing geography, forecasted to expand at 8.58% annually through 2031, outpacing all other South American countries. This surge is propelled by Lima's rapidly expanding middle class with rising disposable incomes fueling premium nutrition trends. Increasing exposure to Western dietary patterns introduces demand for protein supplementation and plant-based foods among urban consumers. Government initiatives promoting healthy eating and sustainable agriculture enhance local market potential. Investments in processing facilities position Peru to capture value-added segments like sports nutrition. This trajectory highlights Peru's transition from emerging to pivotal player in the regional pea protein landscape.
Argentina Pea Protein Market
Argentina plays a significant role in the South America pea protein market through its strong agricultural base and growing adoption in plant-based innovations. As a major exporter of pulses, the country leverages local pea production for domestic processing and formulation needs. Urbanization in Buenos Aires and other centers boosts demand for functional proteins in bakery, beverages, and meat analogs. Argentina's focus on sustainability aligns with global clean-label trends, supporting market penetration. Competitive manufacturing costs enable expansion into export markets beyond South America. This positions Argentina as a steady contributor with potential for accelerated growth amid rising health consciousness.
Regulatory Landscape
Pea protein marketed for food and beverage applications in South America is governed by national food-ingredient and labeling rules, with Brazil and Argentina setting many of the practical compliance benchmarks for the region. In Brazil, ANVISA is the key authority for food regulation, including market-entry routes and compliance for ingredients positioned as new foods or ingredients (for example, via the framework established under RDC 839/2023). For exports into Argentina, compliance is commonly assessed against the Codigo Alimentario Argentino (CAA), administered through the national health and agriculture authorities, which drives requirements on identity and quality provisions and label presentation.
For MERCOSUR members (Argentina, Brazil, Paraguay, Uruguay), harmonized technical requirements for additives and related food provisions are implemented through Common Market Group (GMC) resolutions, with periodic updates such as RES GMC 022/2025 and RES GMC 003/2025. This harmonization supports cross-border circulation of finished products and ingredient inputs, while labeling rules are also adapting to plant-based communication and nomenclature. That shifts the emphasis toward clear, compliant naming and allergen information on packs destined for multiple South American markets.
Value Chain Analysis
The regional value chain covers raw pea sourcing (including imports and intraregional pulse supply), primary processing (milling into flour or grits), protein processing (fractionation into concentrates and isolates and texturization or hydrolysis), formulation into end products (food and beverages, supplements, and personal care), and distribution through ingredient traders and direct-to-manufacturer sales. Brazil, as the demand anchor, remains structurally import-dependent for peas and for high-purity pea protein formats, which raises exposure to exchange-rate swings and ocean-freight lead times. That dynamic reinforces the role of multinational suppliers alongside regional processors focused on vegetable-protein extrusion and concentrates.
Argentina is a critical agricultural and trading node in the chain, including pulse export capabilities supported by phytosanitary access work led by SENASA, while Brazil and Argentina host the main regional processing clusters along major industrial corridors. Logistics and storage remain gating factors for powders and finished ingredients, including cold and dry warehousing availability and port reliability in secondary markets. New infrastructure such as Peru's Megapuerto Chancay, with operations commencing in November 2024, improves connectivity to Asia and helps the region participate in global pulse and ingredient flows rather than relying only on domestic distribution.
Competitive Landscape
The South America pea protein market exhibits moderate fragmentation, where a handful of global ingredient giants maintain significant control over core operations. Companies such as Roquette, Ingredion, ADM, and Cargill dominate through their substantial investments in extraction facilities strategically located across key countries like Brazil and Argentina. These players leverage economies of scale to produce high-purity isolates and textured proteins at competitive costs. Their established presence ensures reliable supply to major food and beverage manufacturers throughout the region. This concentration allows them to dictate pricing dynamics and innovation timelines effectively.
These giants excel in distribution networks that span the continent, providing seamless logistics from processing plants to end-users in urban centers like São Paulo and Lima. Advanced cold-chain capabilities minimize spoilage and maintain product integrity during transit, a critical advantage in regions with variable infrastructure. Their global procurement strategies secure consistent pea sourcing despite seasonal fluctuations or supply disruptions. Technical-service teams offer customized formulation support, helping clients integrate pea proteins into diverse applications from meat analogs to cosmetics. Such comprehensive service ecosystems create high entry barriers for newcomers seeking market share.
Smaller regional players face formidable challenges in replicating these capabilities, often limited to niche segments like local bakery or animal feed applications. Lack of capital for large-scale extraction technology restricts their output to basic concentrates rather than premium isolates. These firms struggle with inconsistent raw material access and limited research and development resources for functional enhancements. While they contribute to market diversity through localized flavors or organic variants, their growth remains constrained by the incumbents' superior scale and expertise. Overall, this landscape favors consolidation, with global leaders poised to expand through partnerships and capacity upgrades.
South America Pea Protein Industry Leaders
-
Cargill, Incorporated
-
Ingredion Incorporated
-
Glanbia plc
-
Archer-Daniels-Midland Company
-
Roquette Frères
- *Disclaimer: Major Players sorted in no particular order
South America Pea Protein Market Companies Covered in this Report
- Roquette Frères
- Ingredion Incorporated
- Archer Daniels Midland Company (ADM)
- Cargill, Incorporated
- Glanbia plc
- Puris Foods LLC
- Axiom Foods, Inc.
- Burcon NutraScience Corp.
- Emsland Group
- AGT Food & Ingredients
- Cosucra Groupe Warcoing
- The Scoular Company
- Kerry Group plc
- Shandong Jianyuan Foods
- Yantai Shuangta Food Co.
- Vestkorn Milling AS
- Sotexpro (GEMEF Industries)
- Fenchem Biotek Ltd.
- Nutri-Pea Limited
- Farbest Brands

Market Opportunities and Future Outlook
A primary opportunity is substituting imported high-purity pea protein with locally produced material, particularly isolates that support premium formulations in sports nutrition, dairy alternatives, and plant-based meat. The market context points to a persistent supply gap: Brazil relies on imports for a large share of pea needs, while commercial-scale pea protein isolate production in-country is described as minimal to non-existent. That creates room for investments in fractionation and purification capacity in Brazil and Argentina to reduce lead-time and FX exposure for regional manufacturers.
Product-performance improvement is another actionable whitespace, especially for beverages and bar applications where off-notes and stability are recurring formulation barriers. Applied research in Brazil, for example work at UNICAMP demonstrating improved solubility and reduced off-flavor through heat treatment combined with conjugation using guarana extract, shows a pathway for differentiated ingredient systems tailored to local plant-based beverage consumption. Targeted alternative-protein R&D support in Brazil also appears active, including the October 2024 matching-fund agreement between a state research-support foundation and GFI Brazil, which supports a pilot-scale pipeline for regional ingredient development and application support for food and beverage manufacturers.
Recent Industry Developments in South America Pea Protein Market
- May 2026: ADM launched eight new soy and pea-based ingredient solutions, including pea flour, to broaden formulation options across applications such as bakery, cereal, and batters. The rollout expands the regional toolkit for plant-protein fortification and gives manufacturers more choices to balance cost, functionality, and label positioning.
- March 2026: Ingredion introduced VITESSENCE Pea 100 HD, a pea protein designed to improve texture, softness, and stability in cold-pressed nutritional and sports bars. This application-specific pea protein supports faster reformulation cycles for brands targeting higher-protein snack formats across modern retail channels.
- October 2024: Axiom Foods received Non-GMO Project verification for its pea protein isolates sourced from North American peas and processed at its California facility. The verification supports cleaner label claims for South American customers that use imported isolates and strengthens supplier credibility in segments that prioritize non-GMO positioning.


South America Pea Protein Market Report Scope and Research Methodology
Market Definition and Coverage
For this study, the market is defined as the value of pea protein ingredients sold into South America, counted at the point where they are supplied for use in food, beverages, nutrition, feed, and other downstream formulations.
Scope exclusions: It excludes finished consumer products where pea protein is only one ingredient, and it excludes pea cultivation or whole peas traded as a commodity.
Segments Covered in This Report
-
By Form
- Concentrates
- Isolates
- Textured/Hydrolyzed
-
By Nature
- Conventional
- Organic
-
End User
-
Food and Beverages
- Bakery
- Beverages
- Breakfast Cereals
- Condiments / Sauces
- Dairy and Dairy-Alternative
- Meat / Poultry / Seafood and Alternatives
- RTE / RTC Meals
- Snacks
- Animal Feed
-
Supplements
- Baby Food and Infant Formula
- Elderly and Medical Nutrition
- Sport / Performance Nutrition
- Personal Care and Cosmetics
-
Food and Beverages
-
By Country
- Brazil
- Argentina
- Chile
- Peru
- Rest of South America
Data Sources, Market Sizing, and Validation
Desk Research
Desk research was used to map the demand pool for pea protein across South America and to set realistic guardrails for volumes and pricing. We leaned on public sources such as national trade and customs statistics, agriculture and food industry ministries, FAO datasets, and food standards or labeling guidance published by regulators in key countries.
To make the model usable in practice, secondary inputs were also pulled from company filings, investor presentations, association websites, and credible news coverage that flags capacity additions, new product launches, and import dependence. In a few cases, paid subscriptions for company financials and shipment level import-export records were used to cross-check supplier presence and trade flows. The sources listed here are illustrative, and many other public and paid references were also used for data collection, validation, and clarification during the work.
Primary Interviews and Surveys
We use expert interviews and surveys with ingredient buyers, processors, distributors, product developers, and regulators in South America. Their feedback helps clarify import reliance, application demand, price movement, and gaps in secondary data, and supports reconciliation of assumptions before final sizing.
Distribution of primary research fieldwork respondents
| Company type | Respondent position |
|---|---|
| Top tier: 31% | CXOs: 18% |
| Mid tier: 44% | Functional/Unit leaders: 32% |
| Smaller Players: 25% | Managers: 50% |
Market-Sizing & Forecasting
Sizing was built using a top-down and bottom-up approach, with the main build coming from a top-down reconstruction of South America ingredient demand based on application level consumption signals and trade availability for pea-derived inputs. The totals were then checked with selective bottom-up approximations, such as supplier and importer roll-ups, sample price per kg by form, and volume sanity checks by major end uses, and the final numbers were adjusted only when multiple checks pointed in the same direction.
Inputs that shaped the model included, for example, country level import dependence for peas and pea ingredients, the split between isolates, concentrates, and textured or hydrolyzed formats, usage rates in food and beverage formulations, observed price ranges by form, and the pace of plant-based product launches that pull ingredient demand forward. Where company level detail was not visible, gaps were handled by using proxy ratios from comparable applications and then re-validating the implied volumes with interview feedback.
Forecasts were developed using scenario analysis supported by simple trend models for the most stable drivers, and the scenarios were aligned to what primary respondents expect on adoption, pricing progression, and substitution trends over the next few years.
Data Validation & Update Cycle
Validation is done through repeated cross-checks so the final number is not driven by a single dataset or one interview view. Outputs are compared with independent signals like trade movements, price direction by form, and application growth indicators, and then anomalies are reviewed in a second analyst pass before sign-off.
The study is refreshed annually, and interim updates are triggered when material events show up, such as a major capacity expansion, a step change in import flows, or a sharp price shift in key inputs. Right before delivery, we do a fresh review pass so the latest market-moving information is reflected in the published figures.
Mordor Intelligence's South America Pea Protein Market Size Measured Against Other Published Estimates
Different published market sizes for South America pea protein can look far apart because firms do not always count the same things, and they also start from different years, currencies, and price points. Gaps usually come from what is treated as the market unit (ingredient sales versus finished foods), how geography is grouped, and whether the estimate is built from demand indicators or from broad category benchmarks.
Some external estimates combine Latin America into one pool and may also blend pea protein with adjacent pea-based ingredients in a way that lifts the stated total. In Mordor Intelligence, only pea protein ingredients in South America are counted, and values are tied back to form-level pricing and application-linked demand signals before totals are finalized.
Benchmark comparison
| Source | Market Size | Gaps in Research Methodology |
|---|---|---|
| Mordor Intelligence | USD 380.34 M (2025) | |
| Regional Consultancy A | USD 198.27 M (2024) | Uses an earlier base year and a narrower capture of ingredient value, and the definition is presented more as extracted pea protein powder without clearly aligning totals to end-use demand signals by country. |
| Industry Research Group B | USD 122.89 M (2024) | Builds the number at a Latin America level and then reports a regional total that can be shaped by country mix assumptions, and the scope can differ depending on whether hydrolysates and textured formats are fully counted as pea protein. |
Across the three figures, the spread is mainly explained by year selection, region grouping, and how tightly the model is connected to application demand and form-level pricing. By keeping the scope limited to South America pea protein ingredients and then checking the totals against multiple practical signals, the final estimate stays easier to replicate and interpret for planning and investment decisions.


Key Questions Answered in the Report
What is the projected value of the South America pea protein category by 2031?
The sector is expected to reach USD 574.83 million by 2031 on a 7.12% CAGR trajectory.
Which form currently leads sales?
Isolates hold 52.96% share owing to their 80–85% purity and formulation flexibility.
Which country delivers the fastest growth outlook?
Peru is set to expand at 8.58% CAGR thanks to an enlarging middle class and growing retail presence.
Why are organic variants gaining attention?
Clean-label pressures and rising sustainability priorities are driving organic pea protein demand at an 7.93% CAGR.
Which end-use shows the highest growth rate?
Personal care and cosmetics lead with an 8.41% CAGR as pea peptides gain popularity in hair-care and skin-care products.
Page last updated on:


 Your data is secure and never sold or shared.



