Pea Fiber Market Size and Share
Market Overview
| Study Period | 2021 - 2031 |
|---|---|
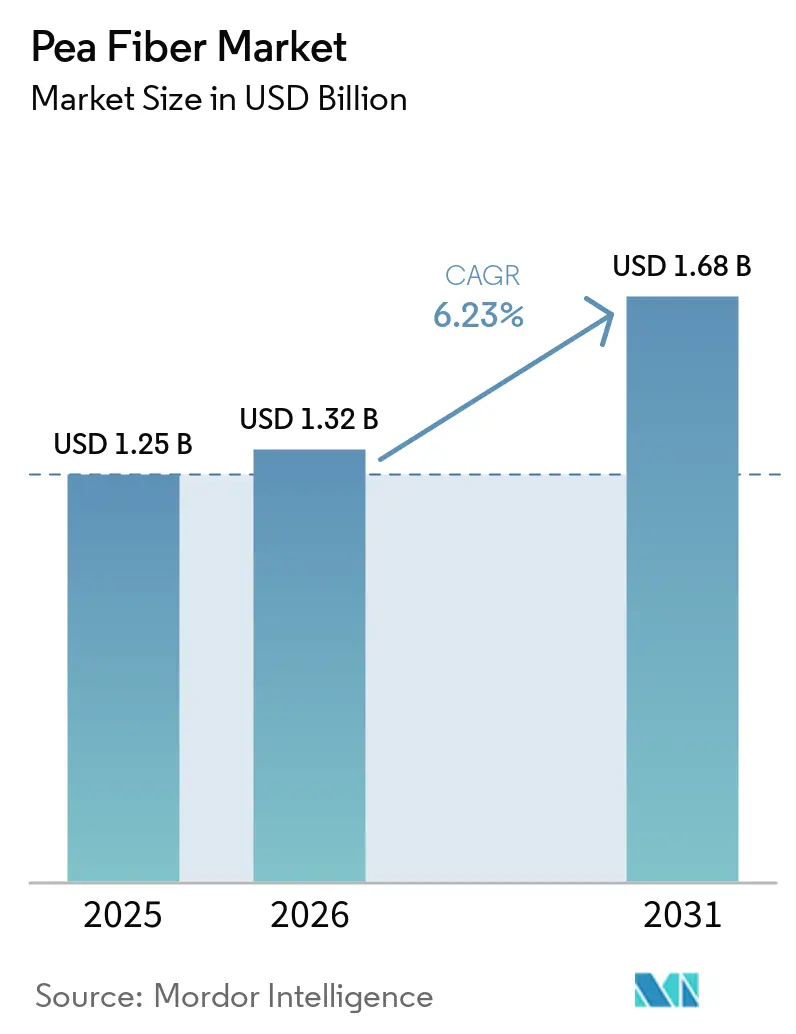
| Market Size (2026) | USD 1.32 Billion |
| Market Size (2031) | USD 1.68 Billion |
| Growth Rate (2026 - 2031) | 6.23% CAGR |
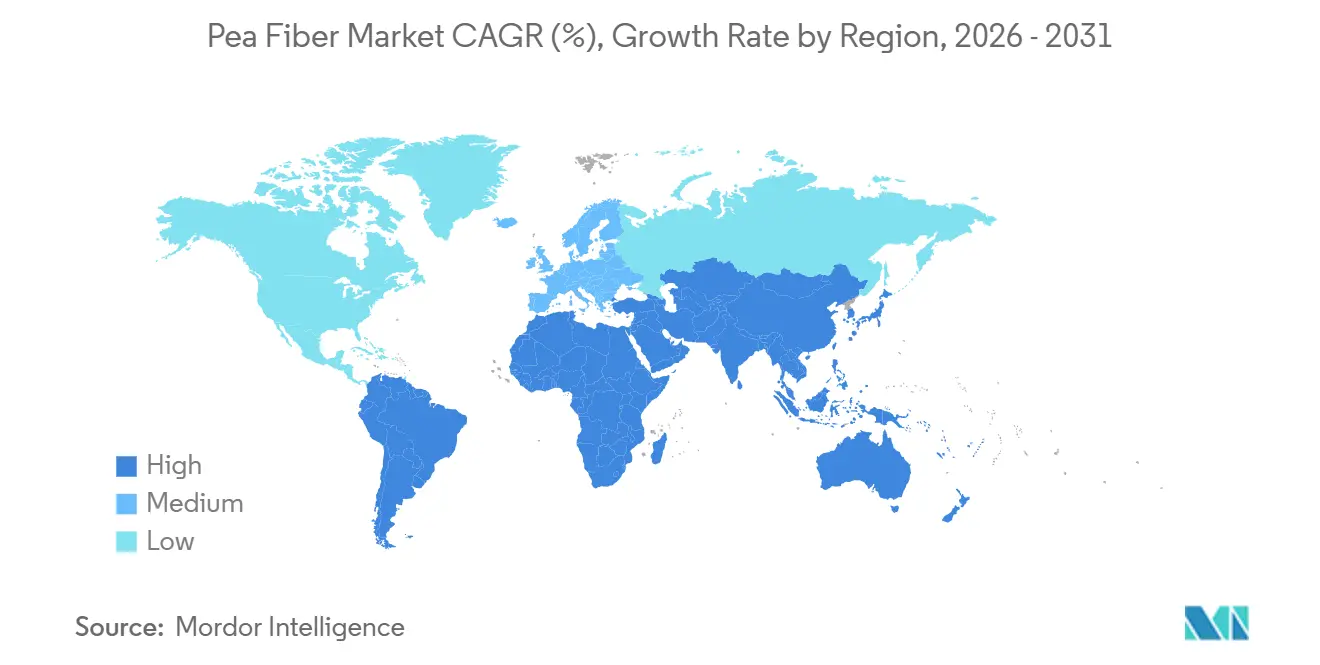
| Fastest Growing Market | Asia Pacific |
| Largest Market | North America |
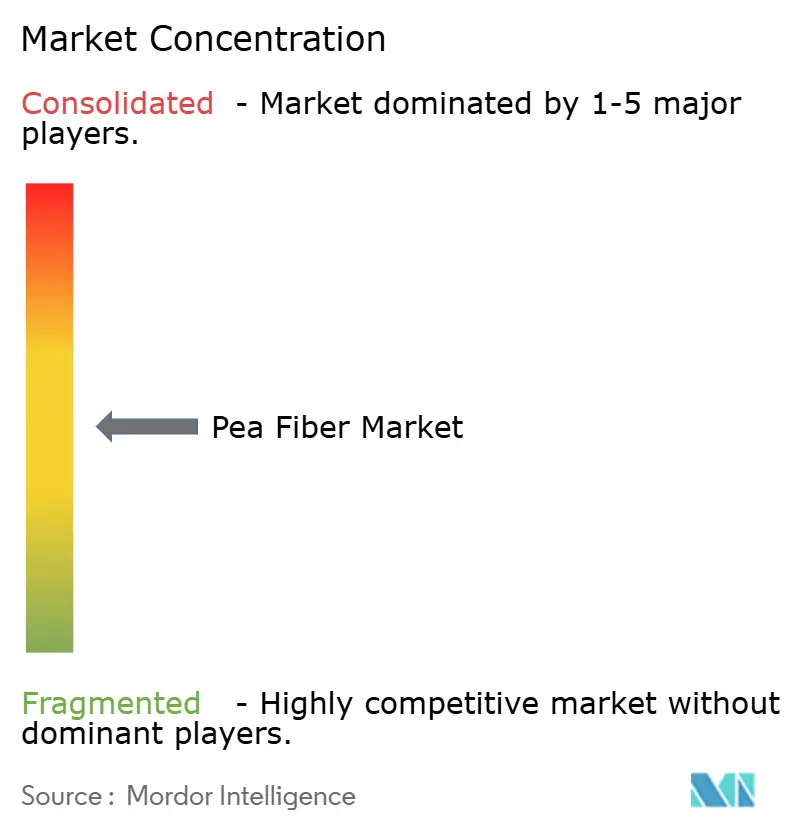
| Market Concentration | Medium |
Major Players *Disclaimer: Major Players sorted in no particular order Image © Mordor Intelligence. Reuse requires attribution under CC BY 4.0. | |
Pea Fiber Market Analysis by Mordor Intelligence
The pea fiber market size is projected to expand from USD 1.25 billion in 2025 and USD 1.30 billion in 2026 to USD 1.68 billion by 2031, registering a CAGR of 5.3% between 2026 and 2031. Pea fiber is increasingly positioned as a value-added functional ingredient within clean-label reformulation, gluten-free product innovation, and plant-based food applications, rather than being utilized solely as a commodity bulk fiber component. The World Health Organization continues to recommend at least 25 g of naturally occurring dietary fiber per day for adults, while intake in the United States, United Kingdom, and Canada has remained below that level, which keeps demand open for fiber-enriched foods and supplements [1]Source: World Health Organization, “Healthy Diet,” WHO Fact Sheet, who.int. Regulatory progress in Europe and wider adoption of dry-fractionation processing are improving product access, cost structures, and sustainability positioning for suppliers in the pea fiber market [2]Source: EFSA Panel on Food Additives and Flavourings, “Safety Evaluation of Pea Fibre Concentrate (FIPEA) as Food Additive,” EFSA Journal, efsa.europa.eu. Trade disruption in yellow peas and sensory limits at higher inclusion levels are still slowing some investment and formulation decisions, but the pea fiber market continues to hold a moderate and durable growth path through 2031.
Key Report Takeaways
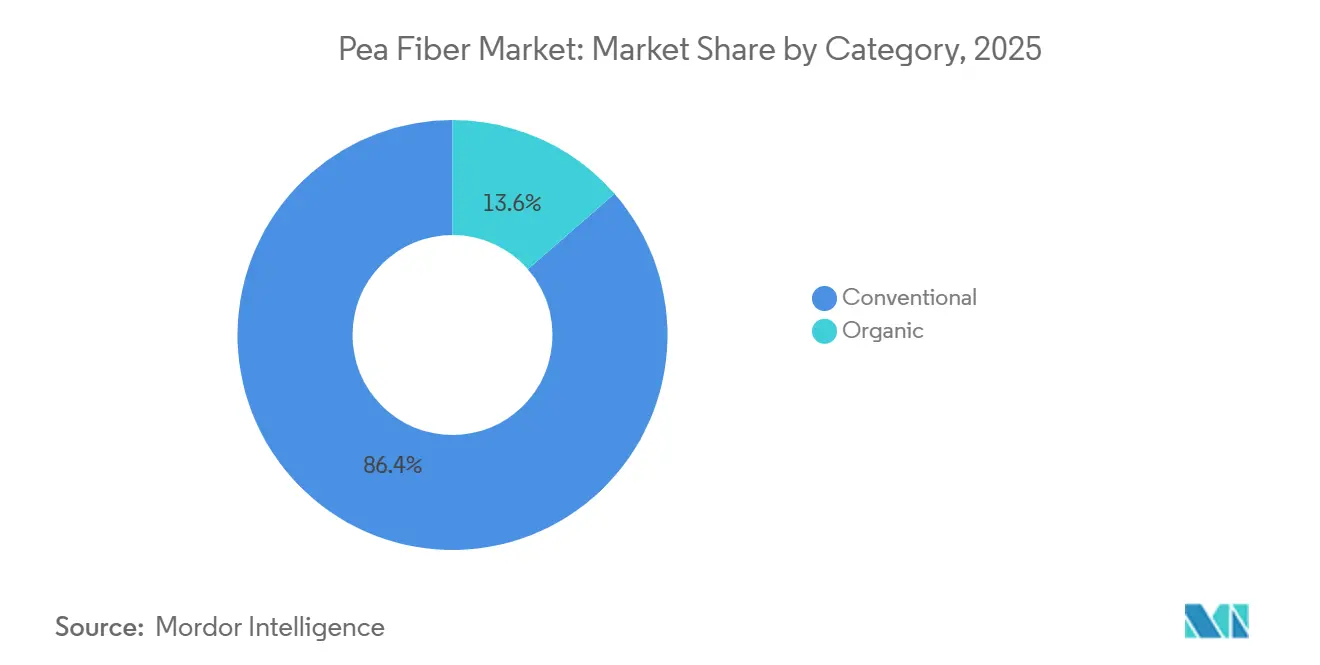
- By category, conventional pea fiber accounted for 86.4% of total value in 2025, while organic pea fiber is forecast to expand at a 7.7% CAGR through 2031.
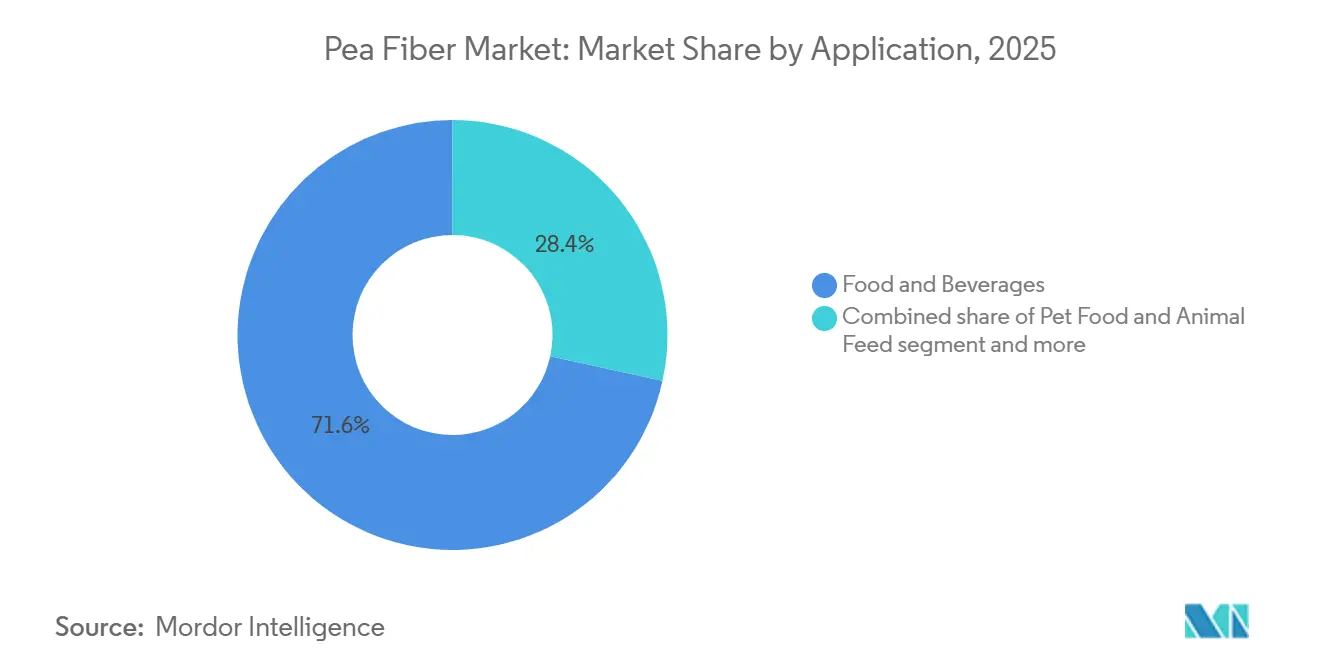
- By application, food and beverages accounted for 71.5% of the pea fiber market size in 2025, while dietary supplements are projected to advance at a 7.2% CAGR through 2031.
- By geography, North America held 36.9% of total value in 2025, while Asia-Pacific is forecast to grow at a 5.8% CAGR through 2031.
Note: Market size and forecast figures in this report are generated using Mordor Intelligence’s proprietary estimation framework, updated with the latest available data and insights as of January 2026.
Global Pea Fiber Market Trends and Insights
Drivers Impact Analysis*
| Driver | (~) % Impact on CAGR Forecast | Geographic Relevance | Impact Timeline |
|---|---|---|---|
| Rising Adoption of Plant-Based and Vegan Diets | +1.4% | Global, with early gains in North America and Europe, expanding to Asia-Pacific | Medium term (2-4 years) |
| Growth in Gluten-Free Food Manufacturing | +0.8% | North America and Europe core, spill-over to Asia-Pacific | Medium term (≤ 2 years) |
| Increasing Regulatory Support for Fiber-Enrichment Claims | +0.5% | North America and Europe, with gradual adoption in Asia-Pacific | Long term (≥ 4 years) |
| Growing Consumer Preference for Clean-Label Ingredients | +0.7% | Global, with premium markets leading adoption | Short term (2-4 years) |
| Expansion of Production Capacity and Adoption of Dry-Fractionation Technologies | +0.6% | North America and Europe manufacturing hubs, expanding to Asia-Pacific | Medium term (≤ 2 years) |
| Increasing Health Consciousness and Dietary Awareness | +0.9% | Global, with developed markets showing stronger correlation | Medium term (≥ 4 years) |
| Source: Mordor Intelligence | |||
Rising Adoption of Plant-Based and Vegan Diets
Pea fiber is becoming increasingly important in plant-based foods because it supports texture, moisture retention, and fat replacement in meat alternatives and dairy-free products. In 2025, Lantmännen announced a EUR 105 million investment in a new yellow pea processing facility in Lidköping, Sweden, scheduled for commissioning in the first half of 2027. The plant is expected to produce 7,000 tonnes of protein isolate annually from 35,000 tonnes of yellow peas. As food manufacturers expand plant-based product offerings, they often reformulate products to improve both texture and nutritional value, increasing the use of pea fiber as a complementary ingredient. As a result, growth in the pea fiber market is frequently driven by the wider adoption of pea-based ingredients rather than by demand for fiber alone. With plant-based applications expanding across multiple food categories, the pea fiber market is expected to benefit from a broader and more stable demand foundation.
Growth in Gluten-Free Food Manufacturing
Gluten-free food production continues to support growth in the pea fiber market because removing wheat often creates challenges related to texture and moisture retention, which pea fiber can address without introducing common allergens. According to the USDA Economic Research Service, U.S. dry pea net exports increased by 40% during the 2024/25 marketing year, partly driven by rising domestic demand for value-added pulse-based ingredients [3]Source: Wilma V. Davis, Catharine Weber, Helen Wakefield, and Seth Wechsler, “Vegetables and Pulses Outlook, April 2025,” U.S. Department of Agriculture Economic Research Service, ers.usda.gov. Food manufacturers are increasingly viewing pea fiber not simply as a nutritional enhancement, but as a core structural component in gluten-free formulations. This shift helps reduce product development and testing time while supporting consistent repeat use across bakery, pasta, and snack applications. In addition, pea fiber’s clean-label appeal strengthens its competitive position against more technically complex hydrocolloid systems in both North American and European markets.
Growing Consumer Preference for Clean-Label Ingredients
Clean-label preferences are increasingly influencing mainstream product reformulation across the pea fiber market, moving beyond niche premium categories. Ingredion reported that 56% of global consumers were willing to pay more for products made with recognizable ingredients, while 38% of new food and beverage launches in the United States and Canada featured clean-label claims in 2025. Pea fiber aligns well with these expectations because it can be listed simply as “pea fiber” or “yellow pea fiber” on packaging, avoiding complex technical terminology. Roquette also reflected this trend at the supply-chain level by continuing NOP-certified processing for its organic pea ingredient portfolio sourced from Canadian Prairie peas. As consumers place greater emphasis on shorter and more transparent ingredient lists, particularly in plant-based and organic products, the pea fiber market is expected to benefit from the simplicity and familiarity of pea fiber labeling.
Increasing Regulatory Support for Fiber-Enrichment Claims
Regulatory conditions are becoming more supportive for fiber-enriched products, helping simplify commercialization within the pea fiber market. In March 2025, European Food Safety Authority concluded that the pea fiber concentrate FIPEA presented no safety concerns at the proposed usage levels, including applications of up to 10,000 mg/kg in categories such as fine bakery products, dairy alternatives, fermented milk products, and flavored beverages. This opinion provides a clearer regulatory pathway in the European Union for soluble pea fiber while reducing previous concerns related to lectin safety and potential genotoxicity. In addition, a 2025 review published in Foods noted that compliance with FDA and GB 2760 processing aid standards has become a standard requirement in ingredient documentation. Together, these regulatory developments are helping shorten the timeline between technical product development and commercial shelf placement, supporting a stronger pace of innovation across the pea fiber market.
Restraints Impact Analysis*
| Restraint | (~) % Impact on CAGR Forecast | Geographic Relevance | Impact Timeline |
|---|---|---|---|
| Volatility in Yellow Pea Prices and Supply Availability | -0.6% | Global, with particular impact on North America and Europe processing hubs | Short term (≤ 2 years) |
| Sensory and Texture Challenges at Higher Inclusion Levels | -0.3% | Global, affecting all application segments | Medium term (2-4 years) |
| Increasing Competition from Alternative Fiber Ingredients | -0.4% | Global, with varying intensity by application segment | Medium term (≥ 4 years) |
| Limited Penetration Across Developing Markets | -0.2% | Asia-Pacific, Middle East and Africa, South America | Long term (≥ 4 years) |
| Source: Mordor Intelligence | |||
Volatility in Yellow Pea Prices and Supply Availability
Trade-driven volatility in yellow pea pricing emerged as a significant near-term constraint on the pea fiber market in 2025, with disruption stemming primarily from international trade policy shifts rather than underlying crop supply limitations. Alberta Pulse Growers reported that China’s implementation of a 100% tariff on Canadian peas in March 2025 led to an immediate decline of approximately CAD 1.25 per bushel in yellow pea bids, accelerating pricing pressure across upstream agricultural and downstream ingredient supply chains. Although lower feedstock costs may offer short-term margin advantages for pea ingredient manufacturers, elevated trade uncertainty continues to weaken visibility for long-term procurement strategies, capacity expansion planning, and capital allocation across the pea fiber market. The volatility also increases operational risk for processors with concentrated sourcing exposure, particularly those dependent on single-country procurement structures. In contrast, vertically integrated suppliers and companies with diversified sourcing networks, multi-regional supply agreements, and stronger inventory management capabilities are expected to demonstrate greater resilience and pricing flexibility under fluctuating trade conditions.
Increasing Competition from Alternative Fiber Ingredients
The pea fiber market continues to face competitive pressure from established alternative fibers such as psyllium husk, chicory inulin, oat beta-glucan, apple fiber, and citrus fiber, all of which compete across functional, nutritional, and clean-label applications. COSUCRA has reinforced this competitive landscape through its multi-fiber ingredient strategy, reflecting how food manufacturers increasingly evaluate multiple fiber systems simultaneously rather than standardizing around a single ingredient platform. Several competing fibers also benefit from longer commercialization histories and stronger clinical positioning related to digestive health, glycemic management, or cardiovascular support, providing them with an advantage in formulation and marketing discussions. However, ongoing research published in Food Hydrocolloids is helping strengthen pea fiber’s value proposition by demonstrating favorable microbiome-related outcomes in blended fiber applications. As competition intensifies, differentiation within the pea fiber market is expected to depend less on commodity pricing and more on the development of application-specific grades, functionality optimization, and clinically supported performance claims.
*Our forecasts treat driver/restraint impacts as directional, not additive. The impact forecasts reflect baseline growth, mix effects, and variable interactions.
Segment Analysis
By Category: Conventional Volumes Dominate, Organic Certification Reshapes Premium Positioning
Conventional pea fiber represented 86.4% of total market value in 2025, supported by the scale efficiencies and procurement advantages of well-established commodity-linked supply chains. Across the food and beverage sector, manufacturers continue to prioritize cost optimization and supply reliability over organic certification, particularly in high-volume applications such as bakery products and meat alternatives. In addition, strong yellow pea production bases in countries such as France and Germany continue to reinforce the cost competitiveness of conventional pea fiber grades within European food manufacturing. As a result, conventional formats remain the dominant volume driver across the pea fiber industry.
In contrast, organic pea fiber is projected to expand at a CAGR of 7.7% through 2031, positioning it as the faster-growing segment within the market. Roquette has demonstrated this transition through its certified organic pea ingredient portfolio sourced from Prairie farms and processed at its Portage la Prairie facility under NOP and equivalent certification standards. The strategy reflects a broader industry shift toward fully integrated organic supply chains rather than dependence on fragmented spot-certification models.


By Application: Food and Beverage Anchors Demand as Supplements Emerge as the Speed Lane
Food and beverages accounted for 71.5% of total pea fiber market value in 2025, maintaining the segment’s position as the industry’s primary demand center. Within this category, bakery and confectionery applications represented the largest share, supported by pea fiber’s ability to enhance moisture retention, improve crumb structure, and extend shelf life in gluten-free and whole-grain formulations. Meat and meat substitute applications also remained a significant growth area, where pea fiber contributes functional benefits such as water retention, fat binding, texture optimization, and reduced cooking loss in plant-based products. Additional applications across snacks, soups, sauces, beverages, pet food, animal nutrition, and pharmaceutical formulations continue to broaden the commercial base of the pea fiber market, although these segments currently represent a smaller share of overall revenue.
Dietary supplements are projected to register a CAGR of 7.2% through 2031, making them the fastest-growing application segment within the pea fiber market. Research published in Food Hydrocolloids demonstrated that pea fiber blends promoted the growth of Bacteroides while reducing potentially harmful nitrogen-related metabolites in vitro, strengthening the ingredient’s positioning within gut-health and microbiome-focused product development.

Geography Analysis
North America accounted for 36.9% of total market value in 2025, positioning it as the largest regional market within the pea fiber industry. The region benefits from a tightly integrated supply chain connecting Canadian yellow pea production with processing and food manufacturing demand across the United States and Canada. This structural advantage supports consistent raw material availability and strengthens supply reliability for processors serving the clean-label, gluten-free, and plant-based food sectors. Europe remained the second-largest regional market, supported by established processing ecosystems in Germany, France, Belgium, and Netherlands, where vertically integrated ingredient companies maintain long-term farmer partnerships, localized sourcing networks, and mature production infrastructure.
Asia-Pacific is projected to expand at a CAGR of 5.8% through 2031, making it the fastest-growing regional market for pea fiber. Growth is being driven by rising health awareness, increasing reformulation activity, and expanding demand for fiber-enriched foods across major consumer markets, particularly China.
South America remains comparatively underpenetrated despite Brazil’s large-scale food processing sector and Argentina’s strong agricultural export capabilities. Meanwhile, the Middle East and Africa presents longer-term growth potential, although limited domestic pea cultivation and continued dependence on imported ingredients constrain current market expansion. Across both regions, broader adoption will depend on improvements in ingredient distribution networks, localized formulation expertise, and end-user awareness.

Competitive Landscape
The competitive landscape of the pea fiber market remains moderately concentrated, with participation from both large vertically integrated processors and specialized mid-sized ingredient suppliers. Competitive positioning is strongly influenced by processing scale, long-term farmer sourcing agreements, and technical application support, all of which continue to shape customer confidence, supply continuity, and commercial reliability. Across the market, leading participants are increasingly pursuing strategies centered on geographic expansion, diversification of pea-based ingredient portfolios, and greater investment in customer-oriented formulation and application development capabilities.
Emsland Group strengthened its processing infrastructure through 2025/26 investments that included a 40,000-tonne starch silo in Kyritz and expanded wastewater treatment capacity in Golßen, supporting more efficient year-round pea and potato processing operations. Meanwhile, COSUCRA enhanced its sustainability positioning through B Corp certification in November 2024, aligning with the growing importance of environmental and social procurement standards among global food manufacturers.
Processing technology is also emerging as a key competitive differentiator within the pea fiber market. Dry fractionation technologies are gaining traction because they reduce water consumption, solvent dependence, and overall energy requirements while lowering capital intensity for regional market entrants. This transition is gradually reducing some of the traditional cost advantages held by wet-processing operators that historically benefited from higher-purity output economics.
Pea Fiber Industry Leaders
Roquette Frères
Emsland Group
Cosucra Groupe Warcoing
AGT Food and Ingredients Inc.
The Scoular Company
- *Disclaimer: Major Players sorted in no particular order

Recent Industry Developments
- March 2026: Louis Dreyfus Company announced the commissioning of its integrated pea processing facility in Yorkton, Saskatchewan, which includes production of pea fiber alongside pea protein isolate and starch. The investment strengthens North American pea ingredient supply capacity and supports growing demand for functional pea fiber applications in clean-label and plant-based food formulations.
- May 2025: Roquette completed the acquisition of IFF Pharma Solutions for USD 2.85 billion, expanding its pharmaceutical excipients portfolio and strengthening its position in health and nutrition markets. The acquisition enhanced Roquette's capabilities in plant-based ingredient applications, including pea fiber formulations.
- July 2024: The Emsland Group partnered with Caldic to strengthen its market presence in Denmark, Norway, and Iceland. The partnership aimed to distribute plant-based ingredients, including pea fiber, and address the increasing demand for sustainable functional ingredients in Scandinavian markets.


Global Pea Fiber Market Report Scope
Pea fiber is a plant-based dietary fiber ingredient derived primarily from yellow peas and widely used in food formulations for its functional benefits, including moisture retention, texture improvement, fat replacement, and clean-label positioning.
The pea fiber market is segmented by category, application, and geography. Based on category, the market is divided into conventional and organic/natural pea fiber. By application, the market is classified into food and beverages, dietary supplements, pet food and animal feed, pharmaceuticals, and other industrial applications. Geographically, the market is segmented into North America, Europe, Asia-Pacific, South America, and the Middle East & Africa. Market forecasts are provided in terms of value (USD) and volume (tons).
| Conventional |
| Natural/Organic |
| Food and Beverages | Bakery and Confectionery |
| Meat and Meat Subtitutes | |
| Snacks | |
| Soups and Sauces | |
| Beverages | |
| Other Food and Beverages Application | |
| Dietary Supplements | |
| Pet Food and Animal Feed | |
| Pharmaceuticals | |
| Other Application |
| North America | United States |
| Canada | |
| Rest of North America | |
| Europe | Germany |
| France | |
| Spain | |
| Netherlands | |
| Rest of Europe | |
| Asia-Pacific | China |
| India | |
| Australia | |
| Rest of Asia-Pacific | |
| South America | Brazil |
| Rest of South America | |
| Middle East and Africa |
| By Category | Conventional | |
| Natural/Organic | ||
| By Application | Food and Beverages | Bakery and Confectionery |
| Meat and Meat Subtitutes | ||
| Snacks | ||
| Soups and Sauces | ||
| Beverages | ||
| Other Food and Beverages Application | ||
| Dietary Supplements | ||
| Pet Food and Animal Feed | ||
| Pharmaceuticals | ||
| Other Application | ||
| By Geography | North America | United States |
| Canada | ||
| Rest of North America | ||
| Europe | Germany | |
| France | ||
| Spain | ||
| Netherlands | ||
| Rest of Europe | ||
| Asia-Pacific | China | |
| India | ||
| Australia | ||
| Rest of Asia-Pacific | ||
| South America | Brazil | |
| Rest of South America | ||
| Middle East and Africa | ||


Key Questions Answered in the Report
What is the projected value of the pea fiber market by 2031?
The pea fiber market is expected to reach USD 1.68 billion by 2031, reflecting a 6.23% CAGR from 2026.
Which region will grow fastest in pea fiber demand through 2031?
Asia-Pacific is forecast to post the quickest 5.83% CAGR as plant-protein beverages and fortified snacks gain momentum.
Why are organic pea fiber attracting interest?
Organic pea fiber is attracting interest due to rising consumer demand for clean-label, traceable, and sustainably sourced ingredients
How does organic certification influence pea fiber pricing?
Organic pea fiber typically achieves 15%–25% pricing premiums, contributing to a projected CAGR of 7.68% through 2031 as consumers increasingly prioritize clean-label and certified ingredient assurance.
Page last updated on:


