Pea Starch Market Size and Share
Market Overview
| Study Period | 2021 - 2031 |
|---|---|
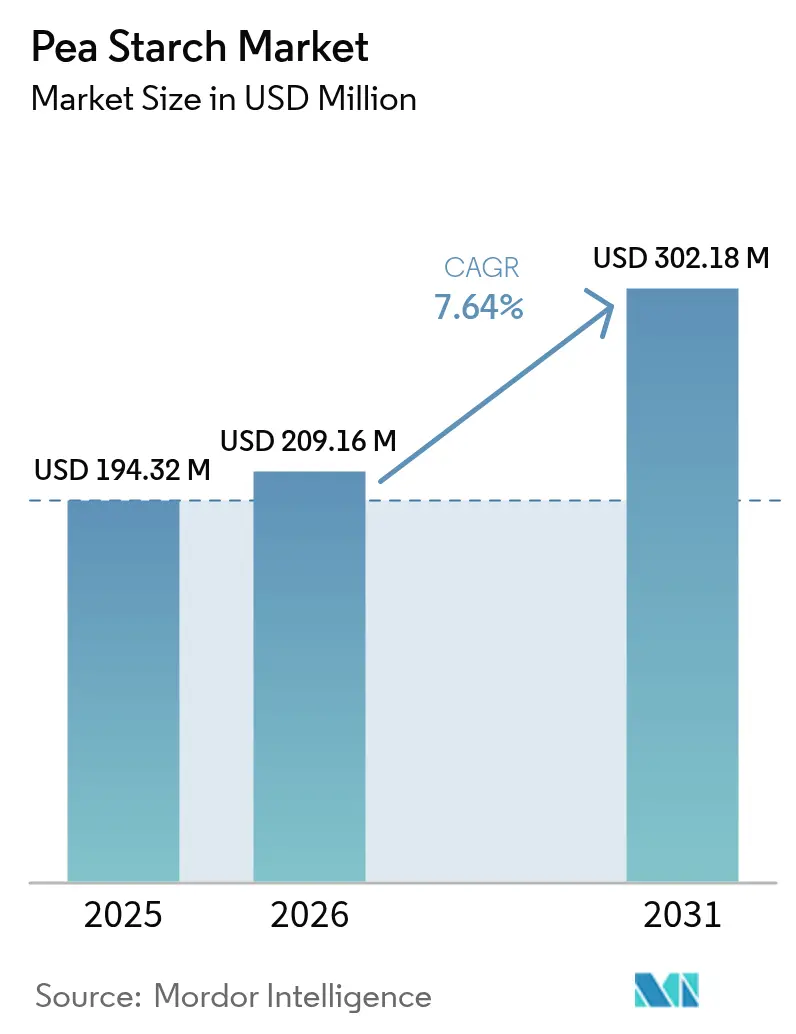
| Market Size (2026) | USD 209.16 Million |
| Market Size (2031) | USD 302.18 Million |
| Growth Rate (2026 - 2031) | 7.64% CAGR |
| Fastest Growing Market | North America |
| Largest Market | Europe |
| Market Concentration | Medium |
Major Players
*Disclaimer: Major Players sorted in no particular order Image © Mordor Intelligence. Reuse requires attribution under CC BY 4.0. |
|
Pea Starch Market Analysis by Mordor Intelligence
The pea starch market size was valued at USD 194.32 million in 2025 and estimated to grow from USD 209.16 million in 2026 to reach USD 302.18 million by 2031, at a CAGR of 7.64% during the forecast period (2026-2031). This growth is driven by a surging demand for clean-label formulations and supportive policies promoting sustainable protein sources. The International Food Information Council reported that in 2023, 29% of U.S. consumers prioritized "clean ingredients" in their food and beverage purchases[1]Source: International Food Information Council, "Food & Health Survey 2023", ific.org. Responding to this trend, food processors are reformulating products to eliminate synthetic thickeners. Simultaneously, renowned personal-care brands are substituting talc and microplastics with plant-based powders, boosting demand for pea derivatives. To tackle immediate supply challenges and enhance margins, integrated pulse-processing hubs are emerging across North America, Europe, and the Asia-Pacific. Furthermore, companies are investing in research and development, with a focus on advanced separation technologies. These innovations produce high-purity starch fractions with enhanced gel strength, tapping into premium markets such as cosmetics, nutraceutical coatings, and 3D food printing.
Key Report Takeaways
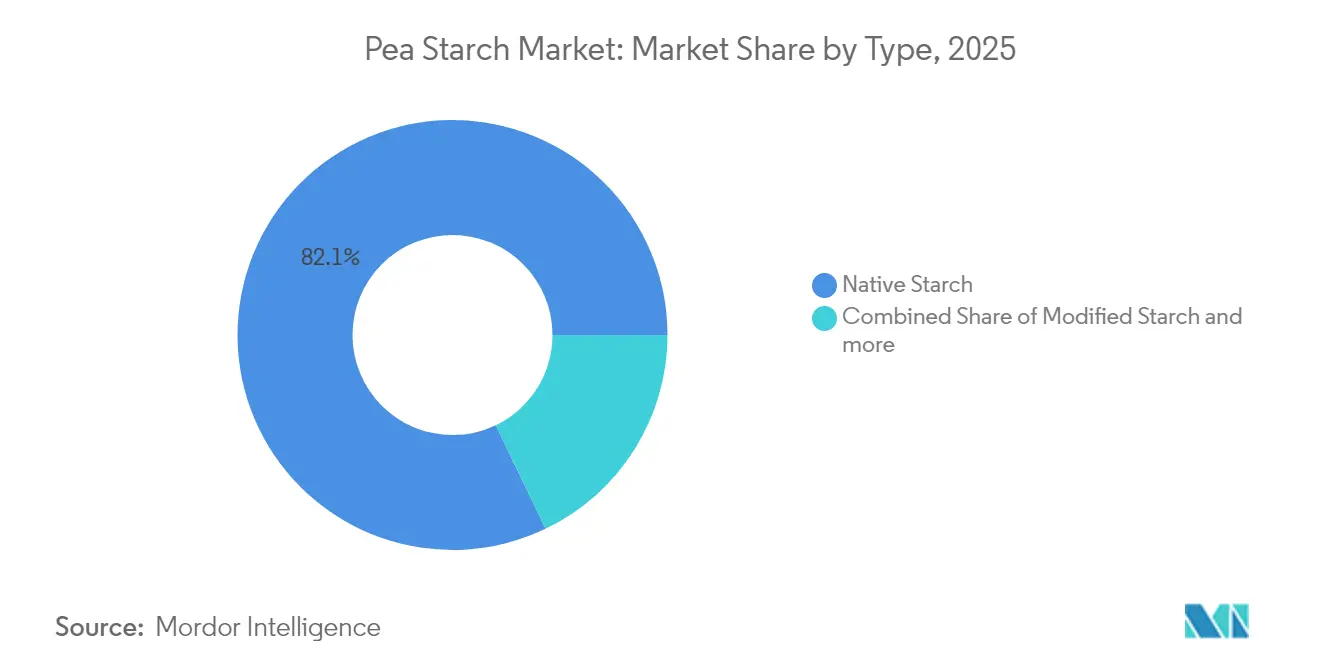
- By product type, native starch captured 82.12% of the pea starch market share in 2025, and modified starch is projected to expand at a 9.38% CAGR through 2031.
- By source, conventional grades held 86.55% share of the pea starch market size in 2025, while organic grades are projected to grow at 11.32% CAGR to 2031.
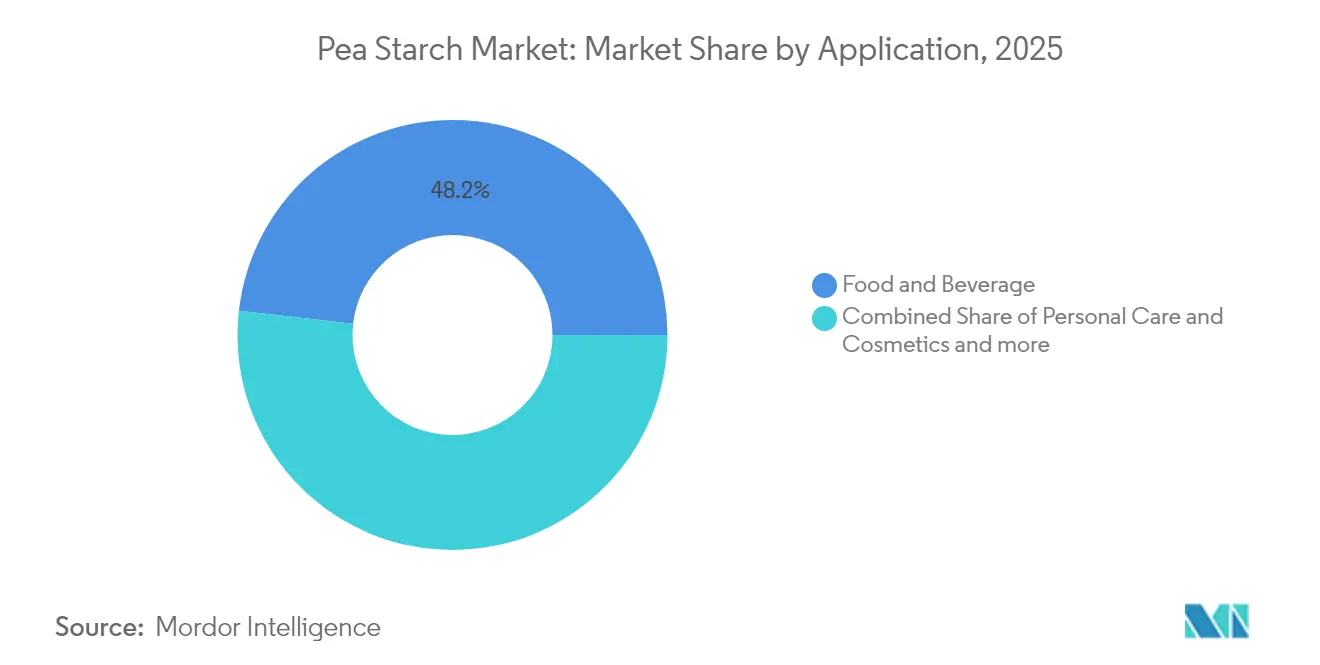
- By application, food and beverages accounted for 48.21% of the revenue share in 2025; personal care and cosmetics are projected to advance at a 11.57% CAGR through 2031.
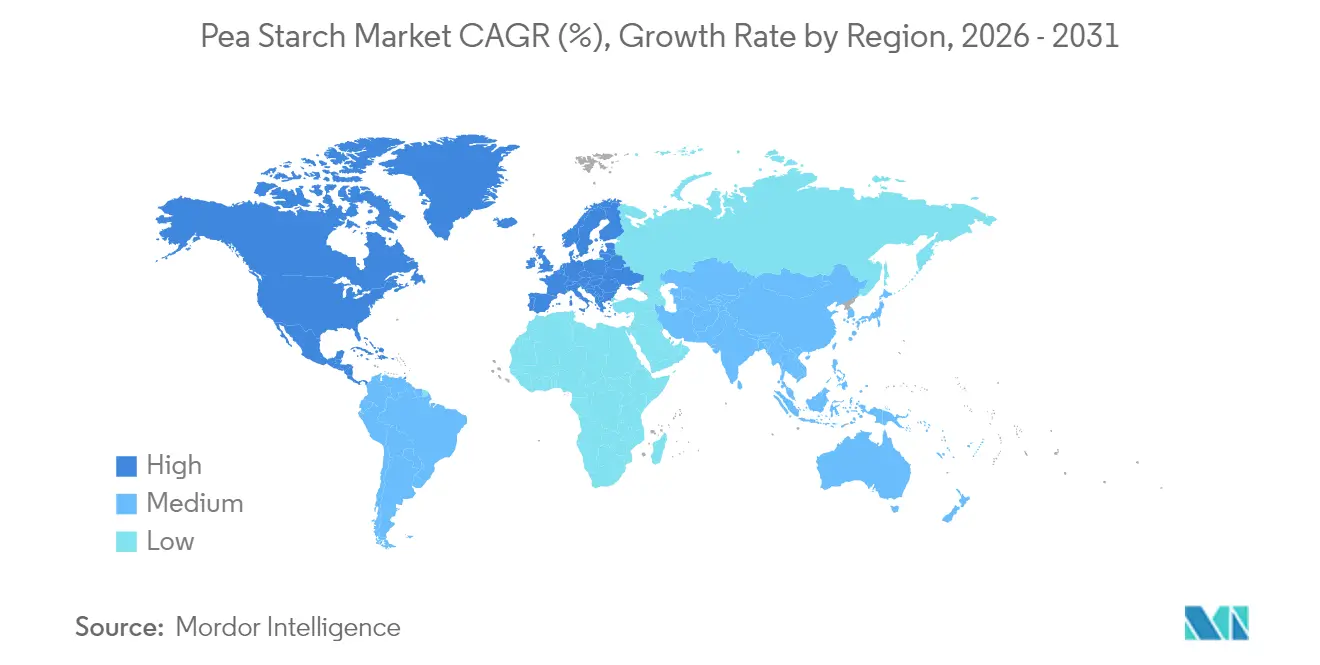
- By geography, North America led the pea starch market with a 32.05% market share in 2025, whereas the Asia-Pacific is forecast to record the fastest regional CAGR of 12.08% from 2025 to 2031.
Note: Market size and forecast figures in this report are generated using Mordor Intelligence’s proprietary estimation framework, updated with the latest available data and insights as of 2026.
Global Pea Starch Market Trends and Insights
Drivers Impact Analysis*
| Driver | (~) % Impact on CAGR Forecast | Geographic Relevance | Impact Timeline |
|---|---|---|---|
| Rising demand for plant-based proteins and ingredients | +2.1% | Global, with the strongest impact in North America and Europe | Medium term (2-4 years) |
| Increased use in animal feed and pet food | +1.4% | North America and Europe, expanding to the Asia-Pacific | Long term (≥ 4 years) |
| Functional properties in food and beverage applications | +1.8% | Global, particularly strong in the Asia-Pacific | Short term (≤ 2 years) |
| Innovation in personal care and cosmetics | +1.2% | Europe and North America, emerging in the Asia-Pacific | Medium term (2-4 years) |
| Technological advancements in pea processing | +0.9% | Global, led by North America and Europe | Long term (≥ 4 years) |
| Growth in functional foods and sports nutrition | +1.3% | Global, led by North America and Europe | Long term (≥ 4 years) |
| Source: Mordor Intelligence | |||
Rising demand for plant-based proteins and ingredients
As consumers increasingly gravitate towards plant-based options, demand for functional ingredients that mimic animal-derived properties has surged. The FDA's GRAS designation for several pea-derived ingredients has spurred their mainstream adoption, bolstered by positive assessments from the EFSA, paving the way for a broader European market presence. This regulatory endorsement enables manufacturers to modify existing products with minimal bureaucratic hurdles. The trend isn't just about consumption; it's about the functionality of ingredients. For instance, pea starch's binding and texturizing capabilities are pivotal in crafting plant-based meat alternatives. Recent strides in this domain include Roquette's March 2024 expansion of its NUTRALYS range, focusing on specialized pea starch derivatives to enhance gel strength and modify texture. This synergy of consumer demand, regulatory backing, and technical advancements fuels a robust market growth, transcending typical commodity cycles.
Increased use in animal feed and pet food
Driven by sustainability concerns and the need for supply chain diversification, the animal nutrition sector is increasingly turning to pea-derived ingredients as alternatives to traditional protein and carbohydrate sources. Additionally, the growing number of animal farms and animals is further driving the consumption of animal feed, creating new opportunities for players to develop animal feed with pea starch that offers functional benefits for growth. For instance, Godrej Agrovet Limited sold about 1.5 million tons of animal feed in the financial year 2023 (2022: 1.36 million tons). Research from ADM reveals that dogs and cats digest plant proteins in a manner similar to animal proteins, challenging long-standing beliefs about pet nutrition. This scientific endorsement paves the way for significant market opportunities, particularly as pet owners increasingly opt for sustainable and hypoallergenic options. Regulatory bodies in key markets are backing this growth, with feed safety authorities endorsing pea starch as a valid ingredient for pet nutrition. Innovations in processing enable manufacturers to enhance the properties of pea starch, tailoring them for animal nutrition by boosting palatability and digestibility. The sector's expansion is further fueled by the premiumization trend in pet food, where plant-based ingredients fetch higher margins than traditional feed.
Functional properties in food and beverage applications
Pea starch stands out in the food industry, especially where clean-label and allergen-free priorities are paramount. Offering gluten-free benefits, pea starch outperforms corn starch in binding properties for high-moisture applications. Its neutral flavor and freeze-thaw stability make it a top choice for the rapidly growing frozen food segment in the Asia-Pacific. Recent studies have highlighted the potential of pea starch in encapsulation, broadening its applications beyond thickening and binding. Manufacturers are now innovating by tweaking the molecular structure of pea starch to enhance properties such as gel strength and thermal stability. These functional benefits, combined with a clean-label appeal, allow for premium pricing over standard commodity starches.
Innovation in personal care and cosmetics
As the cosmetics industry shifts towards natural and sustainable ingredients, pea starch derivatives are poised to benefit, particularly in formulations that require film-forming and texturizing properties. Nouryon's introduction of Structure Silk, a pea-based starch tailored for personal care, underscores the commercial potential of this niche. With its biodegradable and non-comedogenic attributes, Structure Silk resonates with the growing consumer demand for eco-friendly beauty solutions. Furthermore, major markets, from the EU to the U.S., are backing the trend, as seen in their regulatory nods to plant-derived starches in cosmetics. Innovations in technology are paving the way for advanced pea starch derivatives, boasting enhanced sensory traits such as a smoother skin feel and reduced tackiness. Notably, personal care applications yield margins that far surpass those in the food sector, presenting a lucrative opportunity for manufacturers ready to navigate specialized processing and regulatory landscapes.
Restraints Impact Analysis*
| Restraint | (~) % Impact on CAGR Forecast | Geographic Relevance | Impact Timeline |
|---|---|---|---|
| Competition from other starches | -1.6% | Global, particularly intense in the Asia-Pacific | Short term (≤ 2 years) |
| Raw material supply fluctuations | -1.9% | Global, most severe in North America | Short term (≤ 2 years) |
| High processing costs and limited scalability | -1.1% | Global, constraining smaller producers | Medium term (2-4 years) |
| Evolving and stringent regulations | -0.7% | Europe and North America, emerging in the Asia-Pacific | Long term (≥ 4 years) |
| Source: Mordor Intelligence | |||
Competition from other starches
Established sources, such as corn and potatoes, with their mature supply chains and economies of scale, dominate the starch market. This dominance exerts pricing pressure on pea starch across various applications. Corn starch, with its commodity pricing and broad availability, poses a significant challenge to pea starch, particularly in cost-sensitive applications such as industrial adhesives and textile sizing. The growing production of corn, in comparison to peas, further supports corn's status as an affordable raw material. According to the US Department of Agriculture, in 2024/2025, India's corn production volume reached about 38 million metric tons[2]Source: US Department of Agriculture, "USDA-grain: world markets and trade-2025", fas.usda.gov. In contrast, the Ministry of Agriculture and Farmers Welfare (India) reported India's production volume of tur or pigeon pea at around 3 million metric tons in the financial year 2024. Regional competitive dynamics show that Asia-Pacific markets, backed by established supplier relationships and processing infrastructure, heavily favor these dominant starch sources. However, pea starch finds its niche in applications where its unique functional properties or clean-label appeal justify a premium price. Trade disputes, such as the PURIS petition regarding Chinese dumping practices, further complicate the landscape by affecting pea protein imports and altering competitive dynamics. Additionally, rival starch sources are investing in modification technologies to replicate the functional benefits of pea starch.
Raw material supply fluctuations
Weather dependency and a limited geographic concentration of production make pea cultivation inherently volatile, leading to supply chain risks that impact starch processing operations. The Australian Bureau of Agricultural and Resource Economics and Sciences reported that in the financial year 2024, field pea production in New South Wales, Australia, was estimated at 40 kilotons, down from 47.25 kilotons the previous year[3]Source: Australian Bureau of Agricultural and Resource Economics and Sciences, "Australian crop report March 2025", agriculture.gov.au. Price volatility in raw materials, highlighted by an 80% surge in pea protein prices, underscores broader supply-demand imbalances throughout the pea processing value chain. Concentrating pea production in regions such as the Canadian Prairies and northern U.S. states heightens vulnerability to local weather events and shifts in policy. Moreover, constraints in processing capacity, especially with limited tertiary processing infrastructure compared to primary agricultural output, exacerbate supply challenges. Ensuring long-term supply security mandates investments in both expanding cultivation and enhancing processing capacities. However, these investments pose challenges for smaller market players and could potentially stifle overall market growth rates.
*Our forecasts treat driver/restraint impacts as directional, not additive. The impact forecasts reflect baseline growth, mix effects, and variable interactions.
Segment Analysis
By Type: Native Starch Dominance Drives Market Foundation
In 2025, native starch captures a commanding 82.12% of the market, underscoring its widespread use in both food and industrial sectors. This preference aligns with the rising clean-label trend, emphasizing minimal processing. Native starch's market dominance is bolstered by its cost-effectiveness and a more straightforward regulatory pathway, often facing less scrutiny than its chemically modified counterparts. On the other hand, while modified starch holds a smaller slice of the market, it's on a rapid ascent, boasting a 9.38% CAGR projected through 2031. This surge is fueled by niche applications that demand superior functional properties. Innovations in modification techniques, particularly enzymatic and physical methods, enable processors to craft bespoke starch derivatives, thereby avoiding the use of chemical additives. The regulatory environment is favorable for both native and modified starches. The FDA's GRAS recognition applies to various forms of pea starch, whereas the EFSA guides applications in Europe. Meanwhile, advancements in processing technologies allow manufacturers to not only refine native starch extraction but also to innovate modified variants for high-end applications. This dual approach enables portfolio diversification, striking a balance between volume and profit margins.
Within the modified starch segment, cross-linked and acetylated pea starches are emerging as prime candidates, especially for uses that demand better freeze-thaw stability and superior binding characteristics. Responding to the rising appetite for certified organic ingredients in upscale food products, there's a notable push towards developing organic modified pea starches. Patent filings highlight a vibrant landscape of innovation in modification techniques, spotlighting fresh methods aimed at bolstering gel strength and thermal stability, all while maintaining a clean-label appeal.


By Source: Conventional Leads While Organic Accelerates
In 2025, conventional pea starch commands a dominant 86.55% market share, thanks to well-established supply chains and cost efficiencies that cater to a wide range of applications. This dominance is rooted in the mature infrastructure for non-organic pea cultivation and processing, especially in key regions like Canada and the northern U.S. Meanwhile, organic pea starch is on a rapid ascent, projected to grow at an 11.32% CAGR through 2031. This surge is fueled by its premium market positioning and robust regulatory backing for organic products. Organic pea ingredients fetch a notable price premium, often 30-50% higher than their conventional counterparts. This pricing dynamic offers lucrative margins for processors who invest in organic certification and bolster their supply chains.
Roquette's organic pea ingredient offerings, directly sourced from Canadian organic farmers, underscore the market's appetite for certified organic products and their commercial viability. However, the journey for organic pea starch isn't without hurdles. Limited organic pea cultivation and elevated production costs pose challenges, especially for price-sensitive applications. Transitioning from conventional to organic isn't just a shift; it's a significant investment in supply chain alterations and certification, presenting hurdles for smaller processors. Yet, with regulatory frameworks like USDA Organic and EU Organic certifications championing organic ingredients, the market access benefits they confer make the premium pricing strategies all the more justifiable.
By Application: Food Dominance Meets Personal Care Innovation
In 2025, food and beverage applications dominate the market, holding a 48.21% share. This is largely due to the functional properties of pea starch in baked goods, soups, sauces, and processed foods. Here, clean-label positioning and allergen avoidance offer distinct competitive advantages. Within the food sector, bakery products lead the pack, leveraging pea starch's binding properties and neutral flavor to enhance texture and cater to the growing demand for gluten-free products. Meanwhile, the personal care and cosmetics sector is witnessing the fastest growth, projected at a 11.57% CAGR through 2031. This surge highlights the industry's shift toward natural and sustainable ingredients. Notably, Roquette's January 2024 launch of the Beauté by Roquette ST series underscores the commercial momentum in cosmetic applications. The animal feed and pet food sectors are also experiencing a steady rise, buoyed by research that endorses the digestibility of plant protein and a growing consumer preference for sustainable pet nutrition. Additionally, while industrial uses and biodegradable packaging are currently niche, they present significant long-term opportunities, particularly as global sustainability regulations become more stringent.
The burgeoning personal care segment hints at lucrative premium pricing avenues. Cosmetic-grade pea starch, for instance, fetches prices 2-3 times higher than its food-grade counterparts. Moreover, regulatory backing from cosmetic ingredient databases and safety assessments smoothens the path for specialized pea starch derivatives entering the market.
Geography Analysis
In 2025, North America held a 32.05% share of the pea starch market, largely due to its proximity to major pulse fields and advanced wet-milling facilities that streamline freight and conversion costs. The region's long-standing GRAS status eases compliance across diverse industries, facilitating quicker iterations of products. Capital investments remain robust, exemplified by Ingredion’s USD 50 million upgrade in Cedar Rapids in February 2025, which boosted specialty starch line throughput. Yet, with droughts leading to reduced acreage, the region's supply vulnerability comes to the fore, prompting research and development into drought-resistant pea varieties, a move poised to enhance regional resilience in the long run.
Asia-Pacific emerges as the fastest-growing market, boasting a 12.08% CAGR, driven by swift industrialization in food processing and a burgeoning middle class with disposable income. In China, chilled-food producers are turning to pea starch as a gluten-free thickener in delicatessen items, aligning with urban health trends. India's late 2024 rollout of the FSSAI vegan-logo framework provides brand owners with a regulatory foundation for plant-based products. Concurrently, domestic firms are establishing small-scale extraction plants to meet surging local demand. Both Thailand and Vietnam are riding the investment wave, eyeing both regional consumption and export opportunities in ready-meal kits.
Europe witnesses steady growth, largely steered by policy initiatives. Circular-economy mandates and innovations, like Lantmännen and Ingredion’s planned EUR 100 million facility for European pea isolate production by 2027, underscore this trend. The continent's rigorous sustainability and traceability standards act as a deterrent to opportunistic imports, inadvertently bolstering local producers. Meanwhile, South America and the Middle East and Africa, though still in the early stages, are showing a growing interest, especially from beverage thickener suppliers and halal-certified confectionery brands in pursuit of clean-label ingredients.

Competitive Landscape
The market structure is moderately fragmented, with the top five companies commanding an estimated 60% share. Roquette, Ingredion, and Cargill utilize vertical integration and proprietary wet-milling technology, positioning themselves as cost leaders. They focus on high-functionality starch derivatives, catering to sectors like meat analogues, cosmetic films, and nutraceutical capsules. In a move highlighting the industry's trend, Ingredion invested USD 200 million in May 2025 to gain full ownership of Verdient Foods, aiming to control upstream protein and starch assets and mitigate risks related to feedstock pricing and quality.
Mid-tier firms are honing in on regional strengths. For instance, Cosucra, based in Belgium, is channeling a EUR 200 million investment into its local production sites. They stand out with non-GMO certifications and specialty co-products, such as pea fiber, enabling them to offer attractive packages to European bakery chains. While Chinese suppliers traditionally thrived on volume exports and competitive pricing, surging domestic labor and energy costs are challenging this advantage. Notable innovations in 2024 include Roquette's patent on an enzyme-free cross-linking method and Cargill's claims on ultrafine particle milling for enhanced film properties.
Collaborations are becoming pivotal for technology sharing and market entry. A case in point is Ingredion and Lantmännen's venture, which underscores how joint capital can expedite capacity expansion and secure off-take agreements. Additionally, licensing agreements with equipment manufacturers are facilitating the rapid deployment of continuous extraction columns, which notably reduce water usage by about 18%, aligning with ESG standards. As global markets evolve, the focus is shifting from commodity pricing to functional specialization. Producers entering late are carving niches, finding success in ultra-specific areas like biodegradable polymer fillers and clean-label sports drink thickeners.
Pea Starch Industry Leaders
-
Ingredion Incorporated
-
Roquette Frères
-
Cosucra- Groupe Warcoing
-
Groupe Emsland
-
Puris Foods
- *Disclaimer: Major Players sorted in no particular order


Recent Industry Developments
- August 2024: Cosucra, a leading ingredient producer, has teamed up with DKSH to broaden the reach of its chicory root fiber and pea-derived ingredients, such as pea starch, across Australia and New Zealand. Under this partnership, DKSH is empowered to offer a comprehensive suite of business development services in various regions, aiming to capitalize on the surging appetite for health-centric, plant-based products in both Australia and New Zealand.
- June 2024: Bunge collaborated with European agricultural company Golden Fields to establish a new facility in Latvia that will exclusively supply Bunge with dry-milled pea and faba bean protein concentrates. This partnership secured the supply chain for key pea ingredients, including pea starch, for manufacturers.
- May 2024: Canadian company BioNeutra Global Corporation announced a partnership with Protein Industries Canada (PIC), which includes Roquette as a collaborator, to innovate within the pea starch segment. The goal of this project is to use pea starch, a byproduct of pea protein extraction, as a raw material to develop value-added ingredients, such as a pea-based isomalto-oligosaccharide (IMO) sweetener.
- April 2024: As part of a series of plant-based excipients and ingredients, Roquette, a major pea processor, launched several products for the cosmetics industry. This includes Beauté by Roquette ST 320 in January and Beauté by Roquette ST 730 in April. While these are not food products, they showcase the increasing range of applications for pea starch beyond traditional food.


Global Pea Starch Market Report Scope
Pea starch is a rich source of amylose (35 %), which gives it good thickening and gelling properties that are better than other commonly used starches. The pea starch market is segmented by source, application, and geography. By source, the market is segmented into organic and conventional. By application, the market is segmented into food and beverage, animal feed and pet food, and clinical nutrition and cosmetics applications. The food and beverage segment is further sub-segmented into bakery products, soups and sauces, snacks and cereals, meat and meat products, dairy, and other food and beverage applications. The market is segmented by geography into North America, Europe, Asia-Pacific, South America, and Middle East and Africa. The market sizing has been done in value terms in USD for all the abovementioned segments.
| Native Starch |
| Modified Starch |
| Organic |
| Conventional |
| Food and Beverage | Bakery Products |
| Soups and Sauces | |
| Snacks and Cereals | |
| Meat and Meat Products | |
| Dairy | |
| Other Food and Beverage Applications | |
| Animal Feed and Pet Food | |
| Personal Care and Cosmetics | |
| Others |
| North America | United States |
| Canada | |
| Mexico | |
| Rest of North America | |
| South America | Brazil |
| Argentina | |
| Rest of South America | |
| Europe | United Kingdom |
| Germany | |
| France | |
| Italy | |
| Spain | |
| Russia | |
| Rest of Europe | |
| Asia-Pacific | China |
| Japan | |
| India | |
| Thailand | |
| Rest of Asia-Pacific | |
| Middle East and Africa | United Arab Emirates |
| South Africa | |
| Saudi Arabia | |
| Rest of Middle East and Africa |
| By Type | Native Starch | |
| Modified Starch | ||
| By Source | Organic | |
| Conventional | ||
| By Application | Food and Beverage | Bakery Products |
| Soups and Sauces | ||
| Snacks and Cereals | ||
| Meat and Meat Products | ||
| Dairy | ||
| Other Food and Beverage Applications | ||
| Animal Feed and Pet Food | ||
| Personal Care and Cosmetics | ||
| Others | ||
| By Geography | North America | United States |
| Canada | ||
| Mexico | ||
| Rest of North America | ||
| South America | Brazil | |
| Argentina | ||
| Rest of South America | ||
| Europe | United Kingdom | |
| Germany | ||
| France | ||
| Italy | ||
| Spain | ||
| Russia | ||
| Rest of Europe | ||
| Asia-Pacific | China | |
| Japan | ||
| India | ||
| Thailand | ||
| Rest of Asia-Pacific | ||
| Middle East and Africa | United Arab Emirates | |
| South Africa | ||
| Saudi Arabia | ||
| Rest of Middle East and Africa | ||


Key Questions Answered in the Report
What is the forecast value of the pea starch market by 2031?
The market is projected to reach USD 302.18 million by 2031, rising at a 7.64% CAGR during the forecast period (2026-2031) from the 2025 base year.
Which region leads in pea starch consumption today?
North America holds the largest share at 32.05%, supported by an integrated processing infrastructure and ample raw material supply.
Why is pea starch popular in personal-care products?
The ingredient delivers film-forming and oil-absorbing benefits, is biodegradable, and meets clean-label expectations, enabling premium cosmetic claims.
How do raw-material shortages affect pea starch pricing?
Production swings such as Canada’s 42% output drop have driven raw-material cost spikes of up to 80%, prompting supply-chain diversification efforts.
Which application segment is expanding the fastest?
Personal care and cosmetics is the fastest-growing application at a 11.57% CAGR through 2031, thanks to natural ingredient demand.
What drives the higher price premium for organic pea starch?
Certification costs, limited acreage, and strong demand for organic snacks and cosmetics allow a 30–50% price premium over conventional grades.
Page last updated on:


