
Dietary Fiber Market Size and Share
Market Overview
| Study Period | 2021 - 2031 |
|---|---|
| Market Size (2026) | USD 10.47 Billion |
| Market Size (2031) | USD 18.98 Billion |
| Growth Rate (2026 - 2031) | 12.62 % |
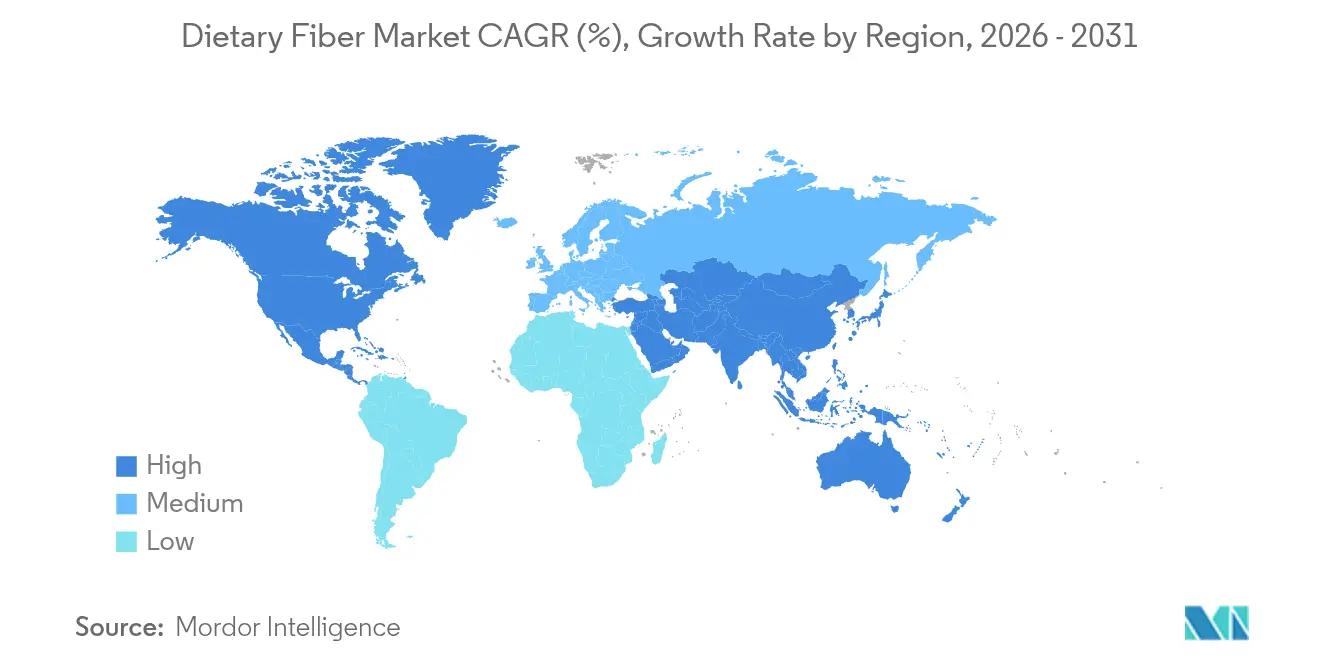
| Fastest Growing Market | Asia Pacific |
| Largest Market | North America |
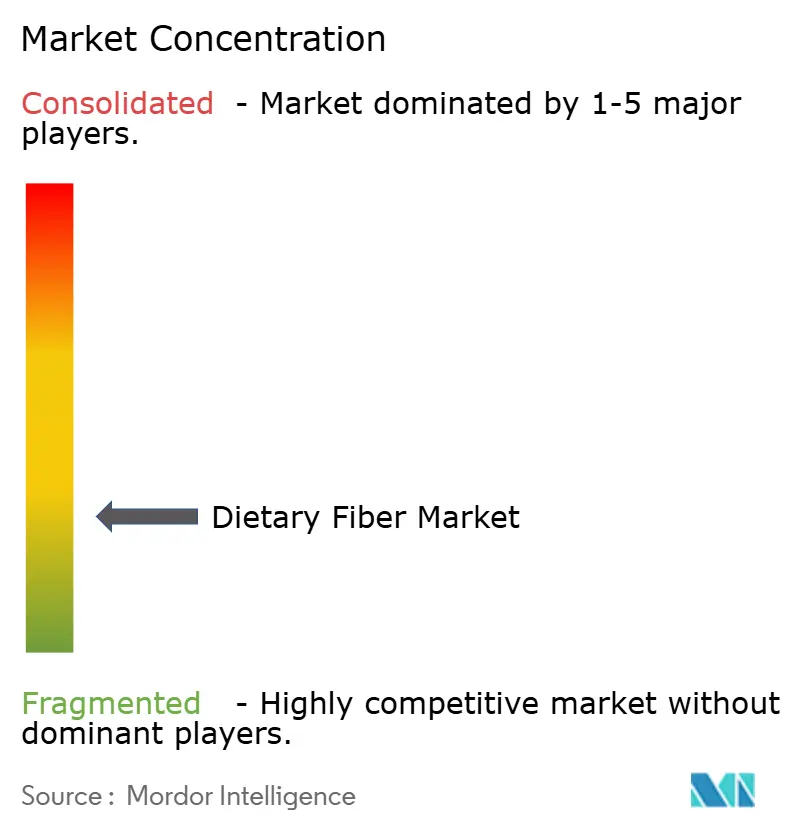
| Market Concentration | Low |
Major Players *Disclaimer: Major Players sorted in no particular order Image © Mordor Intelligence. Reuse requires attribution under CC BY 4.0. | |
Dietary Fiber Market Analysis by Mordor Intelligence
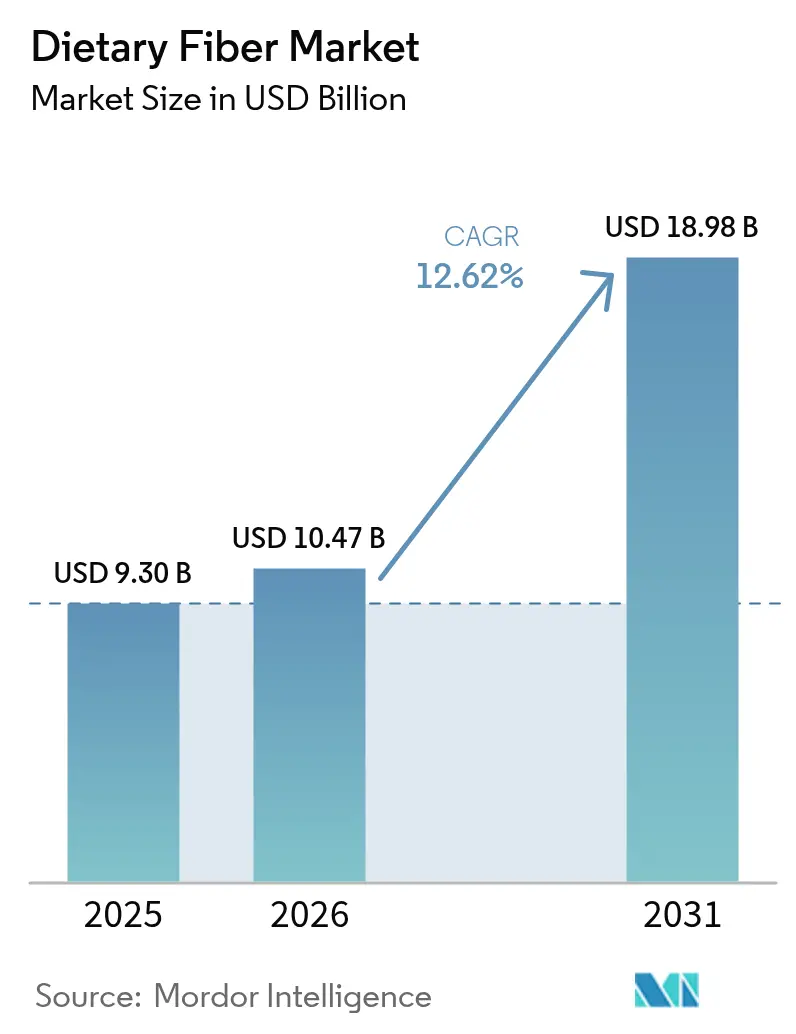
Dietary fiber market size in 2026 is estimated at USD 10.47 billion, growing from 2025 value of USD 9.30 billion with 2031 projections showing USD 18.98 billion, growing at 12.62% CAGR over 2026-2031. This growth reflects increasing consumer awareness of the link between fiber deficiency and chronic diseases, including obesity, cardiovascular conditions, and Type 2 diabetes. The rising prevalence of lifestyle-related diseases has prompted consumers and healthcare systems to emphasize fiber-rich diets. The Food and Drug Administration (FDA) and European Food Safety Authority (EFSA) have approved health claims connecting soluble fiber to heart health and cholesterol reduction, enabling manufacturers to develop new fortified products. Advancements in fiber extraction and food formulation technologies have improved product taste and texture, expanding applications across food, beverages, dietary supplements, and pharmaceuticals. The market growth is further supported by increased focus on gut health, digestive wellness, and weight management, along with rising demand for plant-based and clean-label products containing natural fibers.
Key Report Takeaways
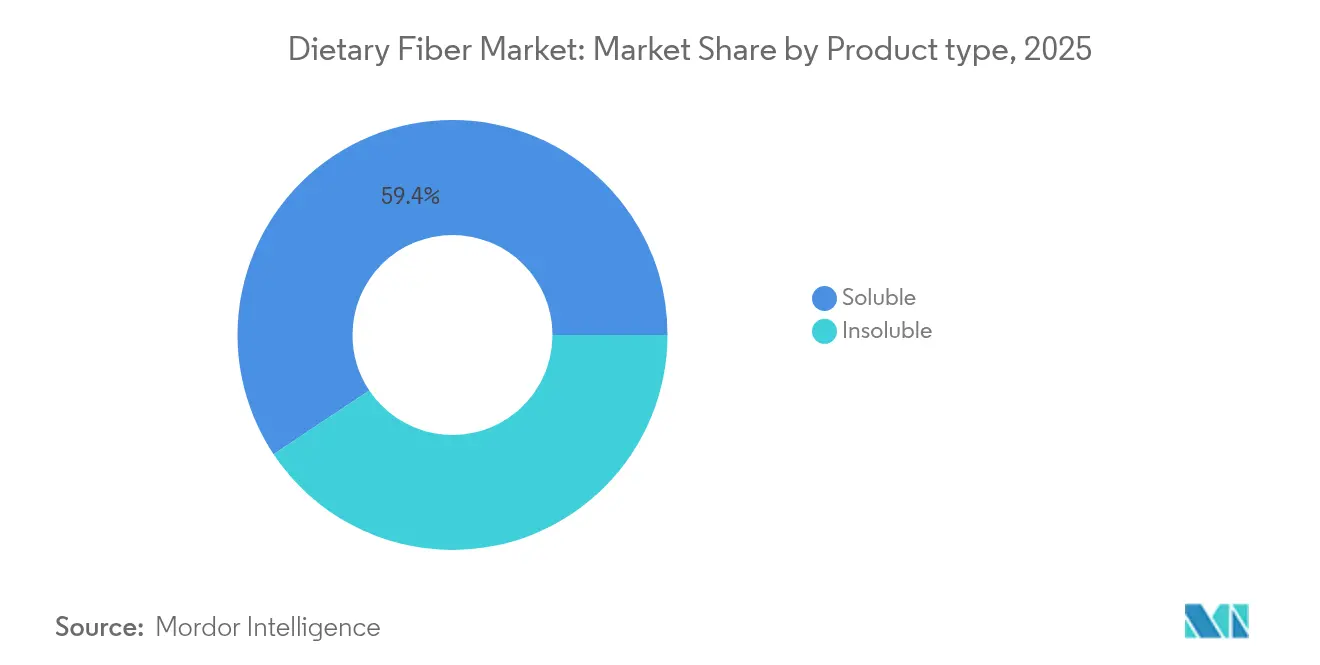
- By product type, soluble fiber led with 59.35% of the dietary fiber market share in 2025, while insoluble fiber is projected to post the highest 13.62% CAGR to 2031.
- By source, cereals and grains held 53.10% of revenue in 2025; fruits and vegetables are expected to expand at a 13.55% CAGR through 2031.
- By form, powder products controlled 73.10% of the dietary fiber market size in 2025, yet liquid formats are forecast to grow at 14.35% CAGR by 2031.
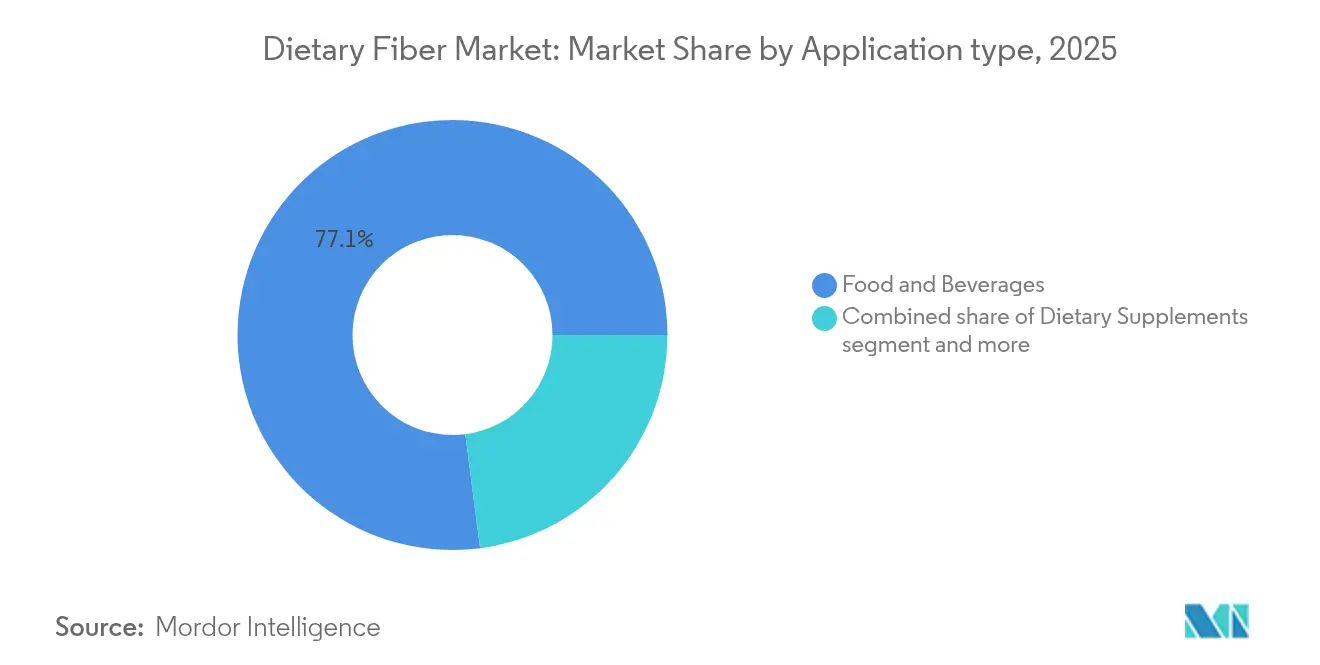
- By application, food and beverages accounted for 77.05% of revenue in 2025, whereas pharmaceuticals are set to rise at a 13.88% CAGR to 2031.
- By geography, North America commanded 33.40% of 2025 revenue; Asia-Pacific is on track for the fastest 14.15% CAGR over 2026-2031.
Note: Market size and forecast figures in this report are generated using Mordor Intelligence’s proprietary estimation framework, updated with the latest available data and insights as of 2026.
Market Trends and Insights
Drivers Impact Analysis of Dietary Fiber Market*
| Driver | (~) % Impact on CAGR Forecast | Geographic Relevance | Impact Timeline |
|---|---|---|---|
| Surge in functional and fortified food demand | +2.8% | Global, with strongest uptake in North America and Europe | Medium term (2-4 years) |
| Rising prevalence of lifestyle diseases | +2.1% | Global, particularly acute in Asia-Pacific urban centers | Long term (≥ 4 years) |
| Increasing demand for gut health and probiotics | +1.9% | North America and Europe leading, Asia-Pacific following | Short term (≤ 2 years) |
| Growth in demand for clean label and plant-based ingredients | +1.7% | Europe and North America primary, expanding to Latin America | Medium term (2-4 years) |
| Rising popularity of fiber-enriched beverage | +1.4% | Global, with innovation hubs in North America | Short term (≤ 2 years) |
| Increased use in functional dairy products | +1.2% | Europe and Asia-Pacific, emerging in Middle East | Medium term (2-4 years) |
| Source: Mordor Intelligence | |||
Surge in Functional and Fortified Food Demand
Consumer awareness of nutrition's role in disease prevention is driving high demand for functional foods, with consumers seeking health-boosting ingredients in ready-to-drink beverages. This trend extends beyond beverages into bakery products, where manufacturers use fiber processing technologies to achieve high inclusion rates while maintaining taste and texture. The functional food market growth is supported by regulatory changes, particularly the Food and Drug Administration's (FDA) expanded definition of dietary fiber, which includes resistant maltodextrin and mixed plant cell wall fibers [1]. This enables manufacturers to make stronger health claims. Moreover, the increasing preference for plant-based and clean-label foods aligns with the demand for natural, minimally processed ingredients, making plant-derived fibers from fruits, vegetables, legumes, and grains attractive to health-conscious consumers. The combination of consumer demand and regulatory flexibility creates opportunities for functional food innovation, driving market expansion and establishing consumption patterns that support market growth.
Rising Prevalence of Lifestyle Diseases
The increasing prevalence of lifestyle diseases, including diabetes, cardiovascular disease (CVD), and obesity, drives the demand for dietary fiber in global markets. These chronic conditions, associated with poor dietary habits, inactive lifestyles, and high consumption of processed foods, present significant public health challenges. Dietary fiber, particularly soluble fiber, helps manage blood sugar levels, reduces LDL cholesterol, and increases satiety, making it an important nutritional component in disease management. Consumer awareness of dietary fiber's health benefits has led to increased demand for fiber-enriched foods and supplements. Government and health organizations provide data supporting this trend. The Centers for Medicare and Medicaid Services (CMS) reported that the United States' national health expenditure reached 17.6% of GDP in 2023, an increase from the previous year, reflecting the growing costs of chronic disease management, particularly for preventable conditions like obesity and Type 2 diabetes [2]. In India, the Indian Council of Medical Research (ICMR) recommends that adults consume 25-40 grams of dietary fiber daily, based on a 2000 kcal/day diet, to prevent metabolic disorders. National dietary guidelines and nutrition campaigns reinforce fiber's importance in maintaining health.
Increasing Demand for Gut Health and Probiotics
The advancement in the gut-brain axis revolution has fundamentally transformed dietary fiber's functionality from basic digestive support to comprehensive wellness applications. Consumer preferences have shifted toward synbiotic formulations that integrate prebiotics and probiotics to optimize health outcomes. This market evolution has catalyzed research and development in prebiotic fiber applications, specifically in acacia gum and baobab fibers, which demonstrate enhanced gut microbiome modulation capabilities compared to traditional fiber variants. Manufacturing entities are developing specialized formulations with precise health targets, exemplified by Brightseed's Bio Gut Fiber, which utilizes bioactive compounds derived from upcycled hemp fiber to enhance intestinal barrier function. The intersection of microbiome science and functional food development has established distinct market categories where dietary fiber serves as the primary foundation for comprehensive wellness solutions, superseding its traditional role as a standalone nutritional supplement.
Growth in Demand for Clean Label and Plant-Based Ingredients
The increasing consumer focus on ingredient transparency is driving manufacturers to adopt plant-based fiber sources that support clean label positioning. This trend creates opportunities for fruit and vegetable-derived fibers, despite their higher processing costs. Cargill's investment in European corn and wheat-derived soluble fibers demonstrates this shift, providing manufacturers with label-friendly options that enable sugar reduction and fiber enrichment claims. The clean label movement has gained significant traction in Europe, where regulations favor natural ingredient declarations, and consumers are willing to pay more for recognizable ingredientS. For instance, in December 2024, One Bio secured USD 27 million in Series A funding to develop technology that converts agricultural waste polysaccharides into tasteless, odorless fibers. This advancement represents a new direction in clean label innovation by addressing both sustainability needs and functional requirements. The upcycling approach is establishing new value chains, transforming agricultural waste streams into functional ingredients while meeting consumer expectations for environmental responsibility. This combination of sustainability and functionality provides competitive advantages to manufacturers who effectively communicate both nutritional and environmental benefits.
Restraints Impact Analysis of Dietary Fiber Market*
| Restraint | (~) % Impact on CAGR Forecast | Geographic Relevance | Impact Timeline |
|---|---|---|---|
| Unpleasant taste and texture in high-fiber products | -1.8% | Global, particularly challenging in Asia-Pacific markets | Short term (≤ 2 years) |
| Higher costs of fiber-fortified ingredients | -1.4% | Price-sensitive markets in Latin America and Asia-Pacific | Medium term (2-4 years) |
| Limited solubility and functionality in certain applications | -0.9% | Technical applications in pharmaceuticals and specialized foods | Long term (≥ 4 years) |
| Complex regulatory requirements for labeling and health claims | -0.7% | Europe and North America with strict health claim regulations | Medium term (2-4 years) |
| Source: Mordor Intelligence | |||
Unpleasant Taste and Texture in High-Fiber Products
Sensory limitations represent the predominant constraint impeding widespread fiber incorporation, as conventional high-fiber formulations inherently compromise organoleptic properties and subsequent consumer acceptance. Contemporary technological advancements are methodically addressing these constraints through sophisticated processing methodologies, specifically microfluidization and blasting extrusion, which augment soluble dietary fiber content while simultaneously optimizing functional characteristics. The industry has implemented specialized fiber ingredients, particularly Fibersol, which exhibits exceptional solubility parameters and neutral organoleptic profiles suitable for implementation across diverse applications encompassing beverages to baked goods. The methodical restructuring of dietary fiber classification, predicated on structural properties rather than traditional soluble/insoluble differentiation, enables precise ingredient selection to fulfill specific sensory parameters.
Higher Costs of Fiber-Fortified Ingredients
Raw material price volatility and processing complexity create cost pressures that limit fiber adoption in price-sensitive market segments. Wheat price fluctuations significantly impact bakery product costs, even as commodity markets stabilize. Supply chain disruptions affect specialty fiber sources, particularly psyllium, where production challenges in India maintain elevated pricing despite increasing demand. The cost challenge extends to the specialized processing equipment and quality control systems required for functional fiber production, creating entry barriers for smaller manufacturers. However, production efficiencies are emerging as major manufacturers expand operations. For instance, Tate and Lyle's new facility in Slovakia for non-GMO PROMITOR Soluble Fibres aims to reduce unit costs through increased production volumes. The emergence of upcycling technologies that convert agricultural waste into fiber ingredients offers a potential solution to cost pressures while addressing sustainability requirements. Manufacturers who establish vertical integration or strategic partnerships with agricultural waste producers are likely to benefit from improved cost dynamics in the long term.
*Our forecasts treat driver/restraint impacts as directional, not additive. The impact forecasts reflect baseline growth, mix effects, and variable interactions.
Dietary Fiber Market Segment Analysis
By Product Type:
Soluble Fiber Dominance Faces Insoluble InnovationThe soluble fiber segment holds 59.35% of the global dietary fiber market in 2025, due to its versatility and ease of incorporation into functional foods and dietary supplements. Its water solubility enables seamless integration into beverages, yogurts, nutritional bars, and meal replacements without affecting texture or taste. This characteristic makes it the preferred choice for manufacturers enhancing their products' health profiles. The United States Food and Drug Administration (FDA) permits health claims linking specific soluble fibers (beta-glucan and psyllium) to reduced coronary heart disease risk. These regulatory approvals validate soluble fiber's health benefits and drive industry investment in fiber-fortified product development.
Insoluble fiber, while holding a smaller market share, is growing at a CAGR of 13.62% through 2031. This growth stems from technological advancements in food processing and formulation that address traditional limitations like grittiness and limited solubility. Improved fiber milling and encapsulation techniques enhance texture, stability, and dispersibility in processed foods, enabling broader applications in snacks, cereals, and bakery products. The segment benefits from cost advantages in the Asia-Pacific and Latin America markets. Government initiatives, including Europe's Farm to Fork strategy and India's FSSAI dietary guidelines, promote whole grain consumption, supporting insoluble fiber demand. These factors, combined with increasing consumer focus on digestive wellness and manufacturers' adoption of advanced formulation technologies, position insoluble fiber for increased market share.

By Source:
Cereals Reign While Fruits Drive InnovationIn 2025, cereals and grains constitute the predominant segment in the global dietary fibers market, commanding a 53.10% market share. This market position is attributed to well-established supply chain infrastructure, substantial raw material availability, and operational cost efficiency. Primary sources, including wheat, oats, corn, and rice bran, demonstrate significant functional adaptability and systematic integration into fundamental food products, specifically bread, cereals, and snack bars. The inherent structural composition of these materials facilitates the extraction of both soluble and insoluble fibers, enabling efficient large-scale manufacturing operations. However, despite their economic advantages and widespread accessibility, cereals and grains are predominantly categorized as conventional ingredients, demonstrating limited market penetration in premium health-oriented segments.
The fruit and vegetable segment exhibits the highest growth trajectory in fiber sources, demonstrating a projected CAGR of 13.55% through 2031. This expansion corresponds directly to increased market demand for clean-label formulations, minimally processed components, and naturally derived ingredients. Fiber derivatives from apples, carrots, citrus peels, and beets maintain substantial consumer preference due to their perceived superior nutritional composition and established health benefits. These components present enhanced ingredient transparency on product formulations, aligning with contemporary consumer requirements for product clarity and health optimization.
By Form:
Powder Stability Meets Liquid InnovationPowder formulations constitute 73.10% of the market share in 2025, attributed to their superior manufacturing efficiency and enhanced storage stability characteristics. The liquid formulation segment demonstrates substantial growth at a 14.35% CAGR, primarily attributed to increased utilization in ready-to-consume applications and beverage fortification. Liquid fiber formulations facilitate higher incorporation rates without encountering sedimentation challenges, rendering them particularly advantageous for functional beverages where manufacturers require optimal integration of nutritional components while maintaining product integrity.
The market exhibits significant potential in advanced delivery systems that integrate powder stability with liquid functionality. This advancement is demonstrated through innovations in fiber-enriched beverage powder formulations that achieve complete dissolution without compromising textural properties. Progressive developments in spray drying and encapsulation methodologies facilitate the creation of novel product forms that transcend conventional categories. The beverage industry's systematic incorporation of fiber fortification indicates the expanding application of liquid formulations in broadening dietary fiber consumption beyond traditional supplement categories.
By Application:
Food Dominance Challenged by Pharmaceutical GrowthIn 2025, food and beverage applications account for 77.05% of the global dietary fiber market consumption. This segment's prominence stems from dietary fiber's essential role in nutrition enhancement, digestive health, and functional food development. Food manufacturers incorporate fiber fortification across various products, including cereals, bakery items, ready-to-drink beverages, and dairy alternatives, responding to consumer demand for nutritious options. The growing understanding of fiber's role in weight management, glycemic control, and cardiovascular health further drives this trend. As health consciousness increases globally, manufacturers use dietary fibers to enhance traditional food products with functional and wellness benefits.
The pharmaceutical segment is expected to grow at a CAGR of 13.88% through 2031, emerging as a significant growth driver. The industry utilizes dietary fibers as functional excipients in tablets, controlled-release drug delivery systems, and gut-targeted therapies. Soluble fibers, including inulin and guar gum, along with modified cellulose derivatives, provide essential physicochemical properties such as swelling behavior, viscosity modulation, and water retention capacity, which enhance drug solubility and bioavailability.
The dietary supplements segment maintains consistent growth by combining nutritional benefits with health-focused product positioning. This category benefits from more flexible health claim regulations compared to traditional food products, allowing companies to market specific benefits such as digestive regularity and cholesterol reduction. These advantages increase consumer confidence and market reach. The expansion of fiber applications beyond traditional food products, particularly in pharmaceuticals and supplements, indicates the market's evolving dynamics.
Geography Analysis
North America Dietary Fiber Market
North America holds a 33.40% share of the global dietary fiber market in 2025, supported by its robust functional food infrastructure and high consumer health awareness that drives premium product adoption. The region's clear regulatory framework for health claims and efficient supply chain enables cost-effective fiber ingredient sourcing and processing. The market's maturity in traditional applications has pushed manufacturers toward specialized segments, including pharmaceutical excipients and functional beverages, where North American companies maintain technical advantages through research investments and patents.
APAC Dietary Fiber Market
Asia-Pacific exhibits the highest growth rate at 14.15% CAGR through 2031, propelled by urbanization, western dietary influences, and government health programs focused on preventive nutrition. China's urban population increasingly demands fiber-enriched convenience foods. The rising consumption of fresh vegetables in China, which increased to 109.9 kilograms per person in 2023 from 104.8 kilograms in 2022, contributes significantly to dietary fiber intake, as vegetables are the primary source of both soluble and insoluble fiber . India's growing focus on dietary fiber extends beyond diabetes management, with healthcare providers recommending increased fiber intake for cardiovascular health, weight management, and digestive wellness.
EMEA and South America Dietary Fiber Market
Europe shows consistent growth driven by clean-label preferences and sustainability initiatives that support plant-based fiber sources. South America, and Middle East and Africa present growth opportunities as economic development and health awareness increase. The regional landscape reflects different market maturity levels, with developed markets pursuing premium applications while emerging markets establish basic consumption patterns for long-term volume growth.
Regulatory Landscape
Dietary fiber regulation focuses on what can be declared as fiber on labels and what health claims can be made, which in turn shapes ingredient selection and formulation globally. In the United States, the FDA definition requires isolated or synthetic non-digestible carbohydrates to demonstrate beneficial physiological effects to be counted as dietary fiber on Nutrition and Supplement Facts, and manufacturers typically align formulations with FDA-recognized fibers (for example, beta-glucan, psyllium, cellulose, pectin, and inulin) while monitoring FDA enforcement discretion for certain ingredients.
In the European Union, dietary fiber innovation intersects with the Novel Food framework and additive specifications, which raises the approval bar for certain new fiber ingredients and fiber-adjacent compounds. In 2026, the European Commission updated the Union list through implementing regulations authorizing specific ingredients such as inulin-propionate ester and rhamnogalacturonan-I enriched carrot extract as novel foods. Commission Regulation (EU) 2026/196 also amended specifications for widely used hydrocolloids and gums (including locust bean gum, guar gum, gum arabic, xanthan gum, and pectins), with applicability starting 18 August 2026, affecting compliance, documentation, and supplier specifications for fiber-containing formulations.
Value Chain Analysis
The dietary fiber value chain starts with agricultural inputs (cereals and grains, roots, fruits and vegetables, legumes, and increasingly by-product streams such as pomace and seeds), followed by primary processing (milling, fractionation) and fiber extraction and refining using physical, enzymatic, or chemical steps. Midstream players produce standardized fiber ingredients, including soluble fibers, resistant dextrins, inulin/FOS/GOS, and citrus and other plant fibers, and provide application support such as blending, dispersion aids, and texture systems to meet performance targets in food and beverages, dietary supplements, and pharmaceuticals.
Downstream, fibers flow through ingredient distributors and direct-to-manufacturer supply into high-volume food and beverage categories and more specialized nutraceutical and pharma channels, where labeling and claim substantiation requirements influence go-to-market. Recent moves reflect tightening integration across the chain: Ingredion acquired NutriLeads Benicaros (upcycled carrot pomace prebiotic fiber) in June 2026 to bring ingredient IP and clinical data into its portfolio, Nexira acquired Moroccan carob specialist Keragum in July 2026 to secure locust bean gum supply, and ClonBio Foods announced a commercial-scale FibAX (corn arabinoxylan) facility at Dunafoldvar, Hungary. Third-party verification is also emerging as a value-chain service layer, with Tate and Lyle receiving NutraStrong Prebiotic Verified certification in June 2026 for multiple prebiotic lines, supporting downstream customer acceptance in consumer health and fortified foods.
Competitive Landscape
The dietary fiber market demonstrates fragmented competition with a concentration score of 3 out of 10, indicating significant opportunities for market consolidation and specialized product development. The competitive landscape comprises established multinational corporations and emerging enterprises, each pursuing distinct market positioning strategies. Major industry participants, including Archer-Daniels-Midland Company, Cargill, Incorporated, and Ingredion, maintain substantial market presence through their extensive raw material procurement networks and advanced processing capabilities.
Technological advancement serves as a primary differentiator in the market, as exemplified by Archer-Daniels-Midland Company's achievement with Fibersol, which received the "Best Functional Ingredient of the Decade" recognition at the 2024 Gulfood Manufacturing. The company's strategic emphasis on health-conscious beverage formulations further demonstrates the industry's focus on innovation-driven growth. Smaller market participants have established competitive positions through specialized product applications and the development of alternative fiber sources.
The market's competitive dynamics continue to evolve through technological innovation and strategic investments. One Bio's successful procurement of USD 27 million in Series A funding in December 2024 for agricultural waste conversion technology exemplifies the market's transformation potential. These technological advancements establish substantial barriers to entry and shape the strategic expansion initiatives of market participants.
Dietary Fiber Industry Leaders
-
Archer-Daniels-Midland Company
-
Cargill, Incorporated
-
Ingredion Incorporated
-
Tate & Lyle PLC
-
BENEO GmbH
- *Disclaimer: Major Players sorted in no particular order
Dietary Fiber Market Companies Covered in this Report
- Archer-Daniels-Midland Company
- Cargill, Incorporated
- Ingredion Incorporated
- Tate & Lyle PLC
- BENEO GmbH
- Südzucker Group
- Roquette Frères
- Kerry Group
- J. Rettenmaier & Söhne GmbH & Co. KG
- SunOpta, Inc.
- Taiyo Kagaku India Pvt. Ltd
- Nexira
- Fiberstar, Inc.
- Emsland Group
- AGT Food and Ingredients
- Shandong Minqiang Biotechnology Pvt Ltd
- Grain Processing Corporation
- Tereos Syral
- Farbest-Tallman Foods Corporation.
- Cosucra Groupe Warcoing SA
Market Opportunities and Future Outlook
Opportunities are strengthening where regulatory authorization, clinical substantiation, and differentiated sourcing align, especially for prebiotic and upcycled fibers positioned for gut-health and cleaner labels. Ingredient portfolios are shifting toward fibers with stronger evidence packages and clearer market access routes, supported by Ingredion's June 2026 acquisition of NutriLeads Benicaros (including associated intellectual property and clinical data) and by EU authorizations in June 2026 for novel food ingredients such as inulin-propionate ester and rhamnogalacturonan-I enriched carrot extract, which expand the toolkit for differentiated fiber formulations in Europe.
Manufacturing capacity additions and supply security initiatives also create room for regionalized supply and new application formats, particularly for soluble, neutral-taste fibers used in beverages and for sugar-reduction systems. Examples include Galam Group commissioning an additional GOFOS (FOS) production plant in January 2026 and ClonBio Foods announcing a commercial-scale FibAX production facility at Dunafoldvar, Hungary (operations targeted for Q2 2027), which supports industrial-scale availability of newer fiber types. In Asia, producer investments highlight ongoing competitive intensity in resistant dextrin and soluble fiber capacity, including Shandong Bailong Chuangyuan Bio-Tech commissioning a 30,000-ton soluble dietary fiber production line in 2024 and later restructuring a Thailand project plan in July 2026 to focus on allulose and resistant dextrin expansion, reinforcing a pipeline for high-volume fibers aligned with modern formulation needs.
Recent Industry Developments in Dietary Fiber Market
- July 2026: Tate & Lyle received NutraStrong Prebiotic Verified certification for four prebiotic fiber product ranges, including PROMITOR Soluble Fibre, STA-LITE Polydextrose, EUOLIGO FOS, and GOSYAN GOS. The certification adds third-party validation to support claims-focused selling into functional food, beverage, and consumer health channels and provides additional differentiation in prebiotic fibers.
- June 2026: Ingredion acquired NutriLeads' Benicaros prebiotic fiber brand, adding associated intellectual property and clinical data to its portfolio. The deal supports Ingredion's move into upcycled, science-backed fibers and expands its offering for manufacturers targeting gut-health and clean-label positioning.
- July 2024: Ingredion launched FIBERTEX CF 500 and FIBERTEX CF 100 citrus fibers across EMEA as multi-benefit, clean-label texturizing solutions. The launch broadened options for formulators using citrus fiber functionality to deliver texture and fiber enrichment in processed foods without compromising label simplicity.
Dietary Fiber Market Report Scope and Research Methodology
Market Definition and Coverage
For this study, the dietary fibers market is defined as the value of fiber ingredients sold into end uses like food and beverage formulations, supplements, and related health products, across all major regions, and measured in USD at the ingredient level.
Scope exclusions: We exclude whole foods sold as finished retail items and any non-fiber additives that are not used or labeled as dietary fiber ingredients.
Segments Covered in This Report
- By Product Type
- Soluble
- Insoluble
- By Source
- Fruits and Vegetables
- Cereals and Grains
- Legumes
- Others
- By Form
- Powder
- Liquid
- By Application
- Food and Beverages
- Dietary Supplements
- Pharmaceuticals
- Others
- Geography
- North America
- United States
- Canada
- Mexico
- Rest of North America
- Europe
- Germany
- United Kingdom
- Italy
- France
- Spain
- Netherlands
- Poland
- Belgium
- Sweden
- Rest of Europe
- Asia-Pacific
- China
- India
- Japan
- Australia
- Indonesia
- South Korea
- Thailand
- Singapore
- Rest of Asia-Pacific
- South America
- Brazil
- Argentina
- Colombia
- Chile
- Peru
- Rest of South America
- Middle East and Africa
- South Africa
- Saudi Arabia
- United Arab Emirates
- Nigeria
- Egypt
- Morocco
- Turkey
- Rest of Middle East and Africa
- North America
Data Sources, Market Sizing, and Validation
Desk Research
Desk work started by aligning what counts as dietary fiber and where it is used, then mapping demand signals that can be tracked consistently by region. Public sources, including USDA FoodData Central, FDA and EFSA labeling guidance, FAOSTAT, UN Comtrade trade statistics, and Codex Alimentarius references, were used to anchor definitions, trade flows, and food formulation context.
We also reviewed company annual reports, investor presentations, and reputable press to understand capacity additions, product positioning, and pricing direction, which then helped set reasonable ranges for assumptions. Where needed, paid subscriptions for company financials and a paid shipment-level import and export database were used to cross-check supplier exposure and trade-linked volumes. The desk sources listed here are illustrative and not exhaustive, since many other public documents were also used for data collection, validation, and clarification.
Primary Interviews and Surveys
To close the gaps left by public data, we spoke with ingredient suppliers, distributors, formulators, and downstream buyers across foods, beverages, and supplements, followed by regional checks across APAC, EMEA, and the Americas. The discussions were used to confirm which products are counted as dietary fiber, what pricing movement looks like across cycles, and how quickly new fiber formats are being adopted, before assumptions were finalized.
Distribution of primary research fieldwork respondents
| Company type | Respondent position | Region |
|---|---|---|
| Top tier: 27% | CXOs: 14% | APAC: 46% |
| Mid tier: 57% | Functional/Unit leaders: 41% | EMEA: 34% |
| Smaller Players: 16% | Managers: 45% | Americas: 20% |
Market-Sizing & Forecasting
Sizing was first built using a top-down approach where food processing output and trade-linked ingredient flows were reconstructed by region, then converted into dietary fiber demand using application-level inclusion rates that were checked during interviews. Only after that, selective bottom-up approximations were used to test the totals, such as sampled supplier revenue exposure to fiber ingredients and an ASP times volume check for major fiber types.
Key inputs that shaped the model included fiber inclusion rates by application (bakery, dairy, beverages, supplements), soluble versus insoluble mix, regional fortification and labeling momentum, import and export movement for fiber ingredients, and typical price bands by source group (fruits and vegetables, cereals and grains, legumes). For forecasting, scenario analysis was applied so the outlook could reflect different speeds of reformulation, health-claim adoption, and price normalization, and the scenario boundaries were checked against expert consensus from primary conversations. When bottom-up checks had missing coverage for smaller local suppliers, the gap was handled through region-level scaling factors linked to trade intensity and the observed share of imports versus local production.
Data Validation & Update Cycle
Outputs were checked in several passes, where model totals were compared against independent signals like trade movement, announced capacity changes, and observed pricing direction, then reviewed again at the application level for outliers. If a number looked off, follow-up calls were triggered to recheck the assumption that caused the variance, and the model was adjusted only after the reason was clearly documented.
Before sign-off, a second analyst reviews the calculations and the logic chain so the steps are repeatable and the scope stays consistent. The report is refreshed once a year, and interim updates are made when material events happen, such as policy changes on labeling or major capacity expansions. Right before delivery, a fresh pass is completed so clients receive the most current view based on the latest available data.
Mordor Intelligence's Global Dietary Fibers Market Size Compared Against Other Published Estimates
Published market sizes for dietary fibers can vary even when the topic sounds the same, because the counting rules and the year anchors are often different. The biggest spread usually comes from what is treated as an ingredient market versus a finished product view, plus differences in pricing logic and how quickly assumptions get refreshed.
The main gap comes from scope mixing, where Mordor Intelligence counts dietary fiber at the ingredient level across food and beverages, supplements, and pharma-linked uses, and keeps whole finished retail foods out of the total, which some figures may not separate cleanly. Another driver is the year and forecast window, since some estimates anchor on 2023 or 2025 and then apply a single growth rate, while our model adjusts for application-level adoption rates and regional labeling momentum before the forecast is extended.
Benchmark comparison
| Source | Market Size | Gaps in Research Methodology |
|---|---|---|
| Mordor Intelligence | USD 10.47 B (2026) | |
| Global Consultancy A | USD 7.90 B (2023) | Uses an earlier anchor year and may apply a broad growth rate without clearly separating ingredient-level fiber sales from adjacent nutrition ingredients, which can compress the starting market size. |
| Industry Publisher B | USD 8.93 B (2025) | Anchors on a different base year and appears to use wider processing and application buckets, which can shift ASP assumptions and lead to a different total versus an ingredient-only count. |
The table shows that timing and scope choices explain most of the differences, more than any single growth assumption. By keeping the inputs tied to visible demand signals like application inclusion, trade movement, and realistic price bands, the estimate stays traceable and can be rechecked as new information becomes available.
Key Questions Answered in the Report
What is the current value of the dietary fiber market?
The dietary fiber market recorded USD 10.47 billion in 2026 and is projected to reach USD 18.98 billion by 2031 at a 12.62% CAGR.
Which product type leads the dietary fiber market?
Soluble fiber dominated with 59.35% share in 2025 thanks to its ease of formulation and FDA-approved cardiovascular claims.
Why is Asia-Pacific the fastest-growing region?
Urbanization, government health initiatives, and rising disposable incomes are driving a 14.15% CAGR in Asia-Pacific, surpassing all other regions.
How are processing technologies improving fiber acceptance?
Microfluidization, twin-screw extrusion, and blasting extrusion raise soluble content and neutralize off-flavors, enabling higher inclusion rates in beverages and dairy.