Palestine Telecom MNO Market Size and Share
Market Overview
| Study Period | 2019 - 2030 |
|---|---|
| Forecast Data Period | 2025 - 2030 |
| Historical Data Period | 2019 - 2023 |
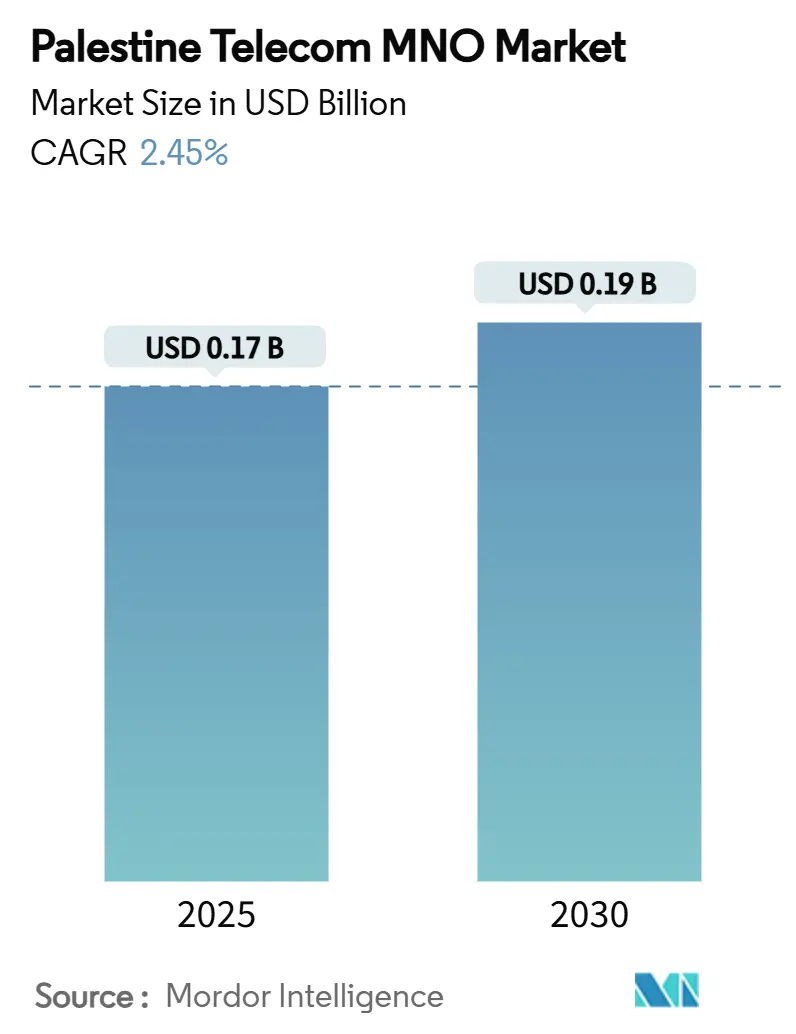
| Market Size (2025) | USD 0.17 Billion |
| Market Size (2030) | USD 0.19 Billion |
| Growth Rate (2025 - 2030) | 2.45% CAGR |
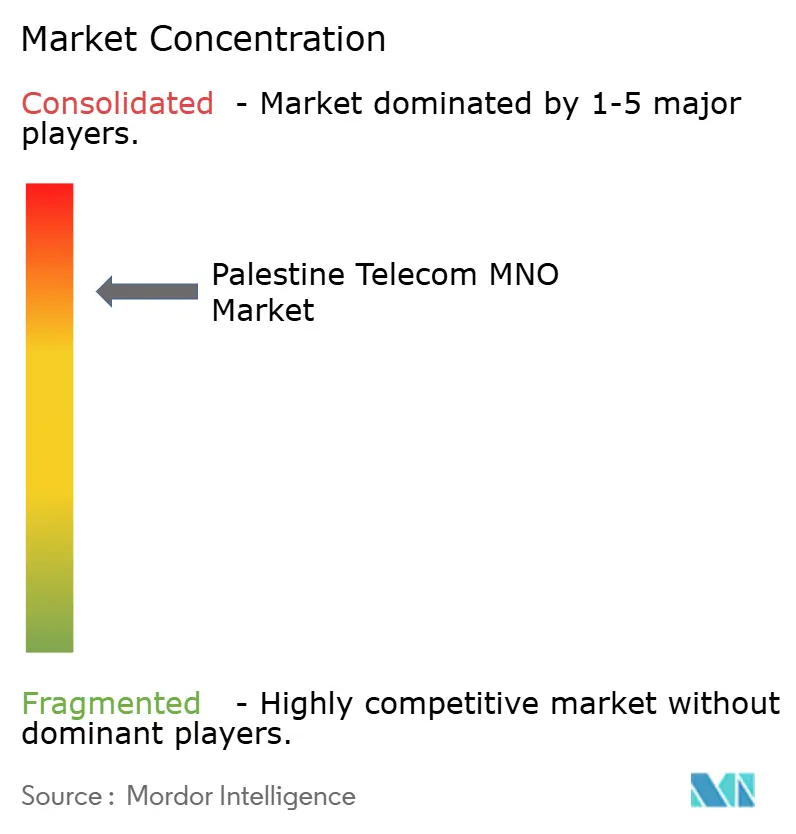
| Market Concentration | High |
Major Players *Disclaimer: Major Players sorted in no particular order Image © Mordor Intelligence. Reuse requires attribution under CC BY 4.0. | |
Palestine Telecom MNO Market Analysis by Mordor Intelligence
The Palestine Telecom MNO Market size is estimated at USD 0.17 billion in 2025, and is expected to reach USD 0.19 billion by 2030, at a CAGR of 2.45% during the forecast period (2025-2030).
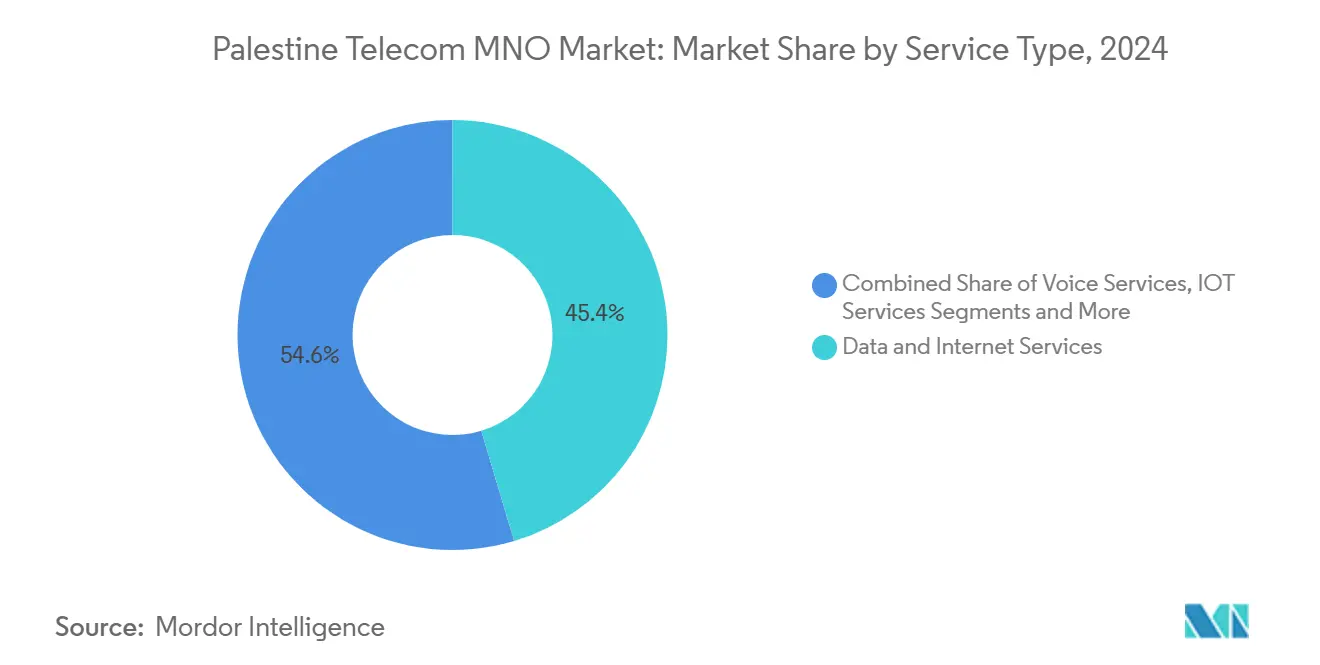
This expansion rests on steady demand for connectivity, rising mobile-data usage, and gradual network upgrades despite heavy infrastructure damage and strict spectrum controls. Data services contributed the largest 45.4% revenue share in 2024, propelled by mobile internet adoption and cloud-ready enterprise networks. Voice services retained 37.1% of revenue and posted the fastest growth, indicating that Voice over LTE (VoLTE) and improved call-quality bundles still resonate with Palestinian subscribers. Operators have prioritized network resilience, allocating capital to restore damaged towers and to densify 4G coverage in the West Bank while lobbying regulators for additional spectrum in Gaza. The looming arrival of the Medusa submarine cable promises cheaper international bandwidth, amplifying competitive pressure on wholesale backhaul prices once the link becomes operational. Meanwhile, revenue leakage from unauthorized Israeli SIM use—currently USD68–100 million a year—remains a structural headwind that dampens operator cash flows.
Key Report Takeaways
- By service type, data services held 45.4% of the Palestine telecom market share in 2024, while voice services are projected to grow at the highest 2.63% CAGR through 2030.
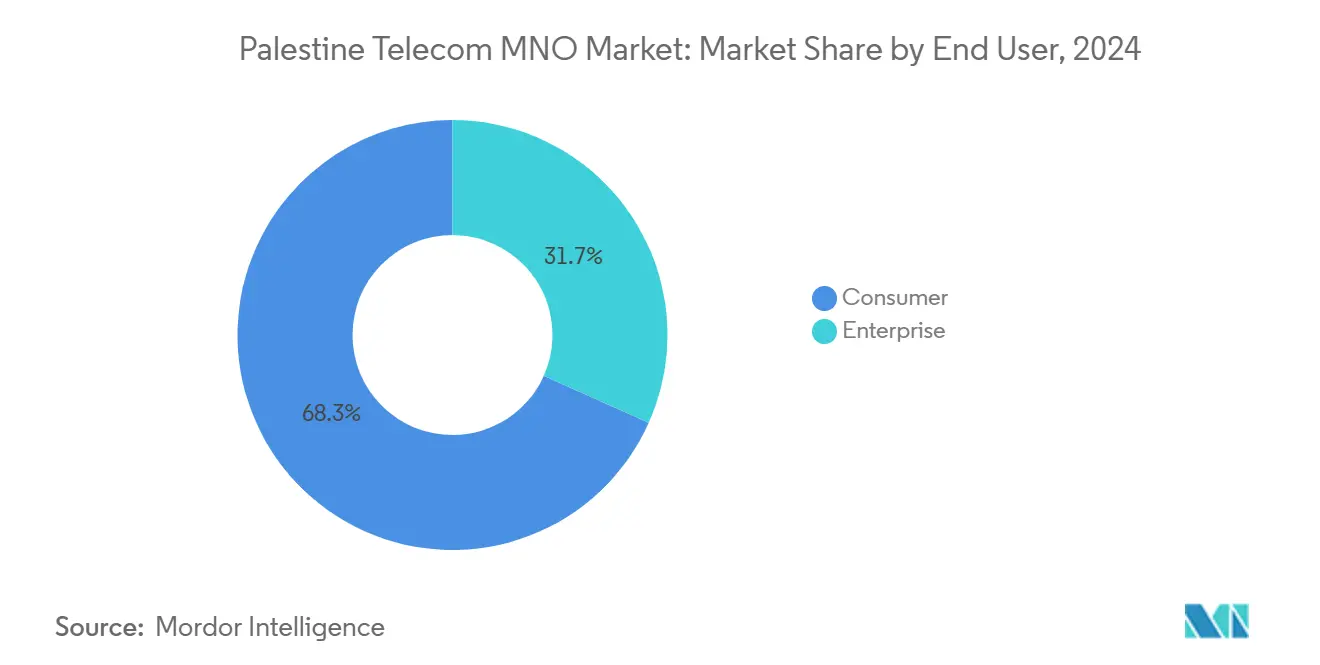
- By end user, the consumer segment commanded 66.5% share of the Palestine telecom market size in 2024; the enterprise segment is forecast to advance at a 2.54% CAGR to 2030.
- Jawwal accounted for more than 80% of mobile subscribers in 2024; Ooredoo Palestine captured the remainder, cementing a highly concentrated duopoly structure
Palestine Telecom MNO Market Trends and Insights
Drivers Impact Analysis*
| Driver | (~) % Impact on CAGR Forecast | Geographic Relevance | Impact Timeline |
|---|---|---|---|
| Rapid 5G Population Coverage Expansion | +0.8% | West Bank primarily, limited Gaza deployment | Medium term (2-4 years) |
| Growth of Fixed-Wireless Access for Rural Broadband | +0.4% | Rural West Bank and Gaza periphery | Long term (≥ 4 years) |
| Enterprise Digital-Transformation (Cloud/SD-WAN) Demand | +0.6% | West Bank urban centers, limited Gaza | Medium term (2-4 years) |
| EU-Funded Fiber Backbone Roll-outs | +0.3% | West Bank infrastructure corridors | Long term (≥ 4 years) |
| Rising Mobile Data Consumption per Capita | +0.5% | National, concentrated in urban areas | Short term (≤ 2 years) |
| Under-penetrated IoT Connections in Logistics & Utilities | +0.2% | West Bank industrial zones | Long term (≥ 4 years) |
| Source: Mordor Intelligence | |||
Rapid 5G Population Coverage Expansion
Telecom operators have mapped 5G deployment plans that align with regional spectrum harmonization and anticipate 50% 5G adoption across the Middle East by 2029. Jawwal and Ooredoo are building dense 4G layers in Ramallah, Nablus, and Hebron as a precursor to 5G, banking on regulator approval of broader frequency bands. Israeli control over spectrum still limits channel width, yet International Telecommunication Union Resolution 125 secures technical assistance and lobbying support for Palestine’s frequency rights. The window for commercial 5G launches therefore hinges on political negotiations as much as on radio-access upgrades. In Gaza, where only 30% of towers remain active, 5G is a long-range prospect that depends first on restoring damaged infrastructure.
Enterprise Digital-Transformation (Cloud/SD-WAN) Demand
Palestinian businesses accelerated cloud migration and software-defined networking to facilitate remote work and secure branch connectivity during periodic closures. McKinsey expects the Middle East cloud market to hit USD183 billion by 2030, with telcos capturing 6% of that spend through managed connectivity bundles. Paltel leverages its fiber ring to bundle SD-WAN, firewall, and voice services for logistics firms linking West Bank checkpoints to distribution hubs. The Palestinian Authority’s digital-economy road map positions ICT as a priority sector, giving operators a policy tailwind for enterprise diversification. Constraints persist, notably scarce international capacity and complicated cross-border data rules that raise latency and compliance costs for public-cloud workloads.
Rising Mobile Data Consumption per Capita
Average mobile-data use has been climbing at 17% annually, matching broader MENA consumption curves that revolve around video streaming, social media, and mobile gaming. Consumers substitute voice and SMS with data-centric apps, driving operators to re-farm 2G spectrum and add carrier aggregation in dense zones. Jawwal recently paused new SIM sales after peak-hour congestion breached quality-of-service thresholds, underlining how spectrum caps now shape retail growth. Higher traffic loads bring incremental revenue but also compress margins because added capacity often requires leased Israeli backhaul at premium rates. For policy makers, moderating wholesale costs and accelerating backhaul self-sufficiency remain strategic imperatives.
EU-Funded Fiber Backbone Roll-outs
The European Union funds a multi-year fiber backbone that connects Jenin and Hebron through secure corridors parallel to Route 60, aiming to triple core-network capacity and boost redundancies. The initiative feeds into the ARC economic corridor blueprint, which sees telecoms as a pillar for export-oriented industrial zones. Construction crews face permit delays and security checkpoints; nonetheless, phased trenching has begun outside Ramallah where municipal approvals are less politicized. Gaza’s single domestic fiber link was severed in June 2025, prompting renewed calls for protected ducting and submarine redundancy via the Medusa system. When complete, EU-backed fiber should cut wholesale bandwidth prices, letting operators migrate rural fixed-wireless sites onto higher-throughput microwave backhaul.
Restraints Impact Analysis*
| Restraint | (~) % Impact on CAGR Forecast | Geographic Relevance | Impact Timeline |
|---|---|---|---|
| Population Decline and Aging Demographics | -0.3% | Gaza primarily, moderate West Bank impact | Long term (≥ 4 years) |
| ARPU Compression from OTT Voice & Messaging | -0.7% | National, concentrated in urban areas | Short term (≤ 2 years) |
| High Wholesale Spectrum Fees vs. GDP per Capita | -0.4% | National, particularly affecting rural coverage | Medium term (2-4 years) |
| Limited Domestic Content Driving Pay-TV Cord Cutting | -0.2% | Urban areas with higher internet penetration | Short term (≤ 2 years) |
| Source: Mordor Intelligence | |||
Population Decline and Aging Demographics
Conflict-driven displacement caused Gaza’s resident count to fall 6% in 2024, shrinking the addressable subscriber base and tipping the user mix toward lower-spending segments. Younger professionals, typically heavy data users, are more likely to emigrate, eroding premium service uptake. Operators must therefore sustain legacy 2G voice for older cohorts, even as income from these services declines. The longevity of network-modernization investments becomes harder to justify when population forecasts are volatile. Ballooning humanitarian obligations also shift consumer expenditure away from discretionary telecom add-ons, further dampening ARPU.
ARPU Compression from OTT Voice and Messaging
WhatsApp, Telegram, and Viber have cannibalized SMS and international voice, stripping Palestinian operators of high-margin revenue pillars. Voice minute bundles now act largely as retention tools, with little upside pricing power. Scientific models show SMS traffic will continue to tumble in bandwidth-rich environments where IP messaging is effectively free[1]arXiv preprint, “OTT Substitution and Revenue Implications for MNOs,” arxiv.org . Spectrum scarcity denies operators the latency and throughput advantages needed to differentiate their own VoLTE services from OTT alternatives. Cross-border roaming on Israeli networks, which enjoy wider channels and 5G, compounds the substitution threat and accelerates domestic ARPU erosion.
*Our forecasts treat driver/restraint impacts as directional, not additive. The impact forecasts reflect baseline growth, mix effects, and variable interactions.
Segment Analysis
By Service Type: Data Services Lead Market Evolution
Data services captured 45.4% of 2024 revenue, reflecting the Palestinian consumer pivot to mobile internet for commerce, education, and entertainment. The segment is forecast to clock a 2.48% CAGR through 2030, faster than the overall Palestine telecom market. Voice remains essential for emergency communication and diaspora ties, retaining 37.1% share yet evolving toward VoLTE bundles that raise spectral efficiency. IoT and machine-to-machine (M2M) services hold a modest 7.1% share but could accelerate once frequency barriers ease for narrowband applications in logistics hubs. OTT and PayTV claim 8.4%, while fading traditional messaging and small value-added services round out the balance at 1.9%.
The drive to monetise data pivots on spectrum autonomy. Limited 4G channels confine throughput to below-regional averages, forcing zero-rating of select apps and sparking congestion in peak hours. Operators therefore blend Wi-Fi offload and small-cell deployments inside malls and universities to sustain user experience. Rising corporate uptake of SD-WAN forces carriers to interconnect branch sites across multiple governorates, boosting demand for secure IP-VPN and cloud on-ramps. Generative-AI network analytics, now trialled by 81% of global telcos, promise near-real-time capacity optimisation once backhaul constraints loosen[2]Ookla, “Global Telco AI Readiness Study 2025,” ookla.com . Consequently, value-creation swings toward intelligent traffic engineering and digital service ecosystems rather than raw connectivity.


By End User: Consumer Dominance with Enterprise Growth Momentum
The consumer segment accounted for 66.5% of 2024 revenue, underlining how prepaid mobile connectivity remains a non-discretionary household outlay despite economic hardship. Spending resilience mirrors the population’s reliance on internet access for e-commerce, telemedicine, and distance learning under movement restrictions. Yet enterprise revenue, now 30.5% of the Palestine telecom market size, is projected to expand at 2.54% CAGR, outstripping consumer growth. International donors and development banks fund public-sector digitisation projects, channelling contract wins to operators that bundle connectivity with managed cloud and cybersecurity tools.
Corporate buyers increasingly demand latency-sensitive links to regional data centres in Amman and Frankfurt, elevating service-level expectations. In response, operators market redundant MPLS paths that traverse Israeli and Jordanian transit routes to mitigate checkpoint disruptions. SME appetite for mobile point-of-sale terminals and digital wallets unlocks incremental SIM additions, balancing the decline in feature-phone lines. Still, Gaza’s SME base was gutted by an 82% GDP plunge in 2024, making enterprise growth in that enclave dependent on reconstruction aid flows. Nationwide, the spread of e-government portals may gradually standardise cloud adoption, positioning carriers as trusted ICT integrators once legislative clarity on data sovereignty emerges.
Geography Analysis
Palestine’s telecom footprint splits between the West Bank, where most network upgrades concentrate, and Gaza, where persistent hostilities devastate fixed and mobile assets. West Bank revenue represented 74% of the Palestine telecom market in 2024, buoyed by relatively stable cities such as Ramallah and Bethlehem. The enclave enjoyed broader 3G and 4G coverage, enabling operators to push digital-service bundles that lifted data ARPU. Gaza contributed 26% but recorded the steepest subscriber attrition due to tower destruction and prolonged outages. Restoration teams managed to reactivate only 30% of sites by mid-2025, limiting average downlink speeds to below 1 Mbps during peak periods.[3]Middle East Eye, “Medusa Cable and Palestinian Connectivity,” middleeasteye.net
Urban clusters like Nablus and Hebron exhibit the highest penetration, supported by dense fiber-like microwave backhaul and active small cells that deliver video-grade connectivity. Rural governorates in the Jordan Valley remain under-served because spectrum and rights-of-way approvals pass through Israeli Civil Administration, prolonging permit cycles to 24 months on average. Fixed-wireless access (FWA) has therefore emerged as a stopgap, riding 2.6 GHz channels to deliver 50 Mbps packages to villages where copper loops are absent. Donor-funded community internet centers in Area C bolster social inclusion goals while seeding future demand for personal subscriptions.
International connectivity hinges on three Jordanian and Israeli points of presence that route traffic to global IXPs, exposing the network to geopolitical risk and high transit costs. The Medusa cable will land in Haifa, with a planned terrestrial extension into the West Bank that could halve wholesale IP transit prices. Such cost relief is likely to feed through to retail data tariffs, raising affordability metrics by 2027 if construction proceeds. Until then, operators rely on careful traffic-shaping and content-delivery caching to conserve scarce backhaul, a strategy that tempers peak-hour congestion but raises latency on dynamic content.
Competitive Landscape
Palestine’s telecom arena remains a duopoly, with Jawwal controlling over 80% of subscribers thanks to first-mover advantage and broad distribution. The operator booked USD340 million in 2024 revenue and USD59 million net income, channelling cash into emergency tower rebuilds and digital-services R&D. Ooredoo Palestine serves the remaining share, differentiating on flexible bundles and higher upstream rates where spectrum allows. Both face annual revenue leakage that totals USD68–100 million as Israeli SIMs bypass local tariffs in border towns, undermining margin improvement. Their competitive priorities center on network uptime, with field engineers carrying satellite backhaul kits to bypass fiber cuts during crises.
Innovation pacing is slow because spectrum ceilings nullify prospects for aggressive 5G differentiation. Instead, operators knit partnerships with fintechs to cross-sell mobile wallets and with ed-tech startups to preload zero-rated learning portals. Enterprise customers draw most incremental sales, prompting each carrier to staff specialist divisions that co-design SD-WAN overlays and managed security stacks. Over time, wholesale connectivity from Medusa may invite virtual network operator (VNO) entrants that ride leased capacity, injecting price competition and spurring service customization.
The regulatory architecture remains fragmented: the Palestinian Ministry of Telecom sets guidelines, yet Israel retains final authority over frequency allocation and equipment imports. As a result, parallel regulations between Palestinian and Israeli jurisdictions elevate compliance costs and complicate joint-build scenarios for cross-border links. International financing institutions often earmark funds for shared infrastructure that benefits both markets, although political realities delay execution. For now, Jawwal and Ooredoo continue to focus on resiliency measures, including solar-powered base stations and cloud-native OSS stacks that lower field-maintenance trips.
Palestine Telecom MNO Industry Leaders
Palestine Telecommunications Co. (Paltel / Jawwal)
Ooredoo Palestine
- *Disclaimer: Major Players sorted in no particular order

Recent Industry Developments
- June 2025: Gaza’s last domestic fiber cable was severed, causing a total blackout and underscoring the urgency of redundant routes.
- May 2025: The Palestinian Central Bureau of Statistics disclosed that 39% of residents lacked internet access, with 64% of Gaza towers still offline
- March 2024: Ooredoo Palestine surpassed 1.439 million subscribers, booking USD107 million revenue


Palestine Telecom MNO Market Report Scope
| Voice Services |
| Data and Internet Services |
| Messaging Services |
| IoT and M2M Services |
| OTT and PayTV Services |
| Other Services (VAS, Roaming and International Services, Enterprise & Wholesale Services, etc.) |
| Enterprises |
| Consumer |
| Service Type | Voice Services |
| Data and Internet Services | |
| Messaging Services | |
| IoT and M2M Services | |
| OTT and PayTV Services | |
| Other Services (VAS, Roaming and International Services, Enterprise & Wholesale Services, etc.) | |
| End-user | Enterprises |
| Consumer |


Key Questions Answered in the Report
How large is the Palestine telecom market today?
The market generated USD167 million revenue in 2024 and is projected to reach USD189 million by 2030 at a 2.45% CAGR.
Which service generates the most revenue?
Data services lead with a 45.4% share, driven by rising mobile-internet usage and enterprise cloud connectivity.
Who is the dominant operator?
Jawwal holds more than 80% of subscribers and booked USD340 million in revenue during 2024.
What growth opportunity is most attractive to carriers?
Enterprise demand for cloud-integrated SD-WAN and managed security is forecast to grow 2.54% CAGR through 2030.
Page last updated on:


