
Market Overview
| Study Period | 2020 - 2031 |
|---|---|
| Forecast Data Period | 2026 - 2031 |
| Base Year Market Size (2025) | USD 3.71 Billion |
| Market Size (2026) | USD 3.75 Billion |
| Market Size (2031) | USD 3.98 Billion |
| Growth Rate (2026 - 2031) | 1.17 % |
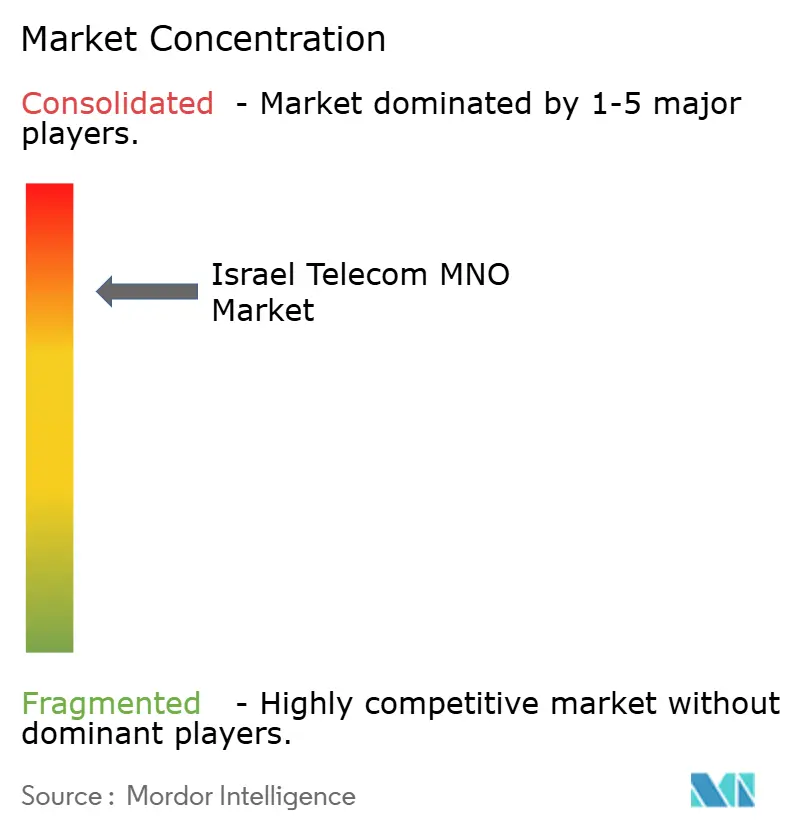
| Market Concentration | High |
Major Players *Disclaimer: Major Players sorted in no particular order Image © Mordor Intelligence. Reuse requires attribution under CC BY 4.0. | |
Israel Telecom MNO Market Analysis by Mordor Intelligence
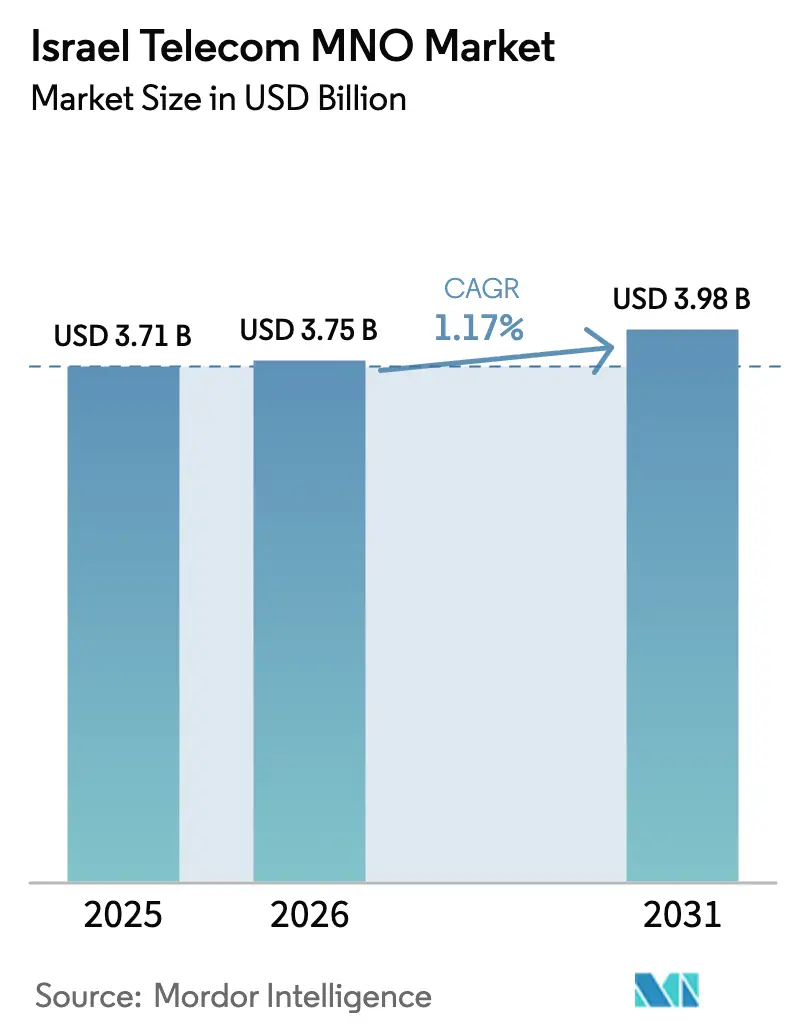
Israel Telecom MNO Market size in 2026 is estimated at USD 3.75 billion, growing from 2025 value of USD 3.71 billion with 2031 projections showing USD 3.98 billion, growing at 1.17% CAGR over 2026-2031.
Sustained fiber roll-outs, mandated legacy-network shutdowns, and a stringent focus on enterprise-grade 5G solutions are reshaping revenue composition as operators reduce reliance on voice and SMS. Consumption of high-bandwidth applications, especially streaming, mobile gaming, and remote work solutions, continues to lift data traffic volumes, encouraging differentiated connectivity tiers and premium monetization models. Regulatory facilitation of new infrastructure entities, together with Israel’s policy to retire 2G and 3G by December 2025, unlocks mid-band spectrum for 5G densification. Geopolitical exigencies and the defense sector’s appetite for resilient, ultra-secure networks keep private 5G opportunities firmly on operator roadmaps. Meanwhile, supply-chain volatility and persistent price competition temper margin expansion prospects.
Key Report Takeaways
- By service type, data and internet services captured 51.68% of the Israel telecom MNO market share in 2025, while IoT and M2M services are projected to grow the fastest at a 1.45% CAGR through 2031.
- By end user, the consumer segment commanded 74.15% of the Israel telecom MNO market size in 2025; the enterprise segment is advancing at a 1.27% CAGR through 2031.
Note: Market size and forecast figures in this report are generated using Mordor Intelligence’s proprietary estimation framework, updated with the latest available data and insights as of 2026.
Israel Telecom MNO Market Trends and Insights
Drivers Impact Analysis*
| Driver | (~) % Impact on CAGR Forecast | Geographic Relevance | Impact Timeline |
|---|---|---|---|
| Rising 5G network coverage and early SA deployments | +0.4% | Tel Aviv, Jerusalem, Haifa corridors | Medium term (2-4 years) |
| Surge in data consumption driven by streaming & gaming | +0.3% | Urban centers nationwide | Short term (≤ 2 years) |
| Fixed fiber roll-outs boosting high-ARPU bundles | +0.2% | National; 90%+ household reach | Medium term (2-4 years) |
| Defense-tech crossover fuelling private 5G demand | +0.2% | Industrial parks and defense clusters | Long term (≥ 4 years) |
| Accelerated aliyah inflow enlarging subscriber base | +0.1% | Major metropolitan areas | Short term (≤ 2 years) |
| Wholesale fiber access regulation enabling MVNO up-sell | +0.1% | National | Medium term (2-4 years) |
| Source: Mordor Intelligence | |||
Rising 5G Network Coverage and Early SA Deployments
Full-scale refarming of legacy spectrum, together with infrastructure-sharing pacts and a regulatory push that lets new entities operate passive networks on incumbents’ frequencies, is compressing rollout costs and shortening coverage timelines. Bezeq and Cellcom each crossed 35% 5G population coverage in early 2025, while Partner Communications activated its first standalone core, enabling network slicing for latency-sensitive defense and industrial IoT workloads. December 2025 will mark the sunset of 2G and 3G services, releasing 900 MHz and 1800 MHz holdings for 4G/5G layering and eliminating opex tied to dual-stack operations. Early adopters already report downlink peaks exceeding 1.2 Gbps in dense urban corridors, supporting immersive AR/VR and cloud-gaming use cases. The enabling ecosystem, ranging from small-cell vendors to cybersecurity start-ups, reinforces Israel telecom MNO market momentum toward differentiated 5G service tiers.
Surge in Data Consumption Driven by Streaming and Gaming
Israeli monthly mobile-data usage has climbed by 17% year-over-year, paralleling fiber throughput growth following WiFi 7 router upgrades offered by Bezeq and Partner. A 2024 Ericsson ConsumerLab survey found that 35% of domestic 5G users would pay a premium for congestion-free streaming during prime time. Generative-AI-enabled smartphones are poised to intensify uplink traffic through on-device model training and real-time content creation. Operators now bundle prioritized network slices with cloud-gaming passes, converting raw data demand into high-margin ARPU add-ons. This dynamic sustains revenue elevation even as headline tariffs stabilize, illustrating how Israel telecom MNO market players offset historical price erosions via quality-of-service differentiation.
Fixed Fiber Roll-outs Boosting High-ARPU Bundles
More than 90% of households can access fiber-to-the-premises, giving Israel one of the world’s densest optical footprints[1]Bezeq Group, “Bezeq Presents the Next Generation Internet: Record Speed of up to 25 Gbps,” bezeq.co.il. Bezeq’s 25 Gbps symmetric pilot, delivered over Nokia’s Lightspan MF-14 platform, underscores ongoing capacity headroom that enables multi-gigabit tiers targeted at prosumers and SMEs. The Ministry of Communications is consulting on easing price caps for wholesale fiber leasing, a move likely to foster more aggressive MVNO packaging and encourage service-level experimentation. Convergence bundles integrating premium broadband, 5G SIMs, and OTT video now account for roughly 28% of consumer revenue, and churn rates for converged subscribers are 40% lower than for pure-mobile accounts. As WiFi 7 mesh systems proliferate, in-home experience gaps narrow, sustaining willingness to pay for ultra-high-speed offers that elevate Israel telecom MNO market lifetime values.
Defense-tech Crossover Fuelling Private 5G Demand
Israel’s dual-use R&D culture blends civilian telco innovation with battlefield requirements, creating a sizable pipeline for campus-scale private 5G installations in aerospace, unmanned systems, and cyber-range facilities.[2] TowerXchange, “Meet Israel’s Only Towerco,” towerxchange.comCommunication Towers, the lone towerco, is aligning neutral-host sites with enterprise network slicing opportunities, lowering capex barriers for industrial players eager to deploy ultra-reliable, low-latency links. Minimal restrictions on IoT SIM activation further streamline device onboarding across manufacturing, logistics, and smart-city domains. Private 5G contracts often bundle edge compute nodes and managed cybersecurity, allowing operators to diversify beyond connectivity. These high-service, low-churn accounts underpin long-term revenue resilience for the Israel telecom MNO market.
Intense Price Wars Keeping ARPU Stagnant
Regulatory liberalization beginning in 2013 introduced disruptive entrants such as HOT Mobile and Golan Telecom, sparking tariff collapses that reduced blended ARPU by nearly 40% within five years.[3]Esteban Ginsburg, “Hot Mobile Leads Recruitment but Churn Rate High,” globes.co.il Although Cellcom and HOT raised package prices in January 2025, moves that triggered a 12.1% jump in Cellcom’s share price, competitive stickiness limits operators’ ability to sustain those hikes. Historic monthly churn near 15% indicates that price-sensitive consumers quickly migrate when promotions surface. Operators are countering with loyalty apps, content bundles, and multi-service discounts, yet margin recovery remains fragile. Unless consolidation accelerates or service differentiation deepens, ARPU uplift will trail data-traffic growth, muting Israel telecom MNO market earnings momentum.
Restraints Impact Analysis*
| Restraint | (~) % Impact on CAGR Forecast | Geographic Relevance | Impact Timeline |
|---|---|---|---|
| Intense price wars keeping ARPU stagnant | -0.3% | National | Short term (≤ 2 years) |
| Supply-chain delays for radio and fiber gear | -0.2% | Nationwide spillover | Medium term (2-4 years) |
| Security-driven restrictions on Chinese vendors | -0.1% | National | Long term (≥ 4 years) |
| Limited rural ROI slowing 5G mid-band densification | -0.1% | Peripheral and rural districts | Long term (≥ 4 years) |
| Source: Mordor Intelligence | |||
Supply-chain Delays for Radio and Fiber Gear
Global semiconductor tightness and extended shipping schedules have lengthened lead times for 32T32R 5G massive-MIMO radios and high-density OLT ports, introducing roll-out lags ranging from three to six months. Vendor diversification, combined with larger safety inventories, partly mitigates the risk but inflates working-capital requirements. Security-related bans on certain Chinese suppliers narrow alternative sourcing, occasionally elevating unit costs by 10–12%. Delays hamper network densification schedules, jeopardizing service-quality targets in congested quarters of Tel Aviv and Jerusalem. Operators have started reprioritizing capex toward software-defined RAN upgrades less hardware-intensive but still dependent on global chipset availability, illustrating the systemic exposure the Israel telecom MNO market faces to international supply shocks.
*Our forecasts treat driver/restraint impacts as directional, not additive. The impact forecasts reflect baseline growth, mix effects, and variable interactions.
Segment Analysis
By Service Type: Data Dominance Anchors Revenue Stability
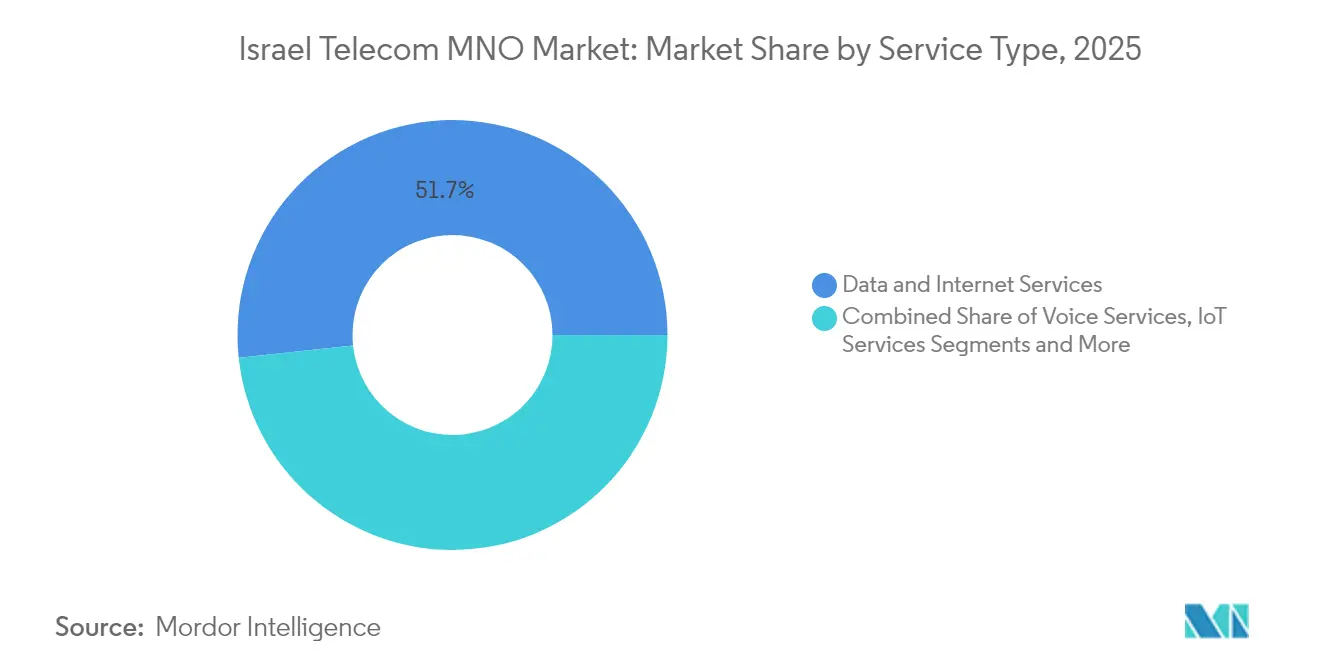
Data and internet services captured 51.68% of the Israel telecom MNO market share in 2025, reflecting the ascendancy of video streaming, cloud collaboration, and mobile gaming across the consumer base. Voice’s 21.62% revenue slice continues to erode as OTT calling applications proliferate, while IoT and M2M services deliver the fastest unit growth at a 1.45% CAGR to 2031. The Israel telecom MNO market size for data and internet services is projected to reach USD 2.15 billion in 2031, translating into incremental revenue of USD 125 million over six years at current exchange rates. Operators exploit the segment’s elasticity by tiering plans around guaranteed downlink speeds and low-latency gaming boosts, a tactic sustaining blended ARPU even under price competition.
Operators leverage their near-ubiquitous fiber backbones to bundle multi-gigabit fixed broadband, pay-TV, and streaming add-ons. Bezeq’s WiFi 7 router launch in 2025 improved in-home throughput by up to 40%, pushing average household data consumption past 1.1 TB per month and lifting premium-bundle penetration to 28%. OTT and PayTV services now stand at 7.96% of revenue, with local platforms such as Cellcom TV enriching content libraries to compete against global entrants. Messaging, VAS, and roaming collectively hold 12.96% share, buoyed by enterprise-grade unified-communications subscriptions that integrate mobile extensions, fixed voice, and collaboration tools in a single bill.



By End User: Enterprise Momentum Accelerates
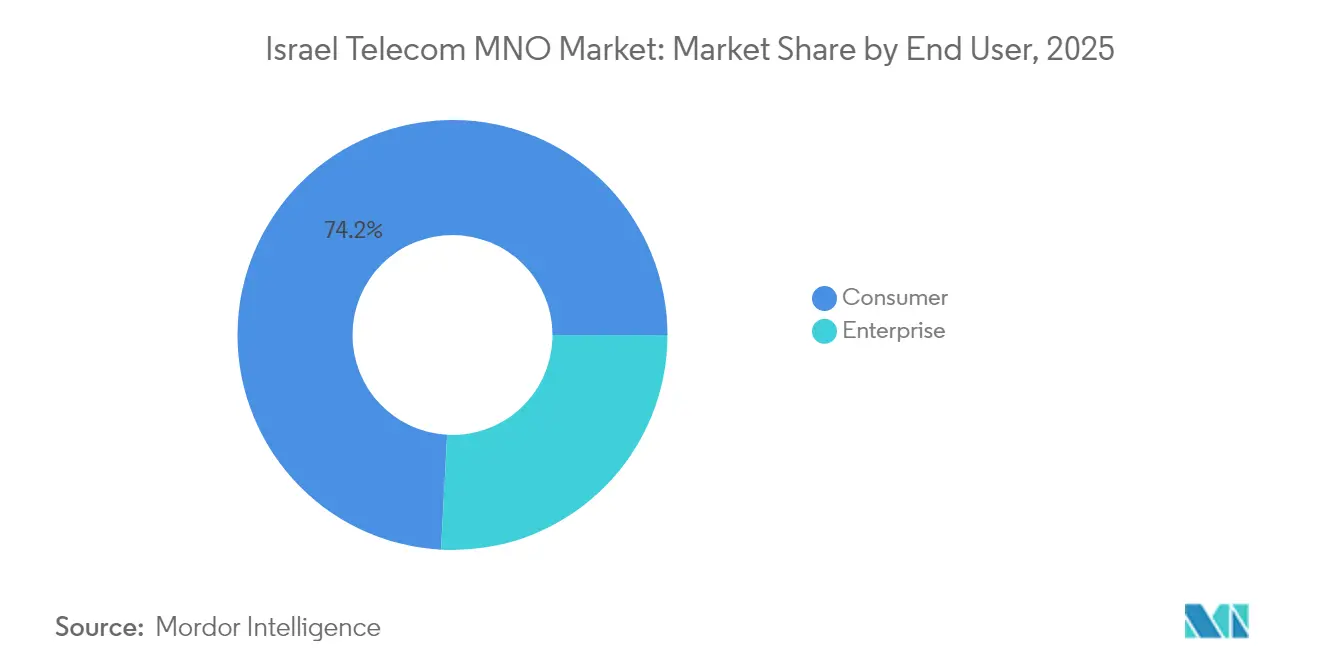
Consumer offerings accounted for 74.15% of Israel telecom MNO market size in 2025, yet enterprise revenue is rising faster at a 1.27% CAGR, moving toward 25.90% share by 2031. Demand originates from high-tech manufacturers, defense establishments, and cloud-native start-ups needing deterministic connectivity, edge analytics, and zero-trust security overlays. Partner Communications’ new global business division targets this cohort with dark-fiber cross-border links and managed SD-WAN, expanding its enterprise pipeline. Private 5G pilots at aerospace campuses already deliver sub-10-millisecond latencies, supporting autonomous vehicle testing and remote robotic surgery R&D, cementing the Israel telecom MNO market’s pivot toward value-added enterprise services.
The consumer arena, meanwhile, faces saturation, with smartphone penetration above 150% and prepaid lines waning. Operators try to extend wallet share through device-upgrade financing, cloud storage bundles, and esports sponsorships. January 2025 tariff hikes indicate renewed pricing discipline, but elasticity risks remain should competitive undercutting re-emerge. Long-term revenue diversification therefore leans on enterprise wins, with analysts expecting enterprise ARPU to surpass consumer ARPU by 2028, aided by cyber-hardened service tiers compliant with defense export regulations.
Geography Analysis
Tel Aviv, Jerusalem, and Haifa metropolitan corridors concentrate two-thirds of revenue, reflecting higher disposable incomes and dense enterprise clusters. Median downlink speeds in central districts exceed 250 Mbps on 5G and 1 Gbps on fiber, enabling early-adopter trials of cloud gaming and immersive conferencing. Peripheral northern zones, including the Galilee and Golan Heights, grapple with rugged topography that necessitates microwave relays and satellite redundancy. Government subsidies tied to the 2025 universal fiber target aim to equalize access, with operators collectively tasked to extend optical reach to 92% of households.
Security-sensitive border regions require hardened shelters, dual power feeds, and encrypted microwave hops. Recent hostilities have validated the strategy: Bezeq’s hardened backbone experienced negligible downtime during 2024 missile barrages. Arab municipalities, where 25% of residents rely primarily on mobile internet, see targeted 4G/5G small-cell infill and community Wi-Fi programs to bridge the digital divide. Southern expanses such as the Negev attract IoT pilots for precision agriculture
Regulatory Landscape
Israel’s telecom MNO market is overseen by the Ministry of Communications (MoC), which is reshaping competitive dynamics through wholesale access rules and technology-transition mandates. In 2026, the MoC advanced a fiber-access and infrastructure pricing reform that requires Bezeq to provide fiber access to other providers, including HOT, tightening the linkage between fixed wholesale terms and mobile-first bundling strategies. Separately, the national retirement of 2G and 3G services by December 2025 is being operationalized through post-shutdown compliance requirements, including MoC rules that prevent connection of devices that do not support VoLTE-based emergency calling.
Broader communications-policy changes are also adding compliance and regulatory uncertainty for sector participants with converged mobile, broadband, and media positions. In July 2026, the Knesset passed the Communications Bill (Broadcasts), which overhauls media regulation and revises the governance framework for a new media regulator, while the MoC eased certain broadcast license-fee payment requirements around the same period. Together, these steps increase the need for operational readiness across mobile network operations, wholesale infrastructure access, and broadcast-adjacent obligations that can shape operator group strategies.
Competitive Landscape
Four mobile network operators Bezeq (Pelephone), Cellcom, Partner Communications, and Hot Mobile dominate national radio infrastructure, while roughly a dozen MVNOs focus on price-sensitive niches. Cellcom’s USD 172 million acquisition of Golan Telecom consolidated spectrum holdings and added 900,000 subscribers, bolstering scale amid opex pressures. Operators increasingly share towers and passive assets: Communication Towers manages neutral-host sites leased to multiple carriers, improving capital efficiency and accelerating rural rollouts.
Technology roadmaps differentiate providers. Bezeq leads fixed broadband with 25 Gbps trials, while Partner emphasizes global connectivity and enterprise SD-WAN. Cellcom and Hot target mid-market consumers through aggressive bundles and device financing. MVNOs such as Rami Levy threaten incumbents on price but remain under 5% market share due to limited network control. Regulatory discussions around wholesale fiber pricing could realign competitive levers, enabling service-based challengers to innovate without heavy infrastructure spend.
Strategic alliances with hyperscalers and defense integrators shape the next growth wave. AT&T’s USD 650 million stake in DriveNets signals confidence in Israeli cloud-native routing and offers local carriers a path toward disaggregated core networks. Operators also team with AWS and Microsoft Azure to host multi-access edge compute nodes inside local exchanges, providing ultra-low-latency zones for fintech and gaming studios. As such, innovation partnership breadth, more than raw subscriber counts, is set to define leadership positions in the Israel telecom MNO market through 2030
Israel Telecom MNO Industry Leaders
Pelephone
Cellcom
Partner Communications
Hot Mobile
- *Disclaimer: Major Players sorted in no particular order

Market Opportunities and Future Outlook
Wholesale fiber access and pricing reform is creating room for multi-play offers and more service-based competition beyond pure price discounting. In 2026, the Ministry of Communications mandated Bezeq fiber access for all companies, including HOT, alongside a fiber and infrastructure pricing reform that the update references as cutting Bezeq wholesale infrastructure costs by 30% in 2026, with a stated two-year pathway to deeper reductions. This setup supports differentiated convergence bundles, enterprise connectivity packaging, and MVNO up-sell models that benefit from improved wholesale economics instead of duplicating last-mile build.
The first phase of the 2G/3G shutdown by February 2026, combined with the mandated sunset timeline by December 2025, is also creating near-term space for 4G/5G layering and densification using refarmed frequencies, while requiring device-base modernization through VoLTE emergency-calling compliance rules. Separately, consolidation offers a route to scale, spectrum, and distribution gains, supported by non-binding MoUs around mobile and telecom asset acquisitions involving Bezeq group entities. Alongside enterprise-grade private 5G and defense-driven secure networking requirements already on operator roadmaps, this supports opportunities in managed connectivity, slicing-enabled SLAs, and cyber-hardened service tiers where revenue is less tied to consumer churn.
Recent Industry Developments
- July 2026: Keystone Infrastructure signed agreement with Delek Israel and Leumi Partners to acquire Hot Mobile from Altice Group for ~NIS 1.88 billion. The consolidation of central cellular infrastructure assets widens scale within the Israeli MNO ecosystem and supports more efficient capacity planning as operators pursue multi-brand strategies.
- July 2026: Pelephone (Bezeq Group) signed a non-binding MoU to acquire Wecom Mobile for ~NIS 265 million. The deal expands Bezeq's network portfolio and improves its ability to bundle fixed and mobile offerings for mid-market demand.
- July 2026: Bezeq Israel Telecom MoU to acquire Exelera Telecom (formerly Tamares Telecom) for ~$160 million, due diligence in 75 days. The acquisition broadens Bezeq's fixed and mobile hybrid footprint and strengthens spectrum and infrastructure scale for Israel’s evolving 5G and fiber landscape.


Research Methodology Framework and Report Scope
Market Definition and Coverage
For this report, the market is measured as the annual revenue generated from telecom MNO services in Israel, covering core connectivity and related service revenue that is billed to consumer and enterprise users.
Scope exclusions: Excluded from this sizing are pure network equipment sales, handset retail revenue, and standalone IT services that are not billed as telecom operator service revenue.
Segmentation Overview
- Overall Telecom Revenue and ARPU
- Service Type
- Voice Services
- Data and Internet Services
- Messaging Services
- IoT and M2M Services
- OTT and PayTV Services
- Other Services (VAS, Roaming & International Services, Enterprise & Wholesale Services, etc.)
- End-user
- Enterprises
- Consumer
Data Sources, Market Sizing, and Validation
Desk Research
Desk research was used to build the starting structure for the model and anchor it to real, repeatable country indicators. We mainly relied on public telecom statistics and policy updates to understand subscriber base trends, coverage rollouts, and price direction, which are needed before revenue can be estimated.
Key public sources included materials such as Israel Ministry of Communications releases and datasets, ITU indicators on subscriptions and broadband adoption, OECD digital and communications indicators, World Bank macro series for normalization, and public spectrum and licensing notices. We also reviewed operator annual reports and investor presentations for plan changes and tariff moves, and then checked select company financial and patent-intelligence subscriptions when a public line item was unclear. This list is not exhaustive, and other sources were also used for collection, cross-checking, and clarification.
Primary Interviews and Surveys
We speak with operators, infrastructure specialists, enterprise buyers, and regulatory or commercial leaders in Israel. Their feedback tests subscriber trends, ARPU, fiber and 5G rollout, tower income, and enterprise demand, helping us fill gaps, triangulate assumptions, and validate final estimates.
Distribution of primary research fieldwork respondents
| Company type | Respondent position |
|---|---|
| Top tier: 29% | CXOs: 15% |
| Mid tier: 46% | Functional/Unit leaders: 31% |
| Smaller Players: 25% | Managers: 54% |
Market-Sizing & Forecasting
Sizing started from a top-down build where national subscriptions and usage indicators were reconstructed by service line, then translated into revenue using observed ARPU and bundle pricing patterns. To keep totals realistic, we corroborated results with selective bottom-up approximations, such as sampling plan price points, checking reported service revenue bands from public filings, and validating implied revenue per subscriber against interview feedback.
Inputs that mattered most included mobile and fixed subscriber counts, postpaid and prepaid mix, data consumption trends, 4G to 5G uptake timing, and the share of households covered by fiber networks, since this influences broadband speed tier adoption and pricing. Where a data series was missing for a sub-segment, we filled gaps using short, defensible bridges like interpolation across adjacent years, then re-checked against operator commentary and regulator updates.
For forecasting, scenario analysis was used around the few variables that swing revenue the most in Israel, especially price competition intensity and the pace of premium plan migration. These scenarios were narrowed into a base case using expert consensus gathered in primary discussions. The final trajectory was sanity-checked against macro constraints like household spending and business connectivity demand.
Data Validation & Update Cycle
Outputs were validated through triangulation across three layers: model math checks, independent market signals (subscriptions, coverage, and price moves), and interview-backed reasonableness checks. If a segment grew faster than the related demand signal, assumptions were re-opened and the analyst revisited unit volumes, pricing, and timing until the variance narrowed.
Before sign-off, the model goes through multi-step internal reviews where anomalies are flagged, reconciled, and documented. Respondents may be re-contacted when a specific driver changes or contradicts another source. Reports are refreshed annually, with interim updates for material events, and a final freshness pass is completed right before delivery so clients receive the latest updated view.
Mordor Intelligence's Israel Telecom Market Size Compared Against Other Published Estimates
Different published market sizes for Israel telecom can look far apart because the scope line is drawn differently, and because revenue can be counted at the operator level or expanded to include adjacent digital services. Timing also matters since some publishers use older base years, while others apply more aggressive price recovery assumptions in a market where tariffs can reset quickly.
Handset and device resale revenue is kept outside Mordor Intelligence's scope here. This is one of the main reasons some broader telecom figures appear larger even when subscriber totals look similar.
Benchmark comparison
| Source | Market Size | Gaps in Research Methodology |
|---|---|---|
| Mordor Intelligence | USD 3.75 B (2026) | |
| Global Consultancy A | USD 4.60 B (2026) | Uses a wider telecom definition that blends operator service revenue with device-related revenue and certain ICT add-ons, and applies a faster ARPU rebound assumption after pricing changes. |
| Industry Association B | USD 3.20 B (2025) | Anchors on a prior-year revenue base and emphasizes legacy voice and basic mobile access, which can understate newer monetization from higher-speed broadband tiers and value-added services. |
Looking across the table, the spread is mostly explained by what gets counted as telecom revenue and by which year is treated as the starting point for price and mix trends. By keeping inputs tied to observable subscriptions, plan pricing, and service revenue consistency checks, the estimate stays traceable to clear steps that another analyst can repeat.


Key Questions Answered in the Report
What is the current Israel Telecom MNO Market size?
The Israel Telecom MNO Market size is USD 3.75 billion in 2026 and is projected to register a CAGR of 1.17% during the forecast period (2026-2031)
Who are the key players in Israel Telecom MNO Market?
Bezeq, Pelephone, Cellcom, Golan telecom and AT&T are the major companies operating in the Israel Telecom Market.
What years does this Israel Telecom MNO Market cover?
The report covers the Israel Telecom MNO Market historical market size for years: 2019, 2020, 2021, 2022, 2023 and 2024. The report also forecasts the Israel Telecom Market size for years: 2026, 2027, 2028, 2029, 2030 and 2031.
Page last updated on:


 Your data is secure and never sold or shared.


