
Outcome-as-a-Service Software Market Size and Share
Market Overview
| Study Period | 2020 - 2031 |
|---|---|
| Market Size (2026) | USD 3.61 Billion |
| Market Size (2031) | USD 15.91 Billion |
| Growth Rate (2026 - 2031) | 34.53 % |
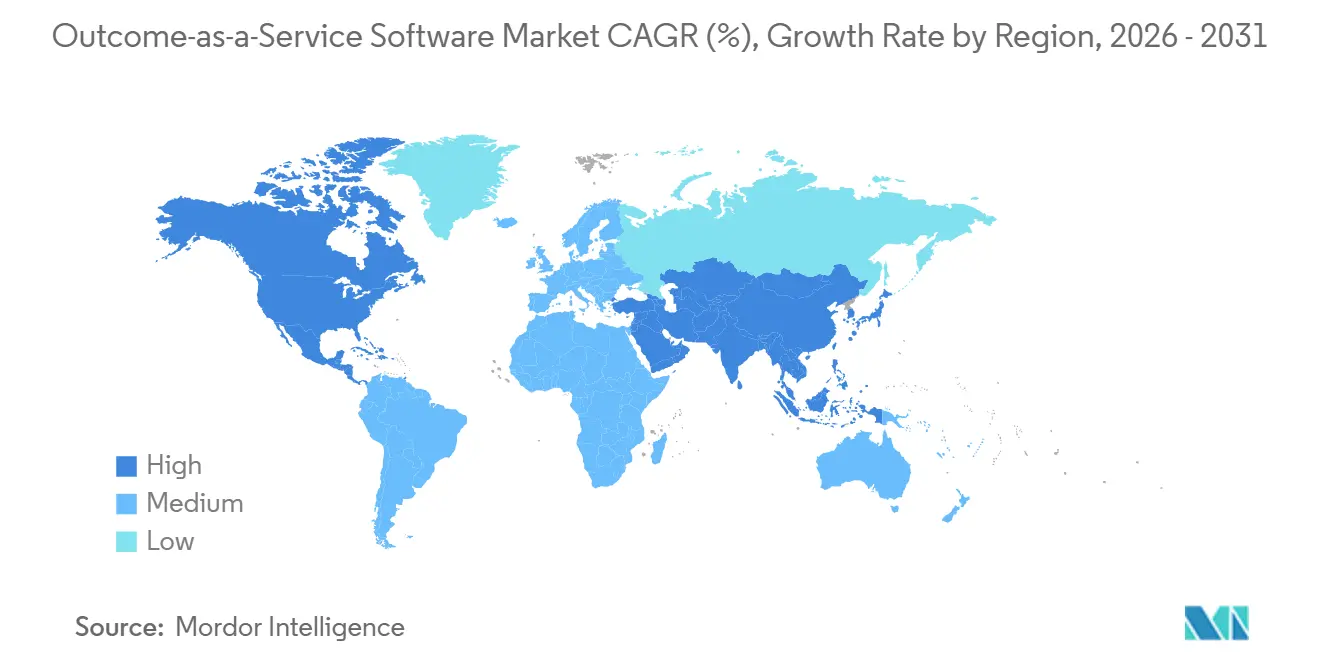
| Fastest Growing Market | Asia Pacific |
| Largest Market | North America |
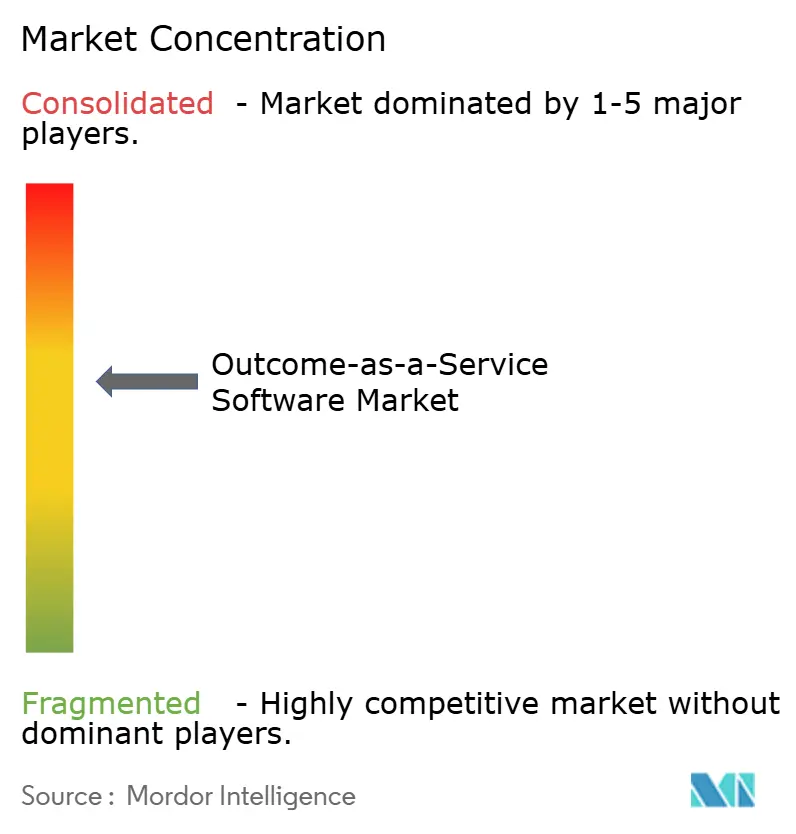
| Market Concentration | Medium |
Major Players *Disclaimer: Major Players sorted in no particular order Image © Mordor Intelligence. Reuse requires attribution under CC BY 4.0. | |
Outcome-as-a-Service Software Market Analysis by Mordor Intelligence
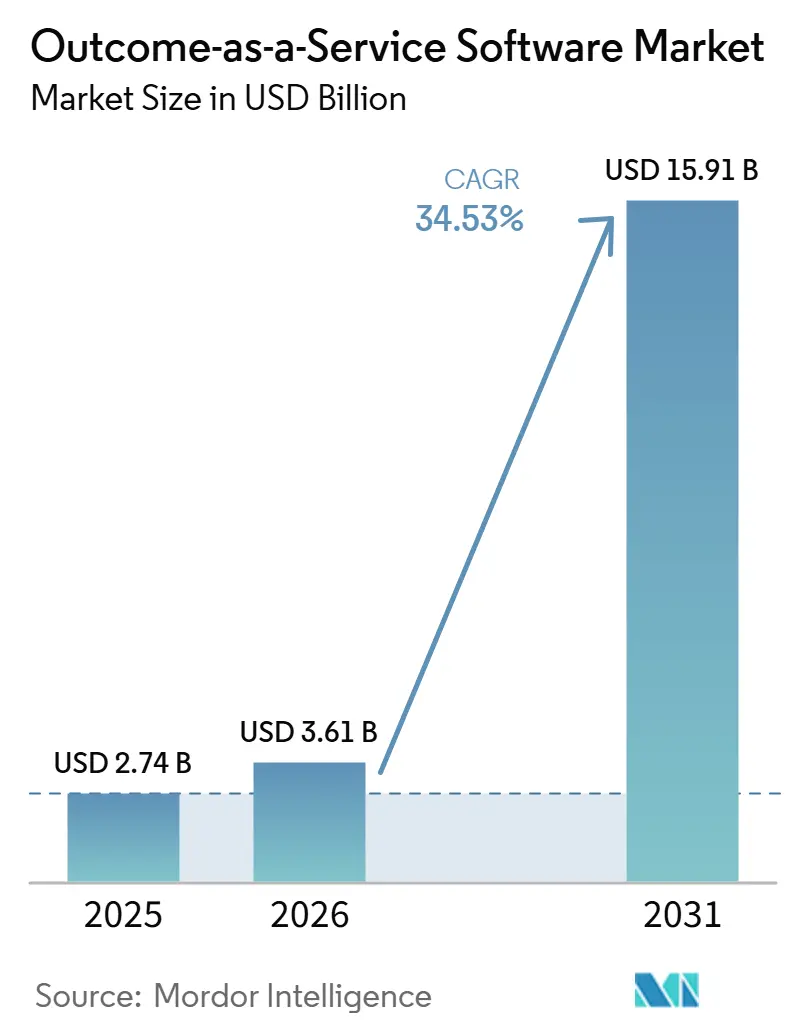
The Outcome-as-a-Service software market size is projected to expand from USD 2.74 billion in 2025 and USD 3.61 billion in 2026 to USD 15.91 billion by 2031, registering a CAGR of 34.53% over 2026-2031. Capital-intensive buyers across aerospace, energy, and healthcare are shifting spend toward contracts that guarantee measurable business results, allowing them to preserve cash while vendors capture premium recurring revenue. Industrial incumbents with deep equipment footprints are bundling sensors, analytics, and service guarantees to lock in multiyear deals, while software-first entrants target greenfield opportunities with natively digital offerings. Rapid cloud adoption, cheaper AI compute, and ubiquitous 4G-plus coverage have lowered the cost of real-time performance monitoring, enabling tighter confidence intervals for outcomes that support risk-sharing economics. At the same time, sustainability mandates are inserting carbon-reduction key performance indicators into enterprise procurement, broadening the scope of contractual outcomes that suppliers must underwrite.
Key Report Takeaways
- By service type, managed outcome services led with 44.43% revenue share in 2025, while support and optimization are advancing at a 34.89% CAGR through 2031.
- By subscription model, subscription-based pricing accounted for 52.78% of the 2025 revenue pool, whereas performance-based models are projected to grow by 35.32% from 2026 to 2031.
- By technology, AI and analytics platforms accounted for 38.32% of technology spending in 2025, but digital twin tools are forecast to expand at a 35.99% CAGR through 2031.
- By application, IT and telecom accounted for 27.52% of deployments in 2025; energy and utilities exhibit the fastest trajectory, rising to 35.58% through 2031.
- By geography, North America captured 34.09% of 2025 revenue, yet Asia-Pacific is poised for the strongest uptick with a 35.53% CAGR over 2026-2031.
Note: Market size and forecast figures in this report are generated using Mordor Intelligence’s proprietary estimation framework, updated with the latest available data and insights as of January 2026.
Market Trends and Insights
Drivers Impact Analysis of Outcome-as-a-Service Software Market*
| Driver | (~) % Impact on CAGR Forecast | Geographic Relevance | Impact Timeline |
|---|---|---|---|
| Growing Demand for Pay-per-Outcome Commercial Models | +8.2% | Global, with early traction in North America and Europe | Medium term (2-4 years) |
| Accelerated Enterprise Adoption of AI and Advanced Analytics Platforms | +7.5% | Global, concentrated in OECD markets with mature cloud infrastructure | Short term (≤ 2 years) |
| Shift Toward Opex-Driven Consumption Preferences Across Industries | +6.8% | Global, particularly strong in Asia-Pacific and North America | Medium term (2-4 years) |
| ESG-Linked Outcome Contracts Incorporating Carbon-Reduction KPIs | +4.9% | Europe and North America, expanding to Asia-Pacific | Long term (≥ 4 years) |
| Public-Sector Mandates to Tie IT Spending to Performance Benchmarks | +4.1% | North America, with selective adoption in Europe and Middle East | Medium term (2-4 years) |
| Emergence of Insurance-Backed Outcome Guarantees Reducing Buyer Risk | +2.8% | North America and Europe, limited penetration in emerging markets | Long term (≥ 4 years) |
| Source: Mordor Intelligence | |||
Growing Demand for Pay-per-Outcome Commercial Models
Enterprises exhausted with billable-hour and parts-replacement contracts increasingly insist on fee structures pegged to uptime, throughput, or revenue uplift. Rolls-Royce’s TotalCare program generated more than half of the firm’s civil aerospace services revenue in 2025 by tying engine fees to flight hours, proving that predictable operating costs outweigh ownership for airlines.[1] Similar mechanics underpin Michelin’s pay-per-mile tire deals that delivered 5.9% fuel savings and 8% downtime reduction across 600,000 fleet vehicles in 2025. Warehouse-automation specialist Advanced Intralogistics bills clients on throughput velocity, aligning incentives with productivity gains. Outcome-aligned pricing boosts vendor lifetime value but requires robust telemetry and contractual clarity to avoid disputes.
Accelerated Enterprise Adoption of AI and Advanced Analytics Platforms
Predictive algorithms that flag failures 30-90 days in advance transform performance guarantees from speculative bets into data-driven commitments. C3 AI’s Reliability application predicts equipment issues with 92% accuracy, allowing service providers to promise 98% availability without stockpiling spares. UptimeAI cut unplanned industrial downtime by 30% in 2025, enabling tighter service-level thresholds. IBM Maximo processed more than 1 billion sensor readings per day in 2025, serving as the analytical backbone for outcome contracts in utilities and heavy industry. As AI toolkits mature, vendors can price risk more precisely, encouraging broader adoption of performance-tied deals.
Shift Toward Opex-Driven Consumption Preferences Across Industries
Chief financial officers favor operating-expense models that protect balance-sheet ratios, spurring demand for subscriptions and outcome leases. A 2025 survey of 1,200 enterprises found that 61% had adopted consumption pricing for at least one major technology category. Schneider Electric’s EcoStruxure Service Plan reduced customers’ maintenance costs by 40% in 2025 while extending asset life by 75%, providing a template for condition-based annual subscriptions. Signify’s light-as-a-service contracts already comprise 37% of revenue and charge for delivered lux rather than fixtures. This pivot toward variable cost structures underpins the sustained expansion of the Outcome-as-a-Service software market.
ESG-Linked Outcome Contracts Incorporating Carbon-Reduction KPIs
Corporate decarbonization commitments are embedding emissions metrics into service agreements. Microsoft allocated USD 200 million in 2025 to buy 4.8 million carbon removal credits under a pay-for-performance contract with Anew Climate. Schneider Electric’s EcoStruxure Outcomes framework guarantees 15-30% energy savings within two years, directly monetizing Scope 1 and Scope 2 reductions. Signify’s 2026 update targets 35% of total revenue from sustainability-linked offerings by 2030, with contracts pledging up to 70% energy savings versus legacy lighting. Regulatory tailwinds, such as the EU Corporate Sustainability Reporting Directive, amplify demand by forcing large enterprises to quantify and outsource their carbon performance.
Restraints Impact Analysis of Outcome-as-a-Service Software Market*
| Restraint | (~) % Impact on CAGR Forecast | Geographic Relevance | Impact Timeline |
|---|---|---|---|
| Difficulty in Defining and Attributing Measurable Outcomes | -3.7% | Global, particularly acute in multi-vendor environments | Short term (≤ 2 years) |
| Heightened Contractual and Legal Exposure for Service Providers | -2.9% | North America and Europe, where contract enforcement is robust | Medium term (2-4 years) |
| Falling AI Compute Costs Undermining Outcome-Pricing Unit Economics | -2.1% | Global, with greatest impact in cloud-native services | Medium term (2-4 years) |
| Scarcity of Standardized Outcome Data in Emerging Economies | -1.6% | Africa, South America, and parts of Southeast Asia | Long term (≥ 4 years) |
| Source: Mordor Intelligence | |||
Difficulty in Defining and Attributing Measurable Outcomes
Outcome contracts often unravel when several suppliers influence the same metric, leading to disputes that stall payments. An academic study of 47 initiatives found that 38% failed to meet targets, with attribution issues driving 62% of renegotiations. GE Digital’s Predix roll-out faltered once clients struggled to isolate platform gains from unrelated process tweaks. In healthcare, the Centers for Medicare and Medicaid Services canceled a value-based insurance pilot after multibillion-dollar costs could not be tied to patient outcomes. Until standardized measurement protocols emerge, vendors will prefer single-party environments where causality is clearer.
Heightened Contractual and Legal Exposure for Service Providers
Guaranteeing performance invites breach-of-contract claims when targets slip, pushing vendors to post bonds or absorb litigation costs. The U.S. General Services Administration now requires federal contractors to place 10-20% performance bonds on outcome deals, raising capital barriers for mid-market firms.[2] Gainshare structures can be asymmetric, with vendors fronting 100% of the implementation costs while revenue is realized only after savings are verified. Defense suppliers contest whether cyber incidents violate outcome terms under the Department of Defense’s CMMC 2.0 rules. Insurance products that offset these risks remain expensive for contracts that feature novel KPIs, deterring smaller entrants and tempering market growth.
*Our forecasts treat driver/restraint impacts as directional, not additive. The impact forecasts reflect baseline growth, mix effects, and variable interactions.
Outcome-as-a-Service Software Market Segment Analysis
By Service Type:
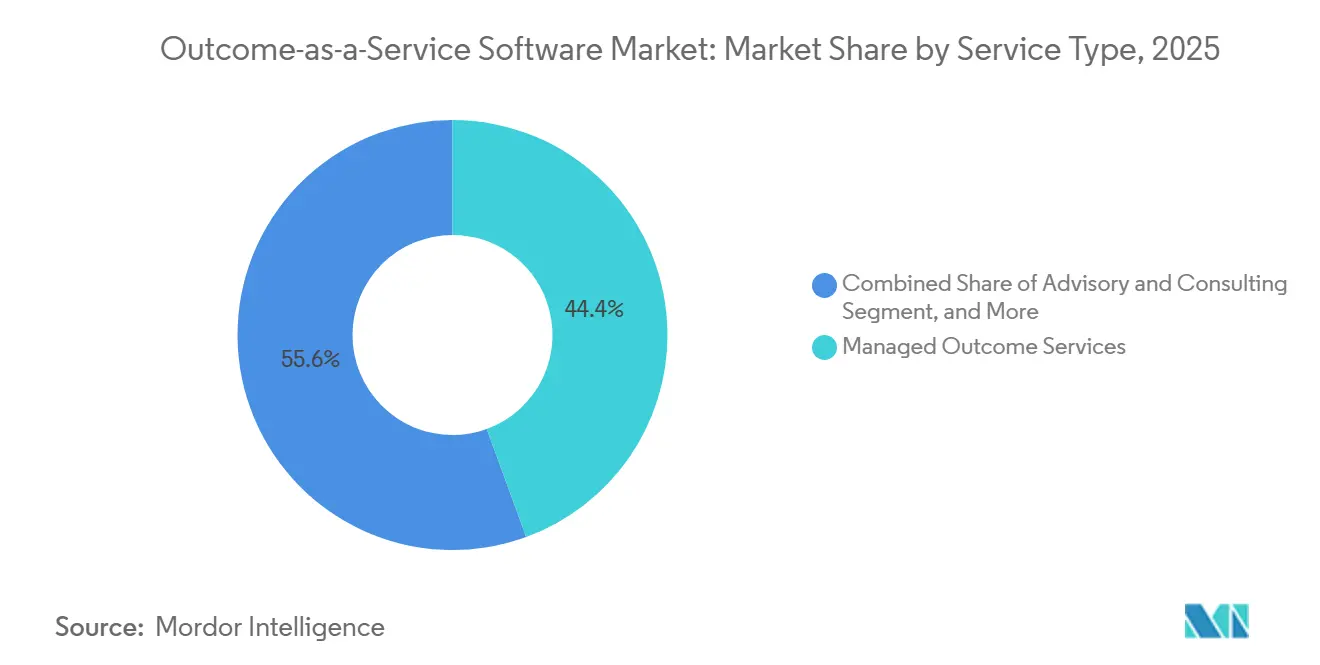
Managed Services Dominate, Optimization AcceleratesManaged outcome services accounted for 44.43% of 2025 revenue, underscoring client appetite for one-vendor accountability across complex asset fleets. The Outcome-as-a-Service software market size for managed offerings is expanding as incumbents leverage decades of operational data to guarantee uptime, efficiency, and compliance. Schneider Electric’s EcoStruxure Foresight Operation, commercially released in Q3 2026, bundles 24/7 monitoring with predictive maintenance and promises a 75% reduction in failure risk, cementing the vendor’s managed-service positioning.[3]
Support and optimization services are forecast to grow at 34.89% annually to 2031 as installed bases mature, and buyers pursue incremental gains without disrupting current workflows. GE Digital’s long-term agreements with renewable operator Invenergy exemplify post-deployment tuning that squeezes extra output from connected assets. Advisory work retains relevance for firms new to outcome economics, while implementation margins narrow as deployment processes standardize. The widening footprint of optimization deals signals sticky, high-margin recurring revenue for suppliers that command proprietary performance data, raising switching costs and deepening vendor entrenchment within the Outcome-as-a-Service software market.

By Pricing Model:
Subscription Leads, Performance-Based Gains MomentumSubscription structures captured 52.78% of revenue in 2025 because finance teams prefer budget certainty and minimal variance. These contracts anchor the Outcome-as-a-Service software market share for vendors that bundle hardware, software, and basic support into a flat monthly fee. That said, performance-based terms are rising at a 35.32% CAGR, propelled by demand for vendor-aligned incentives. Michelin’s pay-per-mile framework, which prices tires by distance traveled, illustrates how usage metrics can replace upfront capital outlays.
Hybrid constructs now blend a base subscription with upside or downside adjustments, marrying cash-flow predictability to outcome accountability. Afni’s gainshare deals, where the service provider takes 20-25% of verified cost savings, spotlight this compromise. As AI cuts variance in delivered results, vendors can bid aggressively on outcome components without jeopardizing profitability, reinforcing subscription retention while expanding risk-sharing economics across the Outcome-as-a-Service software market.
By Technology:
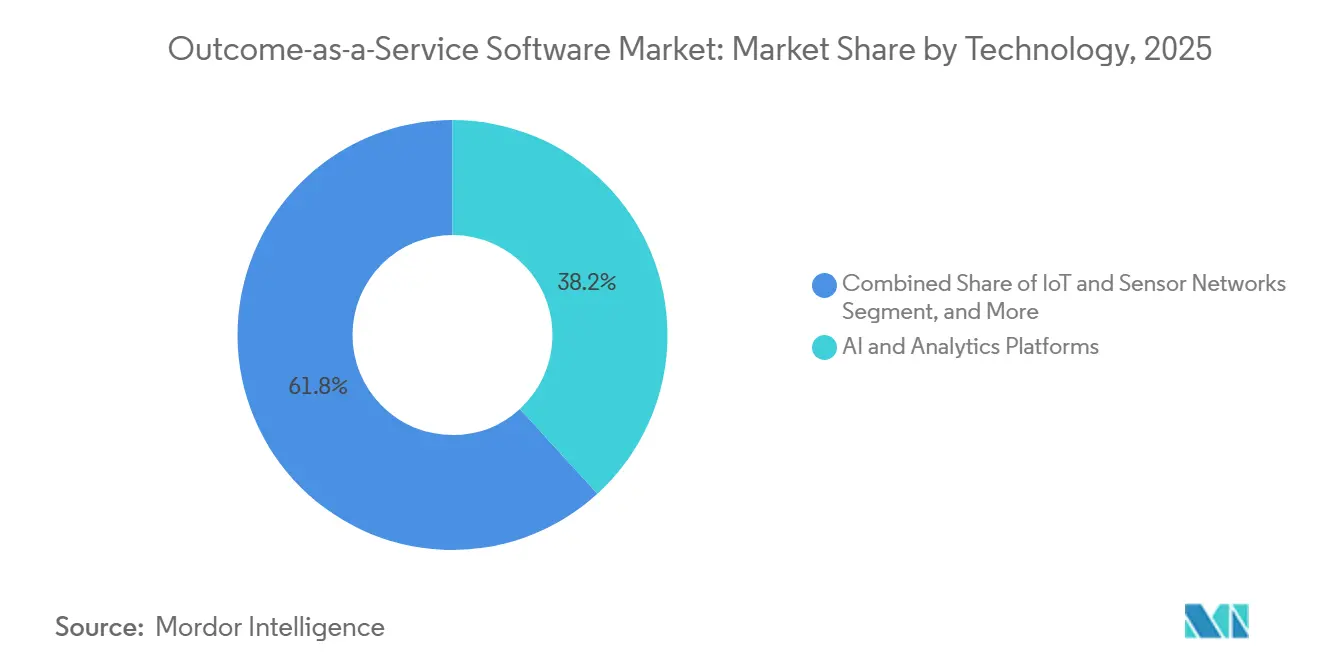
AI Platforms Lead, Digital Twins SurgeAI and analytics platforms accounted for 38.32% of technology spending in 2025, underscoring their critical role as the core decision-making engines enabling real-time guarantees. These platforms are integral to industries aiming to enhance operational efficiency and reduce downtime. For instance, C3 AI’s Reliability and IBM’s Maximo suites demonstrate how predictive models process billions of sensor readings to identify anomalies and schedule preventive or corrective actions. This capability ensures smoother operations and minimizes unexpected disruptions. Additionally, digital twin software is experiencing robust growth, with a projected CAGR of 35.99% through 2031. This growth is driving a significant portion of the Outcome-as-a-Service software market, particularly for simulation-driven solutions that allow clients to test asset scenarios virtually before committing to physical investments. A notable example is Siemens’ Digital Twin Composer, which enabled PepsiCo to significantly reduce prototyping costs while improving throughput, showcasing the value of pre-commitment risk-mitigation strategies.
While IoT networks and edge computing remain essential components of the technology ecosystem, they are increasingly becoming commoditized. As a result, the focus of value creation is shifting toward advanced algorithms and virtual replicas that refine operational decision-making processes. This technological convergence is shortening the feedback loop between data collection, model inference, and real-time optimization. By doing so, it reduces performance variability and enhances confidence in contractual guarantees, further solidifying the foundation of the Outcome-as-a-Service software industry.
By Application:
IT and Telecom Mature, Energy and Utilities AccelerateIT and telecom represented 27.52% of deployments in 2025, having pioneered managed services and cloud subscriptions that paved the way for today’s outcome contracts. This sector has consistently driven innovation in service delivery models, enabling businesses to adopt scalable and flexible solutions. While growth is tapering as penetration levels peak, the segment remains a critical bellwether for pricing strategies, contract architectures, and technological advancements. Additionally, IT and telecom continue to influence other industries by setting benchmarks for operational efficiency and customer-centric approaches, further solidifying their role in shaping the broader market landscape.
Energy and utilities are projected to expand at 35.58% over 2026-2031, making them the fastest-growing slice of the Outcome-as-a-Service software market. Connecticut’s 2026 Energy Storage Solutions program proves regulators are tying incentives to kilowatt-hour performance, not asset ownership. Virtual power plant models that aggregate rooftop solar and batteries now earn capacity payments contingent on delivered grid services, directly aligning vendor income with decarbonization and reliability metrics. Manufacturing, healthcare, BFSI, and retail are following suit, but regulatory clarity and data availability make utilities the standout application for near-term expansion.
Geography Analysis
North America Outcome-as-a-Service Software Market
North America combines mature legal frameworks, rich analytics talent, and aggressive public-sector adoption to anchor 34.09% of 2025 revenue. The GSA’s Outcome-Based Contracting Center of Excellence and the Centers for Medicare and Medicaid Services’ expansion of accountable care programs institutionalize results-driven procurement, encouraging vendors to absorb performance risk in exchange for premium pricing. Canada is piloting performance-tied infrastructure concessions, and Mexico is embedding outcome metrics into power-sector reforms, broadening regional opportunity.
APAC Outcome-as-a-Service Software Market
Asia-Pacific is the growth engine, with a 35.53% CAGR projected through 2031. China’s Made in China 2025, India’s Digital India initiative, and Japan’s Society 5.0 policies mandate smart infrastructure that inherently requires outcome benchmarking. Regional enterprises exhibit high confidence in AI payback horizons, as shown by IBM research, and the Asian Development Bank confirms widespread broadband penetration that supports IoT telemetry.[4] Nonetheless, adoption skews toward big enterprises and state-owned projects, while small businesses lag due to limited capital and expertise.
EMEA and South America Outcome-as-a-Service Software Market
Europe benefits from sustainability statutes that reward verified emissions cuts, propelling light-as-a-service, virtual power plants, and other decarbonization-centric offerings. However, heterogeneous regulatory regimes slow cross-border scaling. In contrast, South America, the Middle East, and Africa remain nascent, with outcome contracts largely confined to donor-funded infrastructure or multinational rollouts. Absent stronger enforcement and standardized data, these regions will trail OECD peers for the foreseeable future.
Competitive Landscape
The Outcome-as-a-Service software market is moderately concentrated. Industrial giants like Rolls-Royce, Schneider Electric, Siemens, and GE Digital leverage decades of operational data to ensure uptime, efficiency, and compliance with emissions targets, bundling hardware with software and long-term service. Schneider Electric’s EcoStruxure suite delivers 40% maintenance cost savings and 75% risk reduction, illustrating incumbents’ ability to monetize installed bases. Signify’s light-as-a-service model accounted for 37% of 2025 revenue, underscoring how asset incumbency translates into outcome revenue.
Specialist software vendors target niches with little entrenched equipment footprint. C3 AI and UptimeAI focus on predictive analytics, while Omada Health and Indigo Ag pioneer measurable health and agriculture outcomes. These disruptors differentiate via proprietary algorithms, insurance-backed guarantees, and pay-as-you-benefit commercial terms. Falling AI compute costs level technical barriers, intensifying competition, and foreshadowing consolidation as incumbents acquire niche innovators to plug capability gaps.
Legal exposure and working-capital needs favor well-capitalized players, discouraging smaller firms from accepting open-ended performance liability. As a result, market share is likely to coalesce around diversified conglomerates that can underwrite risk or around insured platform providers able to syndicate exposure. The interplay of operational data depth, AI sophistication, and balance-sheet strength will determine long-run leadership in the Outcome-as-a-Service software market.
Outcome-as-a-Service Software Industry Leaders
-
Rolls-Royce Plc
-
Schneider Electric SE
-
Siemens AG
-
Signify N.V.
-
Caterpillar Inc.
- *Disclaimer: Major Players sorted in no particular order
Outcome-as-a-Service Software Market Companies Covered in this Report
- Rolls-Royce plc
- Signify N.V.
- Kaeser Kompressoren SE
- Schneider Electric SE
- Siemens AG
- Caterpillar Inc.
- Alstom SA
- GE Digital LLC
- Deere and Company
- Compagnie Générale des Établissements Michelin SCA
- Bombardier Inc.
- Tacton Systems AB
- Viridien Group Limited
- Outcome Referrals Inc.
- ServiceMax Inc.
- Darktrace plc
- Omada Health Inc.
- Zipline International Inc.
- Indigo Ag Inc.
- DataRobot Inc.
Recent Industry Developments in Outcome-as-a-Service Software Market
- March 2026: Signify updated its Brighter Lives Better World 2030 roadmap, targeting 35% of revenue from sustainability-linked offerings and embedding carbon reporting into light-as-a-service contracts.
- January 2026: Siemens unveiled Digital Twin Composer at CES 2026, highlighting a PepsiCo deployment that cut prototyping costs by virtualizing production lines before committing to capex.
- November 2025: Schneider Electric introduced EcoStruxure Foresight Operation, a managed service that guarantees electrical infrastructure uptime and rolls out commercially in Q3 2026.
- October 2025: Deere partnered with Starlink to stream real-time agronomic data from autonomous tractors, underpinning yield-based pricing strategies.
Global Outcome-as-a-Service Software Market Report Scope
The Outcome-as-a-Service (OaaS) software market refers to a business model in which organizations deliver measurable, predefined business outcomes to customers rather than selling standalone products or services. In this model, providers assume partial or full responsibility for achieving agreed-upon results, leveraging advanced technologies, data-driven insights, and continuous service delivery frameworks.
The Outcome-as-a-Service Software Market Report is Segmented by Service Type (Advisory and Consulting, Implementation and Integration, Managed Outcome Services, and Support and Optimization), Pricing Model (Subscription-Based, Performance-Based, Gainshare, and Hybrid), Technology (AI and Analytics Platforms, IoT and Sensor Networks, Cloud and Edge Infrastructure, and Digital Twin and Simulation), Application (Healthcare and Life Sciences, Manufacturing and Industrial, BFSI, Retail and E-Commerce, and Energy and Utilities), and Geography (North America, South America, Europe, Asia-Pacific, and Middle East and Africa). The Market Forecasts are Provided in Terms of Value (USD).
Segmentation Overview
| Advisory and Consulting |
| Implementation and Integration |
| Managed Outcome Services |
| Support and Optimization |
| Subscription-Based |
| Performance-Based |
| Gainshare |
| Hybrid |
| AI and Analytics Platforms |
| IoT and Sensor Networks |
| Cloud and Edge Infrastructure |
| Digital Twin and Simulation |
| Healthcare and Life Sciences |
| Manufacturing and Industrial |
| BFSI |
| Retail and E-Commerce |
| Energy and Utilities |
| North America | United States | |
| Canada | ||
| Mexico | ||
| South America | Brazil | |
| Argentina | ||
| Rest of South America | ||
| Europe | United Kingdom | |
| Germany | ||
| France | ||
| Italy | ||
| Spain | ||
| Rest of Europe | ||
| Asia-Pacific | China | |
| Japan | ||
| India | ||
| South Korea | ||
| Rest of Asia-Pacific | ||
| Middle East and Africa | Middle East | United Arab Emirates |
| Saudi Arabia | ||
| Rest of Middle East | ||
| Africa | South Africa | |
| Egypt | ||
| Rest of Africa | ||
| By Service Type | Advisory and Consulting | ||
| Implementation and Integration | |||
| Managed Outcome Services | |||
| Support and Optimization | |||
| By Pricing Model | Subscription-Based | ||
| Performance-Based | |||
| Gainshare | |||
| Hybrid | |||
| By Technology | AI and Analytics Platforms | ||
| IoT and Sensor Networks | |||
| Cloud and Edge Infrastructure | |||
| Digital Twin and Simulation | |||
| By Application | Healthcare and Life Sciences | ||
| Manufacturing and Industrial | |||
| BFSI | |||
| Retail and E-Commerce | |||
| Energy and Utilities | |||
| By Geography | North America | United States | |
| Canada | |||
| Mexico | |||
| South America | Brazil | ||
| Argentina | |||
| Rest of South America | |||
| Europe | United Kingdom | ||
| Germany | |||
| France | |||
| Italy | |||
| Spain | |||
| Rest of Europe | |||
| Asia-Pacific | China | ||
| Japan | |||
| India | |||
| South Korea | |||
| Rest of Asia-Pacific | |||
| Middle East and Africa | Middle East | United Arab Emirates | |
| Saudi Arabia | |||
| Rest of Middle East | |||
| Africa | South Africa | ||
| Egypt | |||
| Rest of Africa | |||
Key Questions Answered in the Report
How large will spending tied to guaranteed business results become by 2031?
The Outcome-as-a-Service software market is forecast to reach USD 15.91 billion by 2031, up from USD 3.61 billion in 2026.
Which commercial model is growing fastest within performance contracts?
Performance-based pricing is projected to rise at a 35.32% CAGR as enterprises seek tighter alignment between vendor fees and quantifiable outcomes.
Why are energy utilities embracing outcome contracts more rapidly than other sectors?
Grid modernization mandates and performance-based regulation reward utilities for reliability and emissions metrics, spurring 35.58% CAGR growth for energy and utilities deployments.
What technology investments underpin reliable outcome guarantees?
AI and analytics platforms, digital twins, and dense IoT sensor networks create predictive insights that allow vendors to promise uptime, throughput, or carbon reductions with greater confidence.
Which region will contribute the most incremental revenue over the next five years?
Asia-Pacific is expected to post the highest absolute gain, expanding at 35.53% CAGR as smart-city and industrial digitalization initiatives embed outcome procurement into public-private projects.
What is the primary risk vendors face when offering outcome-based contracts?
Legal exposure from missed targets remains a key restraint, with performance bonds and potential breach-of-contract claims pressuring margins, especially for mid-size suppliers.