
Operating Room Equipment Market Size and Share
Market Overview
| Study Period | 2020 - 2031 |
|---|---|
| Market Size (2026) | USD 51.10 Billion |
| Market Size (2031) | USD 64.87 Billion |
| Growth Rate (2026 - 2031) | 4.89 % |
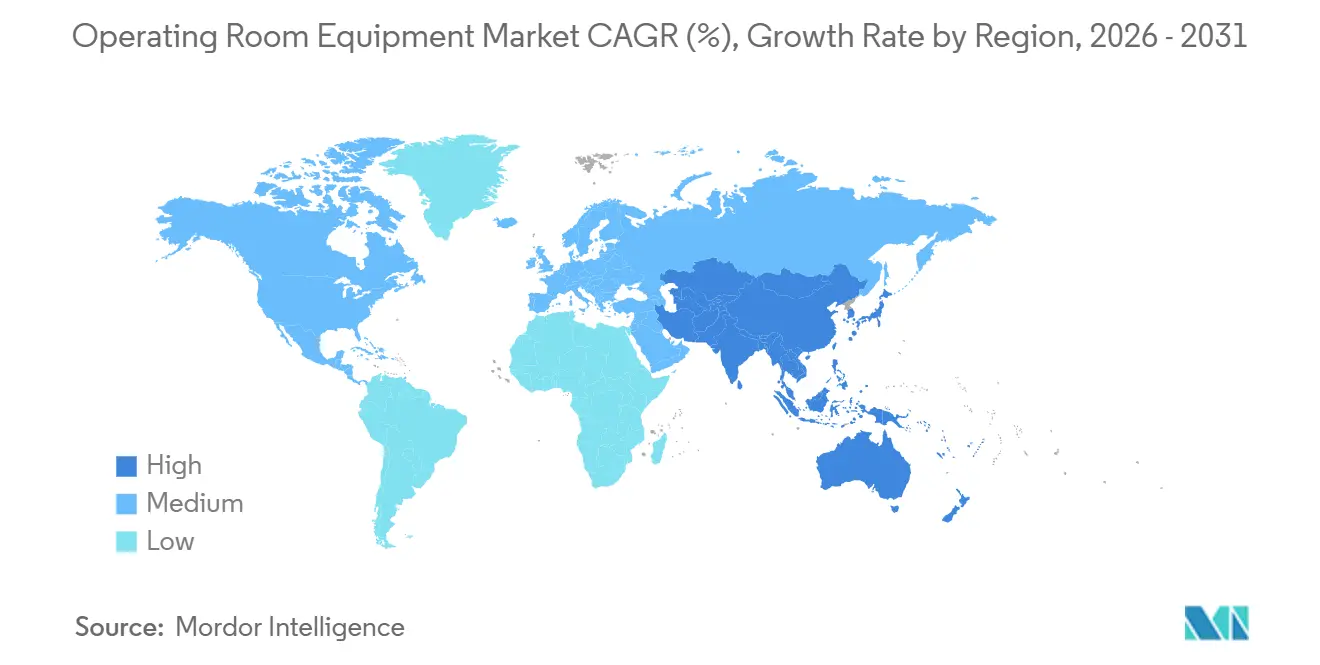
| Fastest Growing Market | Asia-Pacific |
| Largest Market | North America |
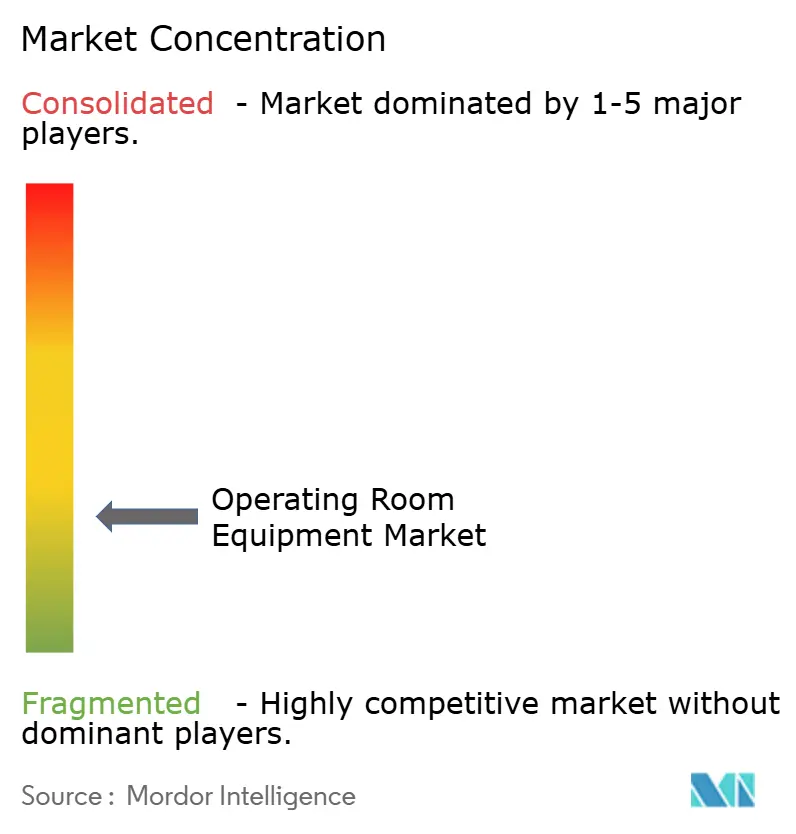
| Market Concentration | Low |
Major Players *Disclaimer: Major Players sorted in no particular order Image © Mordor Intelligence. Reuse requires attribution under CC BY 4.0. | |
Operating Room Equipment Market Analysis by Mordor Intelligence
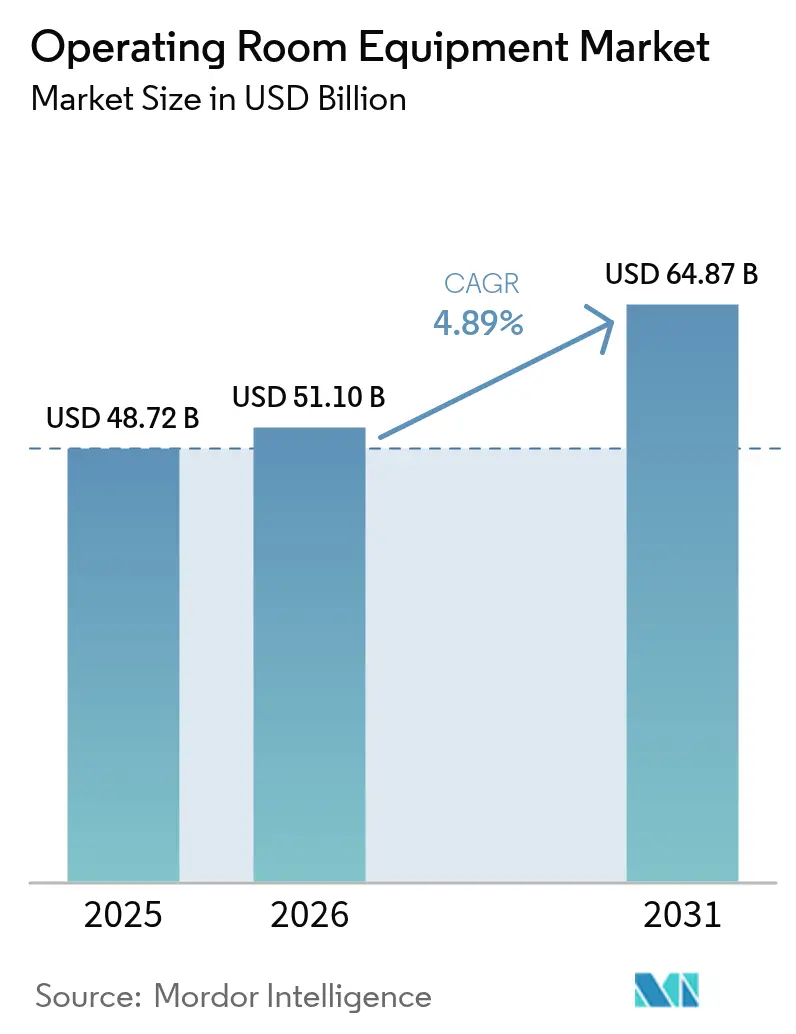
The operating room equipment market size is projected to expand from USD 48.72 billion in 2025 and USD 51.10 billion in 2026 to USD 64.87 billion by 2031, registering a CAGR of 4.89% between 2026 to 2031. Procedure backlogs that built up during 2020–2022 continue to funnel hospital capital toward modernizing anesthesia, visualization, and data-integration assets even as broader infrastructure spending plateaus. National carbon-reduction mandates have pushed LED lighting, low-flow anesthesia workstations, and energy-monitoring modules to the top of replacement schedules, while subscription-based surgical-visualization software is opening the operating room equipment market to software-native entrants. The transition to minimally invasive procedures keeps demand buoyant for hybrid suites, intraoperative imaging, and robotic navigation, yet EU MDR 2027 re-certification and rising cybersecurity-insurance premiums are creating temporary hurdles that slow refresh cycles in Europe and North America. Overall, the operating room equipment market remains structurally linked to the growth of ambulatory surgical centers (ASCs), which are securing a larger share of elective cases thanks to favorable reimbursement changes in 2024 and 2025.
Key Report Takeaways
- By product category, anesthesia devices led with 54.54% operating room equipment market share in 2025, while surgical imaging systems are projected to advance at a 10.25% CAGR through 2031.
- By mobility, fixed or in-built installations captured 57.54% of 2025 revenue; modular and retrofit solutions are forecast to grow at 7.65% CAGR to 2031.
- By end user, hospitals accounted for 75.15% of demand in 2025; ambulatory surgical centers are expected to expand at a 9.82% CAGR through 2031.
- By surgical specialty, general surgery held 38.23% of the 2025 base, whereas neurosurgery-focused equipment is poised to grow at 6.42% CAGR to 2031.
- By geography, North America retained 39.23% revenue share in 2025, and Asia-Pacific is projected to record a 6.12% CAGR to 2031.
Note: Market size and forecast figures in this report are generated using Mordor Intelligence’s proprietary estimation framework, updated with the latest available data and insights as of 2026.
Market Trends and Insights
Drivers Impact Analysis of Operating Room Equipment Market*
| Driver | (~) % Impact on CAGR Forecast | Geographic Relevance | Impact Timeline |
|---|---|---|---|
| Growing incidence of chronic diseases requiring surgeries | +1.2% | Global, with concentration in North America, Europe, and aging Asia-Pacific populations | Long term (≥ 4 years) |
| Rising number of hospitals & government funding | +0.9% | APAC core (China, India), spill-over to MEA and South America | Medium term (2-4 years) |
| Increasing adoption of minimally-invasive & image-guided surgeries | +1.5% | North America & EU, with rapid uptake in urban APAC centers | Medium term (2-4 years) |
| Post-pandemic elective-surgery backlog accelerating OR upgrades | +0.8% | North America, UK, Western Europe | Short term (≤ 2 years) |
| Carbon-neutral procurement mandates driving LED & low-energy OR retrofits | +0.4% | EU, UK, select US health systems (California, New York) | Medium term (2-4 years) |
| SaaS-based surgical-visualization subscriptions enabling mid-tier upgrades | +0.6% | Global, with early adoption in North America and Western Europe | Short term (≤ 2 years) |
| Source: Mordor Intelligence | |||
Growing Incidence of Chronic Diseases Requiring Surgeries
Escalating prevalence of cardiovascular, oncologic, and metabolic disorders is raising the annual global surgical volume, stretching legacy OR infrastructure and catalyzing procurement plans aimed at cutting turnover time and anesthesia exposure. Aging populations in the United States, Germany, Japan, and China have pushed average surgical case complexity higher, favoring hybrid rooms equipped with integrated CT or angiography. Hospitals are purchasing advanced patient monitors that stream physiologic data directly into electronic health records, aiding chronic-condition management and postoperative follow-up. The long-term demand curve therefore aligns squarely with demographic trends rather than economic cycles. Vendors that bundle perioperative analytics and consumables with durable hardware are positioned to capture wallet share as chronic-disease caseloads rise.
Post-Pandemic Elective-Surgery Backlog Accelerating OR Upgrades
NHS England reported 7.57 million open pathways as of September 2024, roughly double pre-pandemic volume and a level that continues to strain evening and weekend OR sessions. Similar bottlenecks in France and the United States are exposing limits of older anesthesia workstations whose maintenance cycles were never designed for extended hours. To keep pace, health ministries released targeted capital grants—the United Kingdom ring-fenced GBP 1.5 billion for theater modernization in FY 2024–2025—while hospitals negotiated lease-to-own financing that preserves cash flow yet accelerates equipment refresh. Semiconductor shortages dragged delivery timelines to 18–24 months during 2024, but inventories normalized in early 2026, enabling vendors to clear backorders and generate a revenue spike that should taper by 2027 when waiting lists normalize. Because backlogs are temporary, manufacturers emphasize modular upgrades that install in days, avoiding decade-long commitments that may outlast deferred-care surges.
Increasing Adoption of Minimally Invasive & Image-Guided Surgeries
Intuitive Surgical shipped 1,707 da Vinci systems in 2024, a 14% year-on-year gain that propelled robotic procedures to 15% of U.S. general-surgery cases[1]Intuitive Surgical, “Q4 2024 Results,” intuitive.com . Orthopedic and neurosurgical penetration remains low, leaving wide headroom for platforms such as Medtronic’s Mazor X Stealth Edition and Globus Medical’s ExcelsiusGPS. Capital intensity—USD 1.5–2.5 million per robot—has pushed hospitals toward multi-year service contracts bundling instruments, software, and training, effectively shifting CapEx to OpEx. The Centers for Medicare & Medicaid Services added 12 CPT codes for robotic procedures in January 2024, enabling ASC adoption and broadening the addressable base. As payer policy aligns with clinical preference, hybrid OR build-outs that marry imaging and navigation are accelerating, cementing a structural tailwind that extends well beyond the forecast horizon.
Carbon-Neutral Procurement Mandates Driving LED & Low-Energy OR Retrofits
NHS England’s Net Zero Supplier Roadmap forces vendors on contracts above GBP 5 million to publish carbon-reduction plans, accelerating LED conversions and low-flow anesthesia adoption in public trusts. UCLA Health’s 2024 retrofit cut OR energy use by 38% and secured USD 1.2 million in state rebates. European manufacturers now embed power-monitoring sensors that feed dashboard analytics, giving procurement officers proof of future savings during budget review. Early adopters with dedicated sustainability teams are front-loading investments to hit 2030 interim milestones, while smaller facilities wait for grants, creating two-speed adoption that equipment vendors address with tiered product lines. Over the medium term, every new tender in Western Europe scores bids on total lifecycle emissions, further entrenching energy efficiency as a purchase criterion.
Restraints Impact Analysis of Operating Room Equipment Market*
| Restraint | (~) % Impact on CAGR Forecast | Geographic Relevance | Impact Timeline |
|---|---|---|---|
| High capital & maintenance costs of OR equipment | -0.7% | Global, with acute pressure in emerging markets and rural healthcare systems | Long term (≥ 4 years) |
| Shortage of skilled peri-operative personnel | -0.5% | North America, Western Europe, Australia | Medium term (2-4 years) |
| Escalating cybersecurity-insurance premiums for connected OR platforms | -0.3% | North America, EU | Short term (≤ 2 years) |
| EU-MDR 2027 re-certification bottleneck delaying device refresh cycles | -0.6% | EU, with indirect impact on global supply allocation | Short term (≤ 2 years) |
| Source: Mordor Intelligence | |||
High Capital & Maintenance Costs of OR Equipment
A fully integrated hybrid suite costs USD 5–8 million, and annual service contracts add 8–12% of purchase price, squeezing community hospitals that run on sub-5% operating margins[2]American College of Surgeons, “Hybrid Operating Room Economics,” facs.org. Leasing eases upfront outlay but shifts residual-value risk to suppliers, who must guess depreciation in a market where imaging software releases every 18 months. India’s General Financial Rules split tenders above INR 2.5 million, undermining volume discounts and inflating per-unit prices by 10–15%. In Latin America, import tariffs tack on another 20–30%, forcing facilities to stretch assets well past recommended lifespan. Because capital scarcity is structural, vendors see opportunity in modular add-ons and certified refurbishment programs that lower entry thresholds without sacrificing clinical performance.
EU-MDR 2027 Re-Certification Bottleneck Delaying Device Refresh Cycles
Transition rules let MDD-certified Class III and IIb devices stay on shelves until December 2027, but notified-body capacity remains limited, extending review times beyond 18 months and prompting manufacturers to prioritize high-revenue lines. MedTech Europe warned that 30–40% of legacy OR items may exit the market by 2028 because re-certification costs range from EUR 0.5–2 million per product family. Hospitals hedge by stockpiling consumables and locking service extensions, a tactic that prolongs use of outdated hardware and briefly dampens new-equipment sales. Vendors with CE-ready portfolios should see a demand spike once bottlenecks clear, but until then contract flows will remain lumpy across the region. The restraint is acute through 2026–2027 and will diminish once the new regulatory baseline is absorbed.
*Our forecasts treat driver/restraint impacts as directional, not additive. The impact forecasts reflect baseline growth, mix effects, and variable interactions.
Operating Room Equipment Market Segment Analysis
By Product:
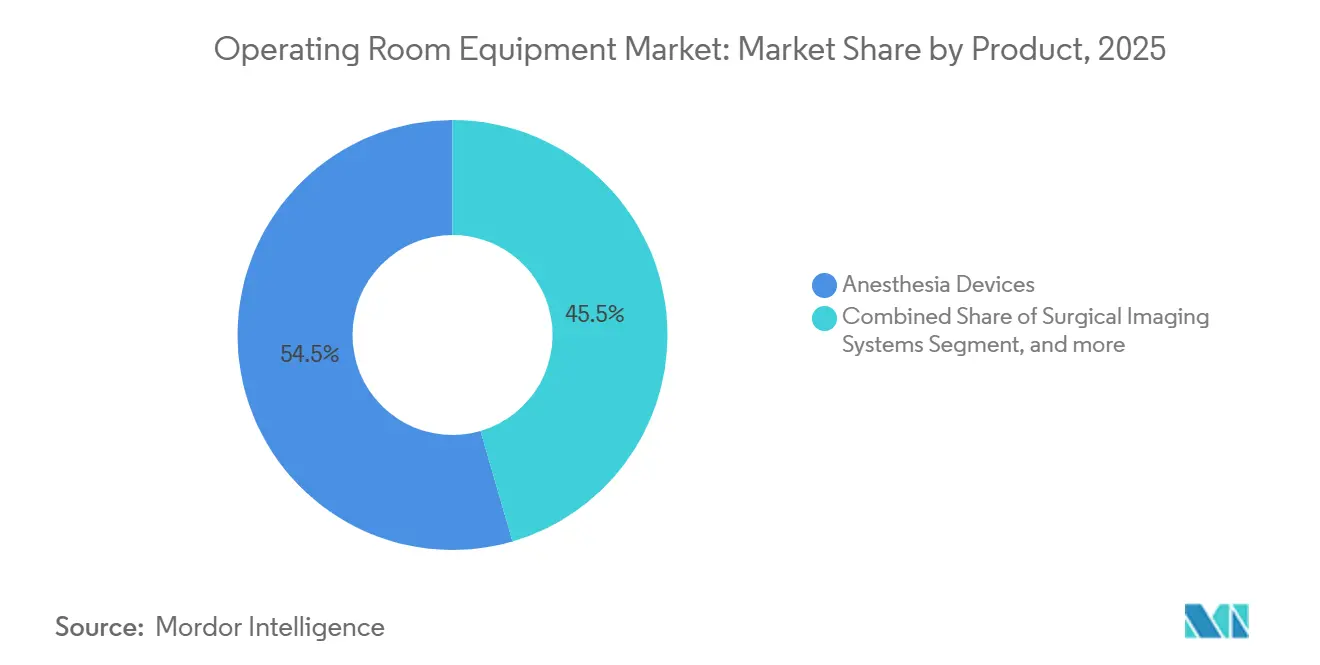
Anesthesia Dominance Masks Imaging SurgeAnesthesia devices accounted for 54.54% of operating room equipment market share in 2025, owing to mature installed bases and strict gas-delivery regulations. Low-flow workstations that cut volatile-anesthetic use by up to 50% are winning tenders as hospitals chase carbon targets and cost savings. In contrast, surgical imaging systems, from mobile cone-beam CT to intraoperative MRI, are expanding at 10.25% CAGR; this pace lifts the operating room equipment market size attributed to imaging far faster than aggregate growth. Electrosurgical units, tables, and lights trail with mid-single-digit gains, though mandated smoke evacuation in Colorado, Rhode Island, and Oregon is reviving demand for specialized suction systems.
Growth dynamics signal a capital-allocation rebalance. Hospitals favor procedure-enabling technologies such as imaging and navigation over infrastructure staples like anesthesia that can be leased or maintained through long-term service. GE HealthCare’s OEC 3D mobile C-arm, cleared by FDA in 2024, delivers hybrid-suite imaging at 60% lower capital cost, aligning with modular spending patterns. Meanwhile, strict FDA and ISO standards keep anesthesia-device innovation slow, preserving share but capping upside. Collectively, these diverging trajectories ensure the operating room equipment market remains heterogeneous across product lines.



By Mobility:
Retrofit Economics Outpace Greenfield BuildsFixed installations held 57.54% of 2025 revenue, cemented in new-build hospitals that embed booms, laminar-flow ceilings, and gas pipelines from day one. Yet modular and retrofit solutions are forecast to rise 7.65% annually, capturing capital redirected from shelved tower projects into phased upgrades that minimize downtime. This shift enlarges the operating room equipment market size attributed to modular packages while trimming average project costs per square foot.
Getinge’s Maquet Moduevo can be installed in 48 hours, versus six weeks for traditional builds, saving hospitals roughly USD 10,000 in lost procedure revenue per day[3]Getinge AB, “Annual Report 2024,” getinge.com . Mobile equipment sees modest uptake in ASCs and disaster-relief settings, but infection-control rules—ISO 14644 cleanroom grades—favor fixed assets with flush surfaces. As greenfield hospital spending decelerates across OECD countries, retrofit providers will shoulder a greater portion of the operating room equipment market, tightening competition on lead-time, installation cost, and maintenance guarantees.
By End User:
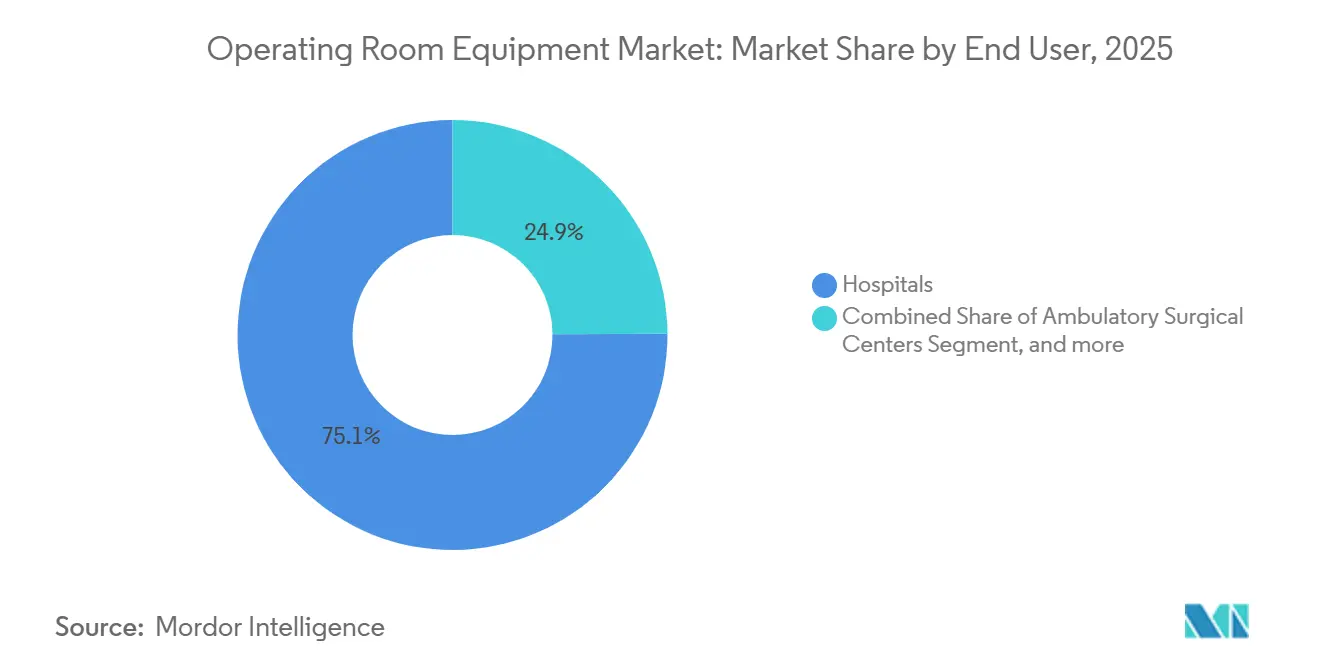
ASC Economics Reshape Equipment SpecificationsHospitals generated 75.15% of 2025 demand because they alone handle high-acuity cardiac, neuro, and trauma cases that require 24/7 anesthesia support. Ambulatory surgical centers, however, are forecast to grow 9.82% CAGR to 2031, powered by CMS reimbursement that now covers multiple robotic CPT codes, a catalyst that boosts the operating room equipment market in the outpatient segment.
ASC economics push vendors to design compact, multi-specialty platforms such as Stryker’s 1688 AIM visualization system, priced at USD 80,000 for sites performing 500–1,000 cases per year. Hospital configurations emphasize feature breadth, climate control, and integration with critical-care dashboards. Diverging spec sheets compel manufacturers to sustain parallel product lines, tilting logistics and R&D toward flexible architectures that can be value-engineered without sacrificing safety. Over time, ASC procurement is likely to raise expectations for rapid installation and per-procedure software billing across the broader operating room equipment industry.
By Surgical Specialty:
Neurosurgery Complexity Commands PremiumGeneral surgery dominated installations at 38.23% in 2025 and therefore anchors base-year revenue calculations inside the operating room equipment market. Neurosurgical suites, though smaller in unit count, are forecast to climb at 6.42% CAGR, driving disproportionate value because a single room can require USD 4–6 million in equipment including robotic navigation and intraoperative.
Brainlab-Zeiss turnkey bundles illustrate how specialty complexity raises vendor lock-in through integrated workflows. Orthopedic robotics for joint replacement is migrating to ASCs, compressing wear cycles on tables and power tools, while cardiovascular hybrid rooms continue to demand USD 2–3 million fixed angiography units. Regulatory divergence compounds these trends: neurosurgical devices often need FDA Class III premarket approval, stretching innovation timelines, whereas general-surgery tools pass through the 510(k) pathway in 6–9 months. The specialty lens therefore highlights why the operating room equipment market remains segmented not just by device but by procedural use-case.
Geography Analysis
North America Operating Room Equipment Market
North America, with 39.23% revenue share in 2025, maintains leadership on the back of Medicare Advantage penetration exceeding 50% of eligible lives and ASC density of one center per 60,000 residents in states such as Florida and Texas. Hospitals in the region continue to replace halogen lights and legacy anesthesia workstations to comply with state carbon targets in California and New York, adding momentum to the operating room equipment market. Cybersecurity-insurance premiums for connected OR platforms, however, jumped 18% year-on-year in 2025, nudging facilities to delay networked-device rollouts until hardening policies are in place. Canada tracks a similar pattern but at smaller scale, with provincial bulk-buy programs extending tender cycles to 24 months.
APAC Operating Room Equipment Market
Asia-Pacific is projected to grow at 6.12% through 2031 as China’s 14th Five-Year Plan assigns CNY 200 billion (USD 28 billion) to hospital construction and India’s Production-Linked Incentive scheme offers 5% subsidies on domestically made devices. Chinese surgical-robot installations climbed 35% in 2024 to about 400 units, aided by domestic vendors pricing 40–50% below Western rivals. India’s split market sees metro private chains importing premium U.S. and EU brands, while tier-2 public facilities rely on local manufacturers to meet make-in-India quotas. Japan’s aging populace drives demand for minimally invasive suites, yet strict fee schedules cap margins, so hospitals negotiate equipment-as-a-service deals to spread cost.
Europe, Middle East and South America Operating Room Equipment Market
Europe displays a two-speed trajectory. Western markets face austerity budgets and EU MDR re-certification frictions that extend device life beyond planned cycles, softening short-term demand. Eastern members such as Poland and Romania leverage EU Cohesion Funds to retrofit ORs, expanding regional share of the operating room equipment market. In the Middle East, Saudi Arabia’s Vision 2030 healthcare pillar funds 40 new hospitals that embed bilingual visualization interfaces for medical tourism. South America hinges on Brazil, where Sistema Único de Saúde upgrades 1,200 public ORs with LED lights and low-flow anesthesia; tariff-inflated prices slow momentum elsewhere on the continent. Together these regional narratives keep overall operating room equipment market growth resilient despite local idiosyncrasies.

Regulatory Landscape
Operating room equipment vendors face tighter quality and safety expectations, with compliance centered on FDA medical-device regulatory controls in the United States and EU Medical Device Regulation (MDR) requirements in Europe. In February 2026, the FDA transitioned from the legacy Quality System Regulation to the Quality Management System Regulation (QMSR), bringing quality management closer to ISO 13485:2016 and increasing expectations for documentation, supplier controls, and postmarket processes for manufacturers supplying hospital and ASC tenders.
In Europe, MDR implementation continues to change technical documentation and device classification practices, supported by European Commission and Medical Device Coordination Group (MDCG) guidance updates released during 2026. These updates affect classification, nomenclature (EMDN), and borderline determinations. In China, the National Medical Products Administration (NMPA) is also tightening oversight through a 2026 medical-device guideline revisions plan and GMP-focused inspection updates, leading to a new medical-device GMP framework scheduled to take effect in November 2026. This framework raises readiness requirements for local and multinational manufacturers supplying operating-room hardware and connected platforms.
Competitive Landscape
The operating room equipment market exhibits moderate fragmentation: the top vendors—Karl Storz SE & Co. KG, Stryker, Siemens Healthineers, and others—control a significant share of global revenue through extensive installed fleets and service contracts that bundle hardware, software, and disposables. Subscription pricing for visualization, exemplified by Medtronic’s Touch Surgery Enterprise at USD 150 per case, is fragmenting revenue streams and inviting cloud-native entrants such as Proximie and Surgical Theater. These companies require no manufacturing footprint, lowering entry barriers and accelerating feature updates every six months under SaMD clearance windows.
Incumbents respond by opening application-programming interfaces and acquiring adjacencies: Medtronic’s USD 925 million Affera deal added electrophysiology mapping that integrates into existing navigation consoles. Chinese player Mindray captured 12% of Asia-Pacific patient-monitor sales in 2024 with IEC 60601-compliant devices priced 30–40% below Western peers, while India’s Trivitron leverages domestic subsidies to ship anesthesia systems across Southeast Asia and Africa. Regulatory burdens remain substantial: ISO 13485 quality management and FDA 510(k) predicates favor firms with deep documentation libraries. Yet the shift toward modular retrofits and cloud analytics reduces the protective moat around monolithic platforms, and new smoke-evacuation mandates create USD 300–400 million in incremental demand open to nimble specialists.
Future competition will hinge on service responsiveness and data interoperability rather than sole-source hardware. Hospitals increasingly issue tenders requiring real-time carbon tracking, cybersecurity audits, and vendor-agnostic software stacking, pressuring manufacturers to rethink closed ecosystems. As a result, partnerships between imaging giants and niche software firms—such as Siemens Healthineers linking Artis icono angiography to Medivis AR guidance—are multiplying. Stakeholders that align with hospital pain points on sustainability, cybersecurity, and staffing shortages are best positioned to expand share within the operating room equipment market over the next five years.
Operating Room Equipment Industry Leaders
Koninklijke Philips N.V.
Karl Storz SE & Co. KG
Stryker Corporation
STERIS
Siemens Healthineers AG
- *Disclaimer: Major Players sorted in no particular order
Operating Room Equipment Market Companies Covered in this Report
- Baxter
- Conmed
- Dragerwerk
- GE Healthcare
- Getinge
- Intuitive Surgical
- Karl Storz
- Koninklijke Philips
- Medtronic
- Mindray
- Olympus
- Siemens Healthineers
- Skytron
- Smiths Group
- STERIS
- Stryker
- Zimmer Biomet

Market Opportunities and Future Outlook
Hospitals and ASCs are using procedure backlog recovery and operating efficiency goals to justify upgrades aimed at shortening turnover time and reducing staffing burden. This is creating room for workflow automation and connected integration layers spanning imaging, lighting, anesthesia, and monitoring. Interoperable, data-centric ORs are supported by standards work such as ISO/IEEE 11073-10700:2024 for Service-oriented Device Connectivity (SDC), which outlines device-to-device interoperability in acute care settings and is increasingly reflected in tender language that calls for vendor-agnostic connectivity rather than isolated point solutions.
Robotics and image-guided surgery continue to support pull-through for adjacent operating-room capital, including navigation, visualization, and intraoperative imaging that can be configured for modular retrofits. In 2026, key vendors advanced roadmaps through regulatory pathways and footprint changes, including Medtronic submitting FDA 510(k) filings to expand the Hugo robotic-assisted surgery system into general surgery and gynecology, and Intuitive Surgical completing the acquisition of distribution operations to establish direct coverage across multiple Southern European countries. Alongside carbon-reduction procurement criteria already influencing LED lighting and low-flow anesthesia replacement cycles, these steps support near-term demand for modular upgrades, software subscriptions tied to per-procedure use, and cybersecurity-hardened connectivity for integrated OR platforms.
Recent Industry Developments in Operating Room Equipment Market
- July 2026: Stryker launched the TPX HD small bone power tool for complex orthopedic procedures, integrating with the CORE 2 Console software ecosystem. The release strengthens Stryker’s position in high-throughput orthopedic suites where equipment uptime, standardized consoles, and workflow compatibility influence purchasing decisions.
- May 2026: Siemens Healthineers received FDA clearance for six new interventional systems equipped with the Optiq AI imaging chain. The expanded cleared portfolio supports broader deployment of AI-assisted imaging across interventional and hybrid OR environments, reinforcing competitive differentiation around image quality and integrated digital workflows.
- May 2025: Olympus received FDA 510(k) clearance for its EZ1500 series endoscopes featuring Extended Depth of Field technology and ergonomic design changes. The clearance adds competitive pressure in visualization stacks used across general surgery and gastrointestinal procedures, where image clarity and handling affect standardization choices in hospitals and ambulatory centers.


Operating Room Equipment Market Report Scope and Research Methodology
Market Definition and Coverage
For this study, the market counts the value of equipment installed and used inside an operating room to support surgical procedures, from patient prep to intraoperative monitoring and imaging. Revenues are counted at the point of sale of the equipment and related system hardware.
Scope exclusions: We do not count general hospital infrastructure that is not dedicated to the OR (such as building HVAC, general ward beds, and non-surgical IT).
Segments Covered in This Report
- By Product
- Anesthesia Devices
- Surgical Imaging Systems
- Electrosurgical Devices
- Operating Tables
- Surgical & Exam Lights
- Patient Monitors
- Medical Pendants & Booms
- Smoke Evacuation Systems
- Other OR Equipment
- By Mobility
- Fixed / In-built
- Modular / Retrofit
- Mobile / Portable
- By End User
- Hospitals
- Ambulatory Surgical Centers
- Out-patient Facilities / Specialty Clinics
- By Surgical Specialty
- General Surgery
- Orthopedic Surgery
- Cardiovascular Surgery
- Neurosurgery
- Gynecology & Urology
- ENT & Others
- By Geography
- North America
- United States
- Canada
- Mexico
- Europe
- Germany
- United Kingdom
- France
- Italy
- Spain
- Rest of Europe
- Asia-Pacific
- China
- India
- Japan
- Australia
- South Korea
- Rest of Asia-Pacific
- Middle East and Africa
- GCC
- South Africa
- Rest of Middle East and Africa
- South America
- Brazil
- Argentina
- Rest of South America
- North America
Data Sources, Market Sizing, and Validation
Desk Research
Desk work starts with building the demand picture for surgeries and the supply picture for installed OR capacity. We referenced public sources such as the World Health Organization, the World Bank, OECD health statistics, the US CDC, and Eurostat to understand procedure volumes, hospital capacity, and health spending direction, which then anchor our assumptions.
On the supply and regulatory side, we also reviewed sources such as the US FDA device databases and safety communications, along with peer reviewed clinical and biomedical engineering journals, to track adoption patterns for imaging, anesthesia workstations, and monitoring in the OR. Company filings, investor presentations, association websites, and reputable press were used to map product categories and typical replacement cycles, and paid subscriptions for company financials and patent databases helped cross-check revenue exposure and innovation intensity. These sources are illustrative and not exhaustive, and we used additional references for data collection, validation, and clarification.
Primary Interviews and Surveys
Primary work focused on validating what gets purchased for new OR builds versus replacements, and how pricing changes when systems are modular, retrofitted, or mobile. We spoke with manufacturers, distributors, hospital procurement staff, and clinical users across major regions, which helped us stress-test assumptions on unit demand, average selling prices, and the share of procedures shifting to ambulatory settings.
Distribution of primary research fieldwork respondents
| Company type | Respondent position | Region |
|---|---|---|
| Top tier: 37% | CXOs: 22% | APAC: 47% |
| Mid tier: 41% | Functional/Unit leaders: 19% | EMEA: 33% |
| Smaller Players: 22% | Managers: 59% | Americas: 20% |
Market-Sizing & Forecasting
Sizing is built using a top-down approach where surgery volumes, hospital and ambulatory OR counts, and typical equipment intensity per OR are used to reconstruct the annual spending pool by major product groups. In parallel, we run selective bottom-up approximations using sampled company revenues by product exposure, distributor channel checks, and a simple units times ASP build for a few high value categories to confirm the direction and adjust totals when gaps show up.
Inputs that influence the model include elective versus emergency procedure mix, OR refurbishment and replacement cycles, adoption of minimally invasive surgery (which changes imaging and energy device needs), average system configuration per OR (for booms, lights, tables, and monitors), and pricing progression driven by feature upgrades and service bundling. For forecasting, scenario analysis is used around surgery growth, capital budget tightness, and ambulatory shift, and the final path is aligned to the consensus ranges we heard from industry participants. Where country data is thin, we bridge using proxy indicators like hospital bed capacity and health expenditure trends, and then recheck the results for logical consistency at the regional level.
Data Validation & Update Cycle
Validation is done by comparing the modeled totals against independent signals such as procedure growth trends, hospital capex direction, and the implied per-OR spending level by region, and then checking for outliers that do not fit how procurement usually behaves. If a segment shows a sharp jump or an unusual regional split, we revisit the assumptions and, when needed, re-contact experts to confirm whether the change is real or a modeling artifact.
Before sign-off, the workbook is reviewed in steps so arithmetic, currency conversion timing, and year-to-year transitions are consistent, and key assumptions are documented for repeatability. Reports are refreshed annually, and interim updates are made when there are material events such as major policy changes, supply disruptions, or regulation driven shifts. Right before delivery, a final analyst pass is performed so the numbers reflect the latest available signals.
Mordor Intelligence's Operating Room Equipment Market Size Versus Other Published Estimates
Published market sizes for operating room equipment can differ even when the topic name is the same, since each publisher chooses its own product boundary, timing of the base year, and approach to pricing and replacements. We treat these differences as normal, and then focus on the few choices that usually drive the biggest spread.
Procedure volume trends, reported hospital and ambulatory surgery center expansion, and the implied equipment intensity per operating room are the checks that keep Mordor Intelligence's 2025 value tied to a clearly defined equipment scope instead of loosely combining adjacent hospital categories. Other estimates can shift higher if they fold in broader surgical consumables, include service heavy software layers as equipment, or apply faster ASP escalation without validating it against procurement cycles and modular retrofit adoption.
Benchmark comparison
| Source | Market Size | Gaps in Research Methodology |
|---|---|---|
| Mordor Intelligence | USD 48.72 B (2025) | |
| Global Consultancy A | USD 51.85 B (2025) | Uses a 2024 base and a faster growth curve, and the scope description is broad, which can pull in adjacent OR IT and integration layers beyond core equipment hardware in some line items. |
| Industry Publisher B | USD 42.70 B (2024) | Anchors on a lower 2024 starting point and may apply conservative replacement and upgrade rates across hospitals, which reduces the modeled spending tied to refurbishment cycles and modular retrofits. |
The spread across figures is mainly explained by what gets counted as OR equipment versus adjacent solutions, how the base year is set, and how quickly pricing and replacement demand are assumed to move. By keeping inputs tied to observable surgery and capacity signals and then cross-checking with practical supplier and channel validations, our final number stays traceable to simple steps that can be repeated and audited over time.


Key Questions Answered in the Report
How large will the operating room equipment market be by 2031?
The operating room equipment market size is forecast to reach USD 64.87 billion by 2031.
Which product category leads current revenue?
Anesthesia devices controlled 54.54% of 2025 sales, making them the top-grossing category.
What segment is growing fastest?
Surgical imaging solutions are projected to expand at a 10.25% CAGR through 2031.
Why are ambulatory surgical centers important?
ASCs are expected to grow 9.82% CAGR as reimbursement now covers complex robotic procedures.
How will EU MDR 2027 affect procurement?
Re-certification bottlenecks are delaying European refresh cycles until cleared after December 2027.
Which region shows the strongest growth potential?
Asia-Pacific is projected to post a 6.12% CAGR through 2031, narrowing the gap with North America.
Page last updated on:


 Your data is secure and never sold or shared.


