Medical Equipment Maintenance Market Size and Share
Market Overview
| Study Period | 2020 - 2031 |
|---|---|
| Market Size (2026) | USD 65.54 Billion |
| Market Size (2031) | USD 108.17 Billion |
| Growth Rate (2026 - 2031) | 10.54% CAGR |
| Fastest Growing Market | Asia-Pacific |
| Largest Market | North America |
| Market Concentration | Medium |
Major Players *Disclaimer: Major Players sorted in no particular order Image © Mordor Intelligence. Reuse requires attribution under CC BY 4.0. | |
Medical Equipment Maintenance Market Analysis by Mordor Intelligence
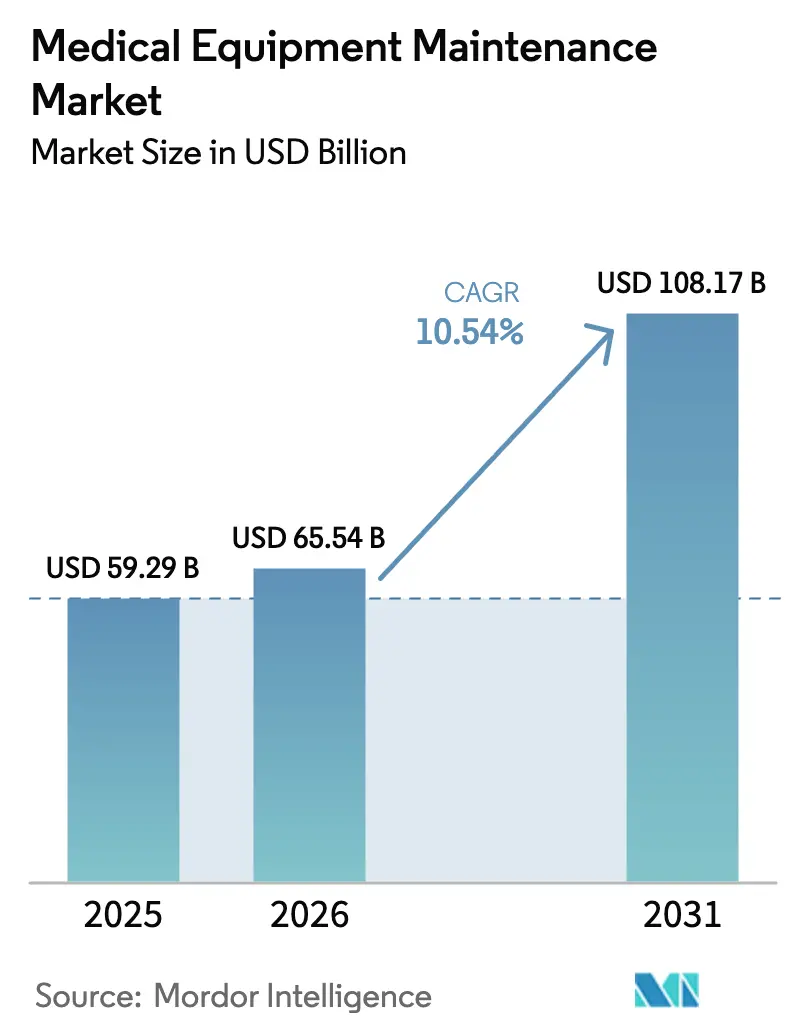
The Medical Equipment Maintenance Market size is projected to expand from USD 59.29 billion in 2025 and USD 65.54 billion in 2026 to USD 108.17 billion by 2031, registering a CAGR of 10.54% between 2026 to 2031.
The market’s expansion is underpinned by hospitals moving from reactive repairs to predictive, IoT-enabled service models that tie uptime to reimbursement outcomes. Regulations such as the EU MDR and China’s NMPA now require documented availability thresholds, making maintenance a compliance obligation rather than a discretionary budget line. Demand is further reinforced by pay-per-use equipment contracts that bundle service costs into per-procedure fees, especially for high-capital imaging and robotic surgical systems. Independent service organizations (ISOs) are also gaining momentum because right-to-repair regulations are eroding OEM parts monopolies. At the same time, shortages of biomedical engineers and semiconductor supply-chain disruptions are challenging service delivery, rewarding providers that invest in workforce training, secure IoT gateways, and regional parts depots.
Key Report Takeaways
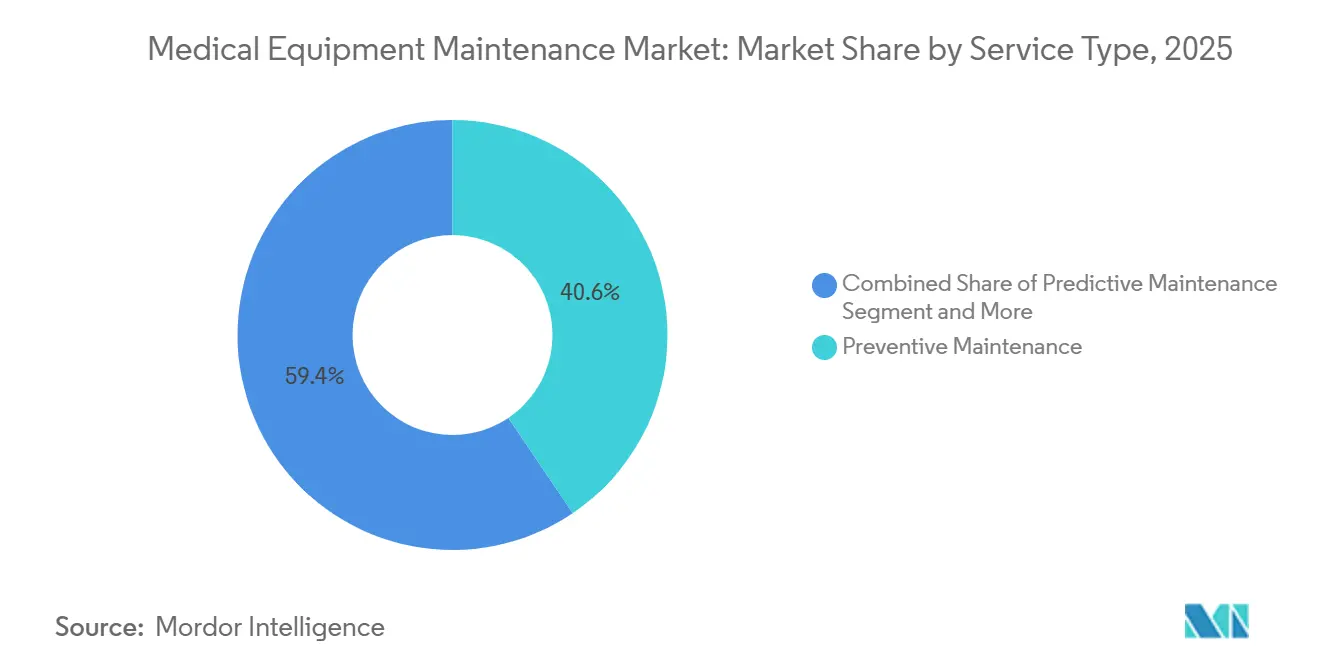
- By service type, preventive maintenance led with 40.56% revenue share in 2025; predictive maintenance is set to advance at a 12.25% CAGR through 2031.
- By contract model, full-service agreements captured 47.53% share in 2025, while multi-vendor contracts are projected to climb at an 11.85% CAGR to 2031.
- By equipment type, imaging systems accounted for 31.63% of the medical equipment maintenance market share in 2025; surgical equipment is forecast to grow at a 14.87% CAGR through 2031.
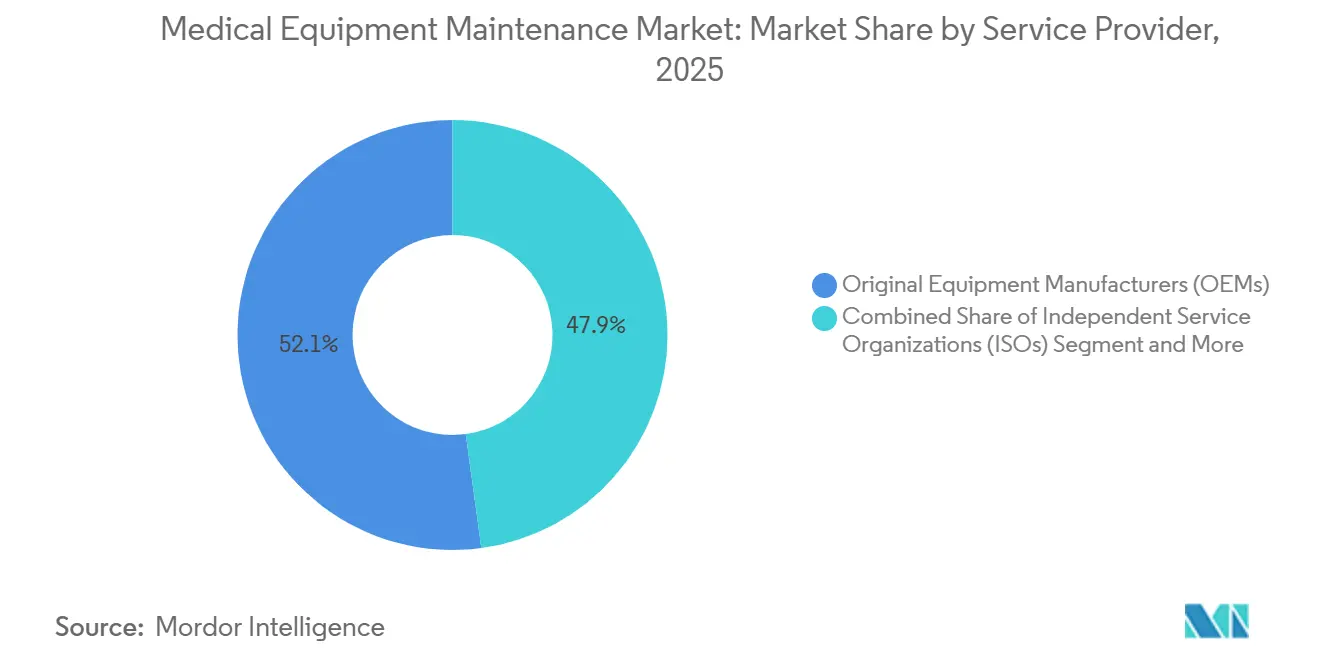
- By service provider, OEMs held 52.13% share in 2025; ISOs are expected to expand at a 13.7% CAGR through 2031.
- By end user, hospitals represented 48.13% of spending in 2025, whereas ambulatory surgical centers are projected to rise at a 12.51% CAGR to 2031.
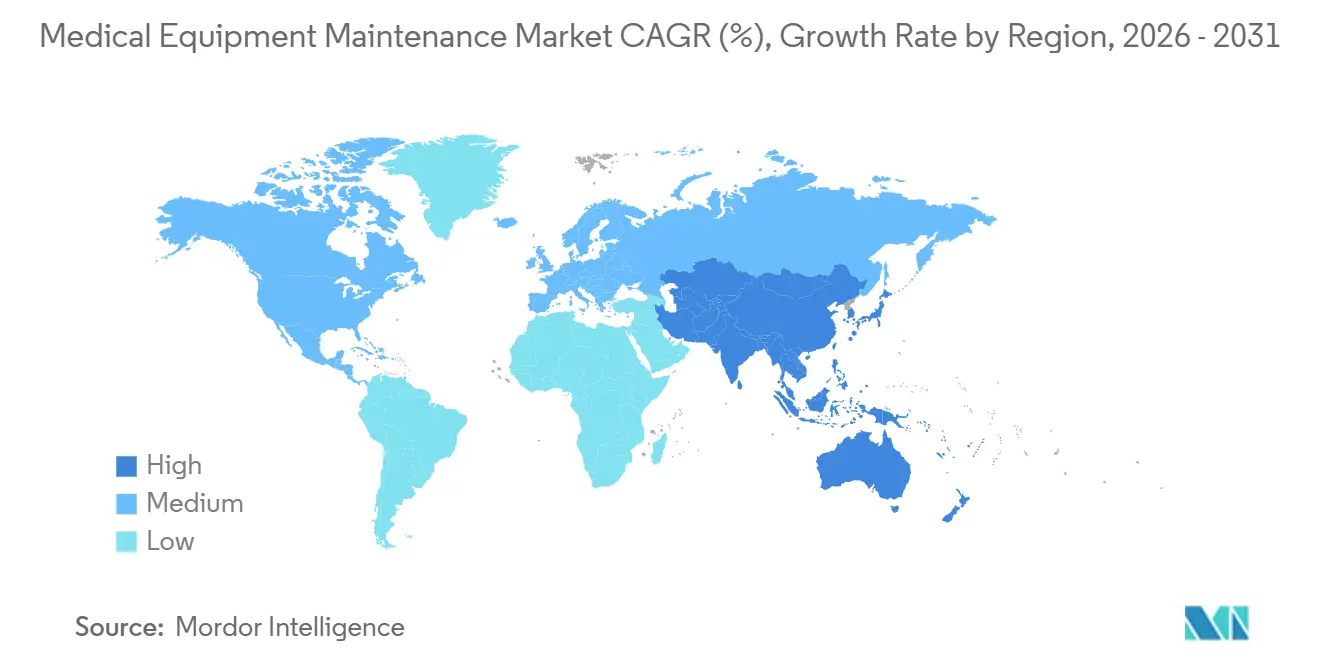
- By geography, North America commanded 35.13% of 2025 revenue; Asia-Pacific is anticipated to progress at an 11.81% CAGR through 2031.
Note: Market size and forecast figures in this report are generated using Mordor Intelligence’s proprietary estimation framework, updated with the latest available data and insights as of January 2026.
Global Medical Equipment Maintenance Market Trends and Insights
Drivers Impact Analysis*
| Driver | (~) % Impact on CAGR Forecast | Geographic Relevance | Impact Timeline |
|---|---|---|---|
| Focus on preventive maintenance programs | +1.8% | Global, led by North America and Europe | Medium term (2-4 years) |
| Rising healthcare infrastructure investments | +2.1% | Asia-Pacific core, spill-over to Middle East | Long term (≥4 years) |
| Expanding installed base of imaging equipment | +1.5% | Global, concentrated in urban hospital systems | Short term (≤2 years) |
| IoT-enabled remote diagnostics adoption | +2.3% | North America and EU early, Asia-Pacific scaling | Medium term (2-4 years) |
| Regulatory uptime mandates (EU MDR, NMPA) | +1.4% | Europe and China | Short term (≤2 years) |
| Shift to value-based pay-per-use contracts | +1.6% | North America and Western Europe | Medium term (2-4 years) |
| Source: Mordor Intelligence | |||


Focus on Preventive Maintenance Programs
Hospitals are embedding preventive schedules into daily clinical workflows to avoid costly downtime. ASHE reported that structured programs cut equipment failure by 22% in 2024. Imaging departments feel the greatest benefit because a single MRI outage can cancel dozens of procedures, eroding revenue. Firmware updates, calibration checks, and consumable swaps are now automated through OEM portals that schedule work orders in advance. The economic case has strengthened as device complexity rises; a modern MRI has more than 50 subsystems, and any unscheduled failure can idle the unit for weeks if parts are not pre-staged. Consequently, hospitals negotiate preventive clauses within lease agreements to convert service costs into predictable operating expenses that align with value-based reimbursement.
Rising Healthcare Infrastructure Investments
China’s 14th Five-Year Plan earmarked CNY 1.2 trillion (USD 168 billion) for hospital construction through 2025, mandating multi-year maintenance contracts within every procurement package[1]National Health Commission of China, “14th Five-Year Plan,” nhc.gov.cn. India’s Ayushman Bharat program scaled to 200,000 wellness centers by 2024, each equipped with basic diagnostics that require local service teams. OEMs and ISOs are setting up regional hubs to meet the ensuing demand and train biomedical technicians. Emerging Southeast Asian markets such as Indonesia and Vietnam follow similar paths via public-private partnerships that bundle maintenance into long-term project financing to protect lenders’ assets.
Expanding Installed Base of Imaging Equipment
MRI installations exceeded 85,000 units and CT scanners surpassed 72,000 units globally by 2025, growing 3-4% annually. Each high-field MRI generates USD 50,000–80,000 in yearly maintenance revenue, and the transition toward 3-Tesla and 7-Tesla platforms heightens service intensity due to demanding calibration protocols. North America and Europe replace decade-old assets with AI-enhanced models that need frequent software updates, while Asia-Pacific adds first-time capacity in secondary cities. This bifurcation creates distinct service opportunities: retrofit contracts dominate mature markets whereas installation and training services flourish in growth regions.
IoT-Enabled Remote Diagnostics Adoption
Connected devices now transmit telemetry to cloud analytics platforms that predict failures up to 10 days in advance. Philips’ HealthSuite provides real-time ventilator performance data that flags sensor drift and filter saturation. The FDA’s 2023 cybersecurity guidance imposes secure update requirements, adding a compliance layer to remote diagnostics. Adoption is mature in North America and Europe but remains limited in parts of Asia-Pacific due to network and cybersecurity gaps.
Restraints Impact Analysis*
| Restraint | (~) % Impact on CAGR Forecast | Geographic Relevance | Impact Timeline |
|---|---|---|---|
| High cost of service contracts | -1.2% | Global, acute in emerging markets | Short term (≤2 years) |
| Shortage of skilled biomedical engineers | -1.5% | North America and Europe, spreading to Asia-Pacific | Medium term (2-4 years) |
| Cybersecurity liabilities in remote maintenance | -0.9% | North America and EU | Medium term (2-4 years) |
| Replacement-parts supply-chain disruptions | -1.1% | Global, episodic spikes in Asia-Pacific sourcing | Short term (≤2 years) |
| Source: Mordor Intelligence | |||
High Cost of Service Contracts
Full-service agreements for imaging devices can exceed 10% of purchase price each year, straining budgets in price-sensitive regions. An AAMI survey showed 38% of hospitals in Latin America and Southeast Asia operate equipment beyond prescribed service intervals, risking catastrophic failures. Smaller facilities lack negotiating clout, often opting for ad-hoc fixes that reduce immediate costs but increase long-term downtime.
Shortage of Skilled Biomedical Engineers
Demand for biomedical technicians is growing 5% annually in the United States, yet supply lags with fewer than 3,000 graduates each year[2]U.S. Bureau of Labor Statistics, “Employment Projections for Biomedical Technicians,” bls.gov. OEMs like Siemens Healthineers and GE HealthCare have opened in-house academies, but talent gaps persist, particularly for advanced modalities. India faces a deficit of 15,000 engineers, forcing hospitals to rely on OEM field teams or extend maintenance intervals, which threatens uptime guarantees.
*Our forecasts treat driver/restraint impacts as directional, not additive. The impact forecasts reflect baseline growth, mix effects, and variable interactions.
Segment Analysis
By Service Type: Predictive Analytics Reshaping Intervention Timing
In 2025 preventive maintenance captured a 40.56% slice of the medical equipment maintenance market share. Predictive maintenance is projected to outpace all other services at a 12.25% CAGR to 2031. Hospitals favor algorithm-driven interventions that dispatch technicians only when sensor data signals a failure risk. This change reduces unnecessary visits and improves asset availability. Corrective repairs remain relevant, yet their proportion is shrinking as value-based contracts penalize downtime. Operational maintenance, including user training and daily calibrations, is expanding alongside adoption of complex platforms such as robotic surgery.
The shift toward predictive routines is most pronounced in North America and Western Europe, where IT infrastructure supports telemetry integration. Emerging markets still rely on calendar-based schedules because of limited network bandwidth. As a result, predictive offerings represent a premium service tier that OEMs and leading ISOs market to facilities seeking higher uptime guarantees. Over the forecast horizon, predictive models will become the default approach as cloud connectivity and cybersecurity frameworks mature globally, narrowing the performance gap between advanced and developing health systems.


By Contract Model: Multi-Vendor Agreements Gaining Traction
Full-service agreements held 47.53% of contract value in 2025, underpinning the medical equipment maintenance market size because hospitals prefer the certainty of fixed annual fees that cover parts and labor. Multi-vendor contracts are expanding at an 11.85% CAGR through 2031, driven by integrated delivery networks aiming to streamline administration and leverage fleet-wide data analytics. These arrangements allow providers to negotiate larger discounts and achieve standardized response times across diverse equipment brands. Time-and-material contracts remain common in small clinics willing to accept variable costs, while shared-service models, where expenses are split between hospital and OEM, are emerging as a cost-controlled middle option.
The rise of multi-vendor coverage compels OEMs to unbundle traditional packages into modular offerings. ISOs position themselves as neutral partners able to service mixed fleets, using third-party diagnostic tools legalized under right-to-repair statutes. Over time, contract structures will become more granular, with uptime clauses and performance metrics tailored by device criticality, amplifying competition on service price and quality.
By Equipment Type: Surgical Platforms Driving Service Intensity
Imaging devices accounted for 31.63% of 2025 spending, emphasizing the segment’s importance within the medical equipment maintenance market. MRI systems, which require cryogen management and periodic gradient-coil calibration, dominate service budgets in this category. CT scanners need frequent tube replacements, creating ongoing parts revenue. Surgical equipment is projected to grow fastest at 14.87% CAGR through 2031, propelled by robotic platforms that demand quarterly preventive checks and continuous software upgrades. Electrosurgical instruments contribute recurring income via electrode and handpiece refurbishments.
Life-support equipment saw heightened maintenance demand during the COVID-19 pandemic and remains a focus for preparedness planning. Patient-monitoring systems, dialysis units, and endoscopes add incremental but steady service revenue as chronic diseases rise and outpatient care expands. Each equipment group carries distinct regulatory obligations, such as IEC 60601 electrical safety testing for patient-connected devices, influencing contract scope and pricing.
By Service Provider: ISOs Eroding OEM Market Share
OEMs maintained 52.13% of 2025 revenue, reflecting established installed bases and proprietary diagnostics that secure premium pricing. ISOs are forecast to post a 13.7% CAGR, gaining ground as regulators mandate parts access and hospitals seek cost efficiencies. Legislative momentum behind right-to-repair laws compels OEMs to supply diagnostic software to third parties, leveling the playing field. ISOs invest in factory-grade training and offer response-time guarantees comparable to OEMs yet 20-30% cheaper.
In-house biomedical teams also grow in influence, particularly at large academic centers that view maintenance as a strategic capability. OEM dominance persists in high-complexity modalities such as MRI and robotic surgery, where specialized components and software remain tightly controlled, but ISOs have achieved parity in patient monitoring and dialysis devices where parts are standardized.
By End User: ASCs Driving Service Innovation
Hospitals commanded 48.13% of 2025 spending, reflecting diverse equipment portfolios and enterprise-wide service contracts. Academic centers often embed remote monitoring and dedicated on-site technicians within these agreements. Ambulatory surgical centers, however, are projected to expand fastest at a 12.51% CAGR through 2031, as elective procedures continue to migrate to outpatient settings. ASCs operate lean staff models, requiring rapid service turnarounds—often within four hours—to avoid costly cancellations. Diagnostic imaging chains adopt predictive maintenance early to minimize patient rescheduling. Dialysis centers prioritize 99% uptime, shifting to comprehensive service deals that include consumables and water-quality management.
Laboratories, dental clinics, and specialty practices contribute modest but growing volumes as point-of-care diagnostics spread. Home-care equipment maintenance is an emerging niche, where remote monitoring of portable devices combines periodic home visits to ensure patient safety and device performance.
Geography Analysis
North America claimed 35.13% of revenue in 2025, driven by widespread adoption of predictive analytics and dense networks of ASCs and imaging centers. More than 40% of new imaging equipment sales in the United States now bundle service subscriptions. Canada directs provincial grants toward equipment purchases that require multi-year maintenance agreements, and Mexico’s private hospitals secure OEM contracts to meet international accreditation standards. FDA cybersecurity rules set the benchmark for remote-service compliance across the region, influencing global OEM practices.
Asia-Pacific is forecast to register the highest CAGR at 11.81% through 2031. China’s infrastructure plan mandates standardized maintenance within county-level hospitals, expanding the medical equipment maintenance market size for OEMs and ISOs alike. India’s wellness centers add thousands of basic diagnostics requiring regional service hubs[3]Ministry of Health and Family Welfare (India), “Ayushman Bharat Expansion,” mohfw.gov.in. Japan and South Korea replace aging scanners with AI-ready platforms that use subscription software updates. Australia’s consolidated private-hospital groups negotiate enterprise-wide contracts, while Indonesia and Vietnam add first-time capacity via public-private projects supported by regional service centers in Singapore and Bangkok. Workforce shortages remain a challenge, slowing adoption of predictive maintenance in less urban areas.
Europe maintained a substantial share in 2025, spearheaded by Germany, the United Kingdom, and France. The EU MDR harmonizes uptime documentation, encouraging digital asset-management platforms and boosting service spending. Germany favors all-inclusive agreements with comprehensive reporting. The U.K.’s National Health Service pilots shared-risk models to curb costs, while Southern European nations rely increasingly on ISOs to relieve budget pressure. The Middle East and Africa witness expansion in GCC states investing in medical tourism, whereas Latin America’s growth centers on Brazil and Argentina’s private hospitals upgrading to international standards despite public-sector funding gaps.

Competitive Landscape
The medical equipment maintenance market is moderately concentrated. OEMs - GE HealthCare, Siemens Healthineers, Philips, and Canon Medical - collectively command a significant percentage of worldwide service revenue through proprietary diagnostics and installed-base advantage. ISOs unbundle these offerings and deliver 20-30% savings, leveraging recent right-to-repair policies. Competition now revolves around data analytics rather than parts alone. OEMs deploy cloud platforms such as GE’s Edison, Philips’ HealthSuite, and Siemens’ Teamplay that convert maintenance into recurring software subscriptions tied to uptime guarantees. ISOs counter with enterprise asset-management partnerships and factory-trained technicians.
Home-care device maintenance and multi-vendor contracts offer white-space opportunities. Smaller regional ISOs and hospital in-house teams gain share in commodity categories where standardized parts weaken OEM leverage. Nevertheless, OEMs retain dominance in high-complexity fields like MRI and robotic surgery that require specialized software and training. Cybersecurity compliance raises barriers to entry, as the FDA’s 2023 guidance mandates robust processes for vulnerability management. Providers investing in secure IoT gateways and workforce development are best positioned to capture share amid tightening uptime guarantees.
Medical Equipment Maintenance Industry Leaders
Koninklijke Philips NV
GE Healthcare.
Canon Medical Systems
Siemens Healthineers
Stryker
- *Disclaimer: Major Players sorted in no particular order

Recent Industry Developments
- May 2025: The International Biomed Cross initiative launched in New Delhi to support maintenance of medical devices during disasters and health emergencies.
- February 2025: Sodexo India opened a Healthcare Technology Management facility in Kolkata capable of supporting 500,000 devices.


Global Medical Equipment Maintenance Market Report Scope
As per the scope of the report, medical equipment maintenance involves all activities relating to providing an adequate level of service and limiting downtime of medical devices in the facility. Traditionally, equipment maintenance is categorized as preventive maintenance and corrective maintenance.
The segmentation of the Medical Equipment Maintenance Market is categorized by service type, contract model, equipment type, service provider, and end user. By service type, the market includes preventive maintenance, corrective maintenance, operational maintenance, predictive maintenance, and software & firmware updates. Based on the contract model, it is segmented into full-service agreements, shared-service agreements, time & material contracts, and multi-vendor contracts. By equipment type, the market covers imaging equipment, endoscopic devices, surgical equipment, life-support devices, patient monitoring equipment, dialysis equipment, and other devices. The service provider segmentation includes original equipment manufacturers (OEMs), independent service organizations (ISOs), and in-house biomedical teams. By end user, the market is divided into hospitals, diagnostic imaging centers, ambulatory surgical centers, dialysis centers, laboratories, dental & specialty clinics, and home-care settings. By geography, the market is segmented into North America, Europe, Asia-Pacific, Middle-East and Africa, and South America. The report offers the value (in USD) for the above segments.
| Preventive Maintenance |
| Corrective Maintenance |
| Operational Maintenance |
| Predictive Maintenance |
| Software & Firmware Updates |
| Full-Service Agreements |
| Shared-Service Agreements |
| Time & Material Contracts |
| Multi-Vendor Contracts |
| Imaging Equipment | MRI Systems |
| CT Scanners | |
| X-ray & Fluoroscopy | |
| Ultrasound | |
| Nuclear Medicine & PET | |
| Endoscopic Devices | |
| Surgical Equipment | Electrosurgical Devices |
| Robotic Surgical Systems | |
| Minimally-Invasive Devices | |
| Life-Support Devices | Ventilators |
| Anesthesia Machines | |
| Patient Monitoring Equipment | |
| Dialysis Equipment | |
| Other Devices |
| Original Equipment Manufacturers (OEMs) |
| Independent Service Organizations (ISOs) |
| In-house Biomedical Teams |
| Hospitals |
| Diagnostic Imaging Centers |
| Ambulatory Surgical Centers |
| Dialysis Centers |
| Laboratories |
| Dental & Specialty Clinics |
| Home-Care Settings |
| North America | United States |
| Canada | |
| Mexico | |
| Europe | Germany |
| United Kingdom | |
| France | |
| Italy | |
| Spain | |
| Rest of Europe | |
| Asia-Pacific | China |
| Japan | |
| India | |
| South Korea | |
| Australia | |
| Rest of Asia-Pacific | |
| Middle East & Africa | GCC |
| South Africa | |
| Rest of Middle East & Africa | |
| South America | Brazil |
| Argentina | |
| Rest of South America |
| By Service Type | Preventive Maintenance | |
| Corrective Maintenance | ||
| Operational Maintenance | ||
| Predictive Maintenance | ||
| Software & Firmware Updates | ||
| By Contract Model | Full-Service Agreements | |
| Shared-Service Agreements | ||
| Time & Material Contracts | ||
| Multi-Vendor Contracts | ||
| By Equipment Type | Imaging Equipment | MRI Systems |
| CT Scanners | ||
| X-ray & Fluoroscopy | ||
| Ultrasound | ||
| Nuclear Medicine & PET | ||
| Endoscopic Devices | ||
| Surgical Equipment | Electrosurgical Devices | |
| Robotic Surgical Systems | ||
| Minimally-Invasive Devices | ||
| Life-Support Devices | Ventilators | |
| Anesthesia Machines | ||
| Patient Monitoring Equipment | ||
| Dialysis Equipment | ||
| Other Devices | ||
| By Service Provider | Original Equipment Manufacturers (OEMs) | |
| Independent Service Organizations (ISOs) | ||
| In-house Biomedical Teams | ||
| By End User | Hospitals | |
| Diagnostic Imaging Centers | ||
| Ambulatory Surgical Centers | ||
| Dialysis Centers | ||
| Laboratories | ||
| Dental & Specialty Clinics | ||
| Home-Care Settings | ||
| By Geography | North America | United States |
| Canada | ||
| Mexico | ||
| Europe | Germany | |
| United Kingdom | ||
| France | ||
| Italy | ||
| Spain | ||
| Rest of Europe | ||
| Asia-Pacific | China | |
| Japan | ||
| India | ||
| South Korea | ||
| Australia | ||
| Rest of Asia-Pacific | ||
| Middle East & Africa | GCC | |
| South Africa | ||
| Rest of Middle East & Africa | ||
| South America | Brazil | |
| Argentina | ||
| Rest of South America | ||


Key Questions Answered in the Report
How large is the medical equipment maintenance market in 2026?
The market stands at USD 65.54 billion in 2026 and is projected to grow to USD 108.17 billion by 2031, reflecting a 10.54% CAGR.
Which service type is expanding fastest?
Predictive maintenance is advancing at a 12.25% CAGR because IoT sensors and analytics enable condition-based interventions.
Why are multi-vendor contracts gaining popularity?
Integrated delivery networks prefer a single contract for mixed fleets to cut administrative costs and win volume discounts, driving an 11.85% CAGR.
Which region will record the highest growth through 2031?
Asia-Pacific is forecast to grow at 11.81% annually due to extensive hospital construction in China and India and rising equipment installations in secondary cities.
How are right-to-repair laws affecting the market?
These laws compel OEMs to sell parts and diagnostic software to ISOs, enabling third-party service providers to match OEM quality at lower prices and eroding OEM market share.
Page last updated on:


